FCEV_Project_1
Project :-
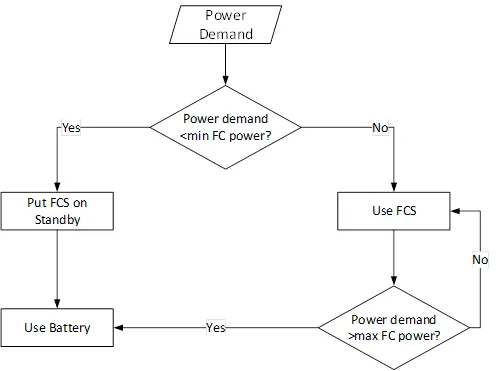
Create a stateflow or Simulink model for the following flowchart.
Load the .mat file into the workspace.
The input to the model would be the power demand.
The output should be:
- Fuel cell power
- Battery power
- FC Operating state (running, standby) Create plot of these outputs against time.
-------------------------------------------------------------------------------------------------------------------------------------------------------------
Aim of Project:-
The main aim of the project is to create the Simulink model as for the given Flow chart with Input as Power Demand and outputs are Battery power,Fuel cell power and Fuel cell operating state.
Procedure:-
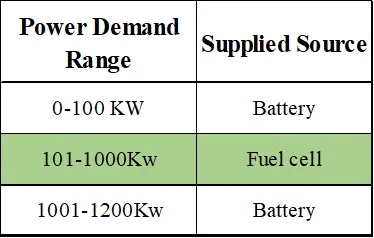
for create the model with help of given flow chart we have to assume the maximum and minimum value of the power demand for fuel cell and the battery.
Let us assume,
The minimum power demand is considered as 100W and Maximum Power Demand is considered 1000W.
- The 100 W and 1000W is power demand is suppiled by the Fuel Cell and
- The other demand is suppiled by the battery.
Simulink model :-
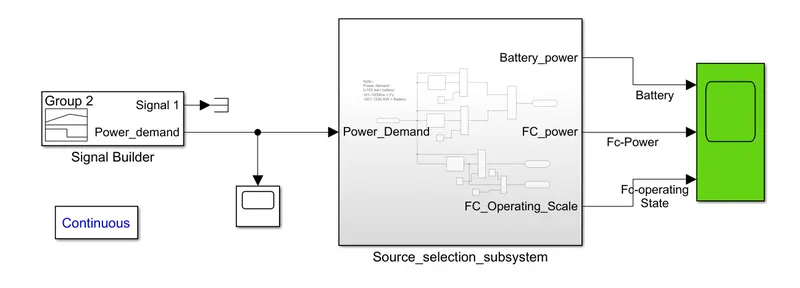
For creating the simulink model for the given Flow chart we are using the following Blocks.
- Interval test
- Signal Builder
- Switch
- In1
- output port
- Constant
- terminator
- PowerGui
- Scope.
Steps for creating the simulink model :-
The total Simulink Model is as follows:-
Procedure for creating the Simulink model :-
Firstly we have to create the power demand by using the Signal Builder blcok.
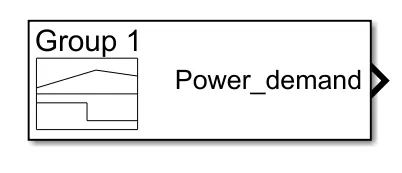
I was created the Power demand in Excell sheet for the 70sec of time as followes .
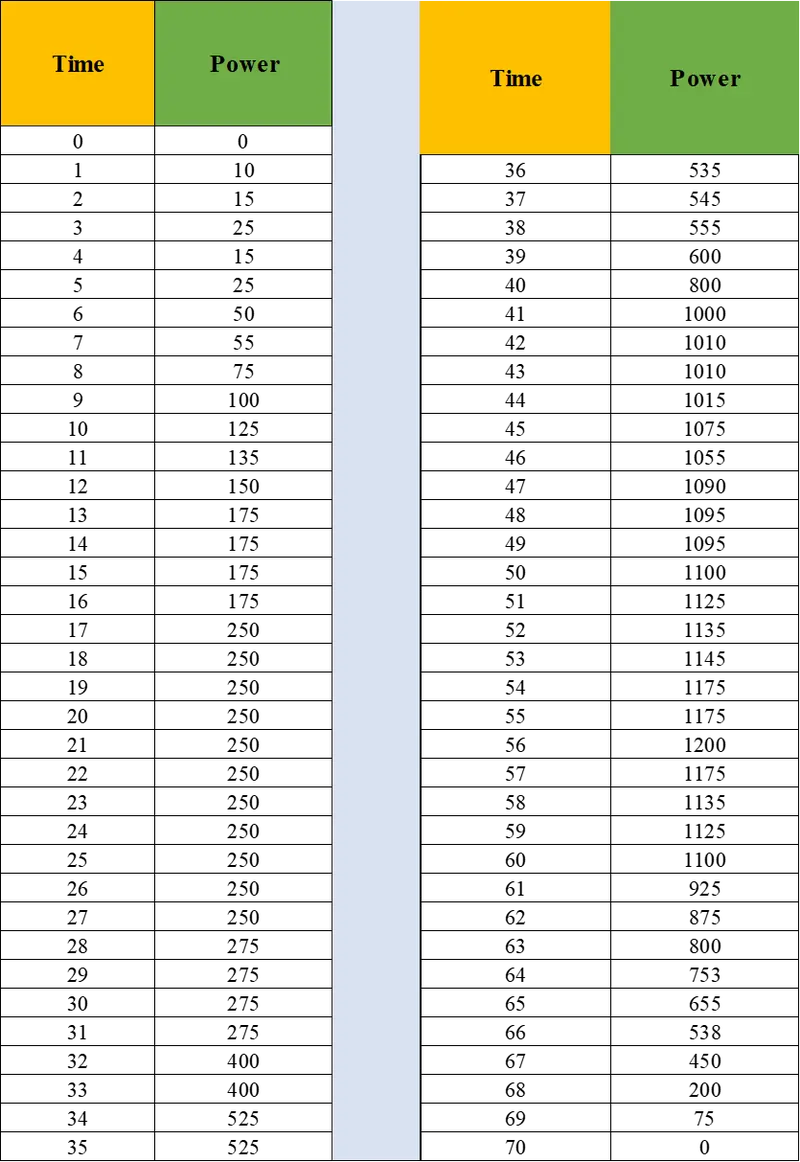
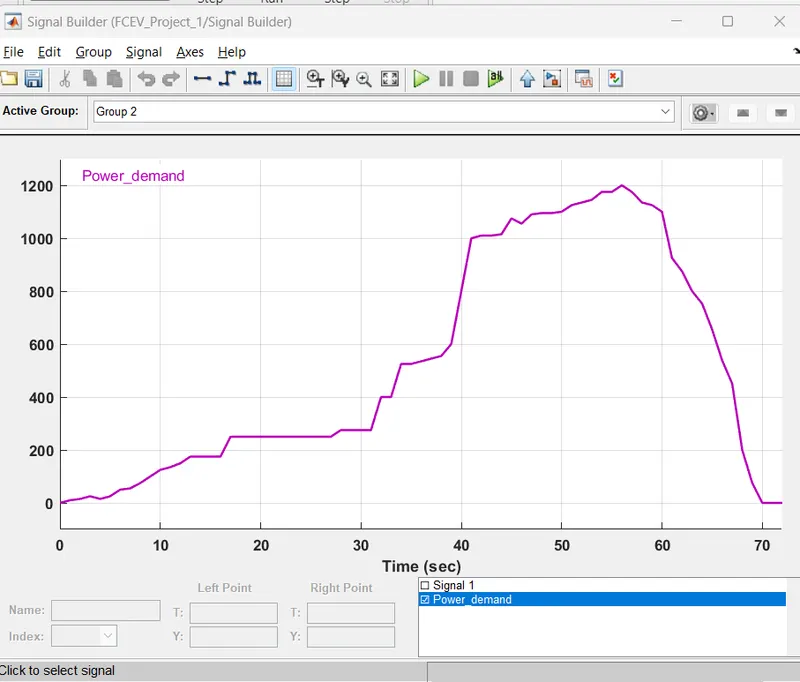
Import the above Excell_sheet of power demand into the signal builder then it will lokks as followes.
Now preparing the Simulink model power the Power demand between 0-100KW and 1001 Kw - 1200 Kw that is this mode will gives the power demand from the source as "Battery" as for the given Flow chart.
The simulink model for the battery source power demand between above mentioned power demand.
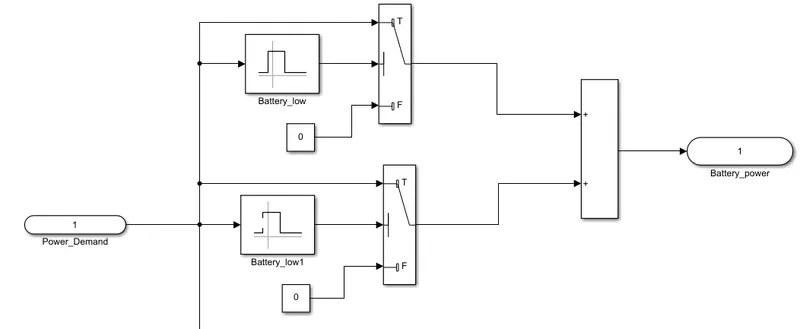
>>Here the power demand from the Battery source that menas we are using the "Interval test" block for setting the upper limit and lower limit for power demand.
>>Here we are using the two set for high level and low level power demand.
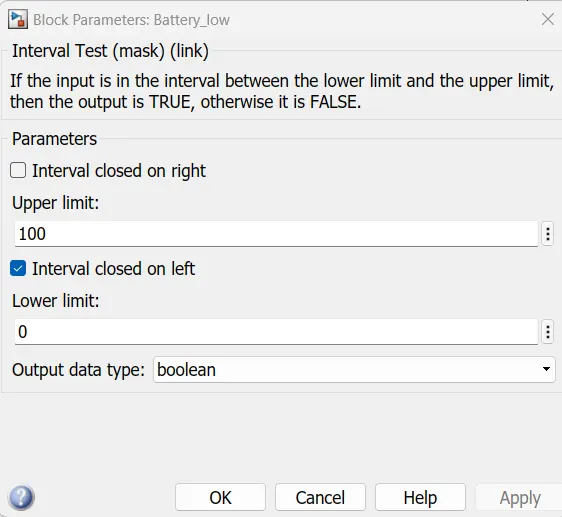
>>That is the the interval test block is for Low level between 0-100KW as follows:-
>>That is the the interval test block is for High evel between 1001KW-1200 KW as follows:-
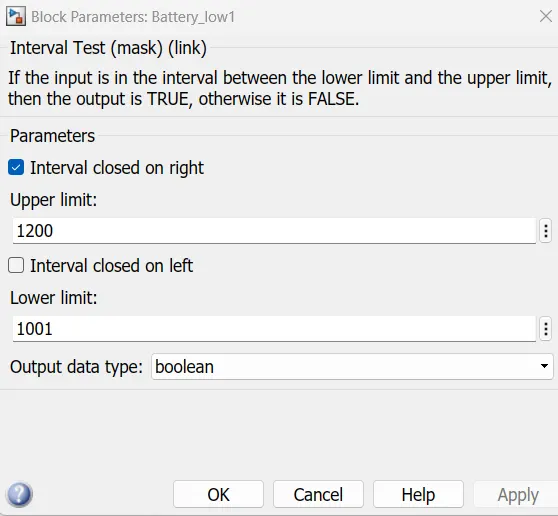
>>By adding theese two High and Low power demand will supplyied by the battery Power source. with the help of Add Block. as shown in above Simulink model.
>> In this step we are creating the Simulink model forthe Source of "Fuel cell " source as follows.
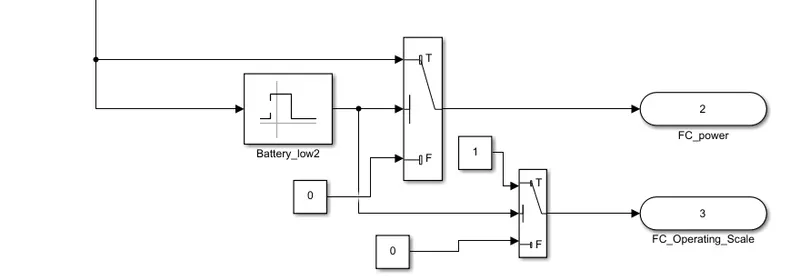
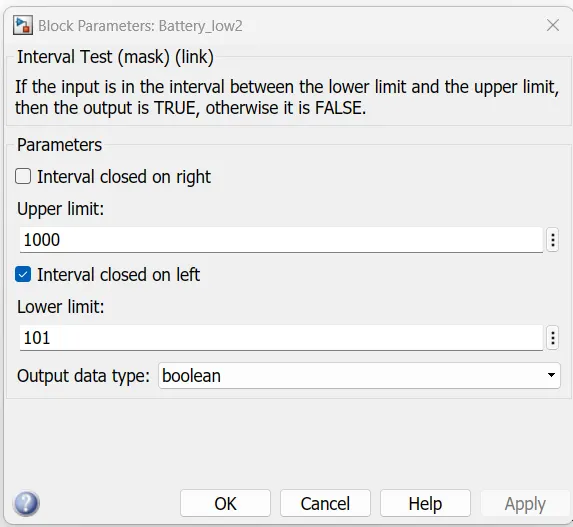
>> Here we are using the anothe Interval test block for setting the power demand between 101 KW-1000 KW.
>>The Simulink model as follows.
The total subsystem block is as follows.:-
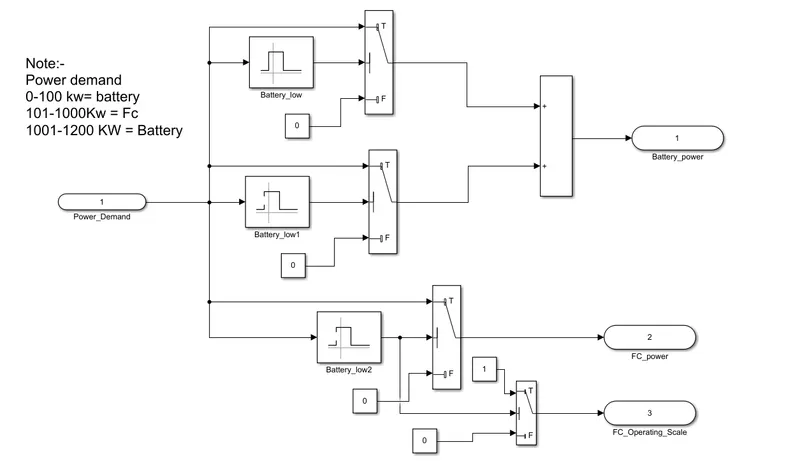
>> Here we are creating the Simulink model for the For "FC Operating state" as follows:-
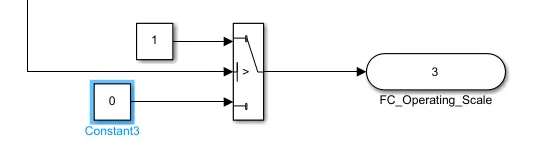
>>Here the 1 is for the Running State and 0 Is for the Standby stste.
>>In this block the power is between 100 to 1000 output from the switch from 1 ON state and 1000 to 100 will be OFF State..
This Power Demand will be understand by using the below Output graphical representation.
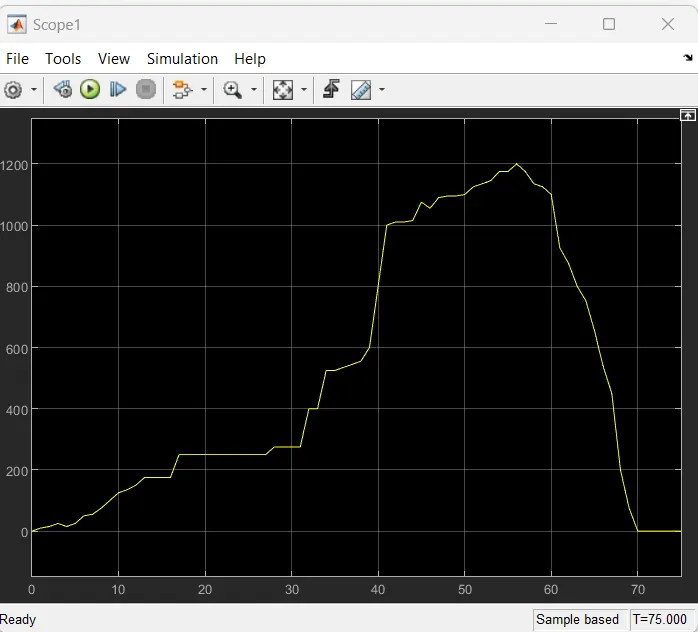
>>the BAove graph give the various time power demand upto 70 sec period of time.
OUTPUT@ BATTERY_FUELCELL_POWER DEMAND)
The output for the requirement as understand by using the follllowing graphical representation.
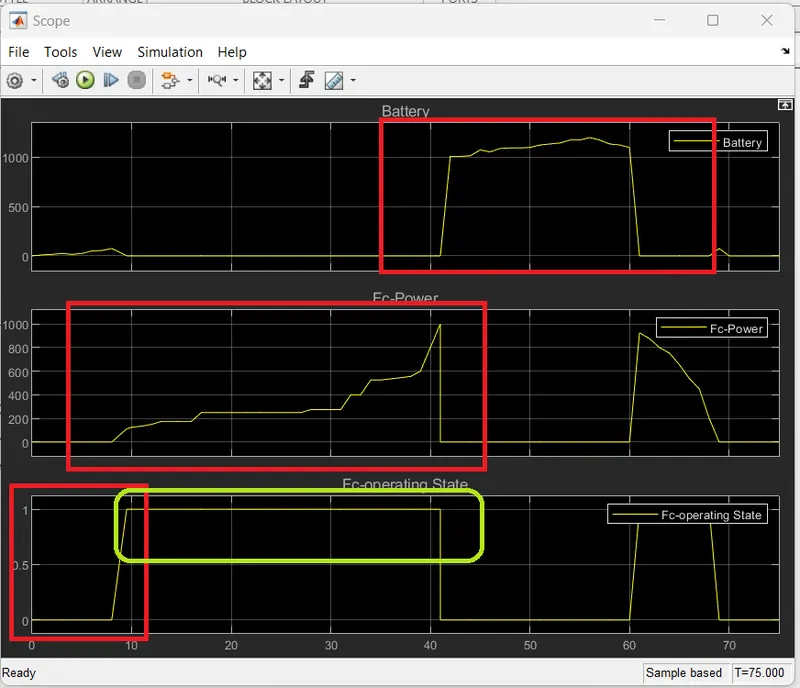
>>From the above graph we can conclude that the Top plot is for Battery source
>>middle Plot is for the FC _Cell Source Power
>>Bottom Plot is for the Fc_power source Operating State.
Observations by using the Datainspector Log as followes:-
Battery_power:-
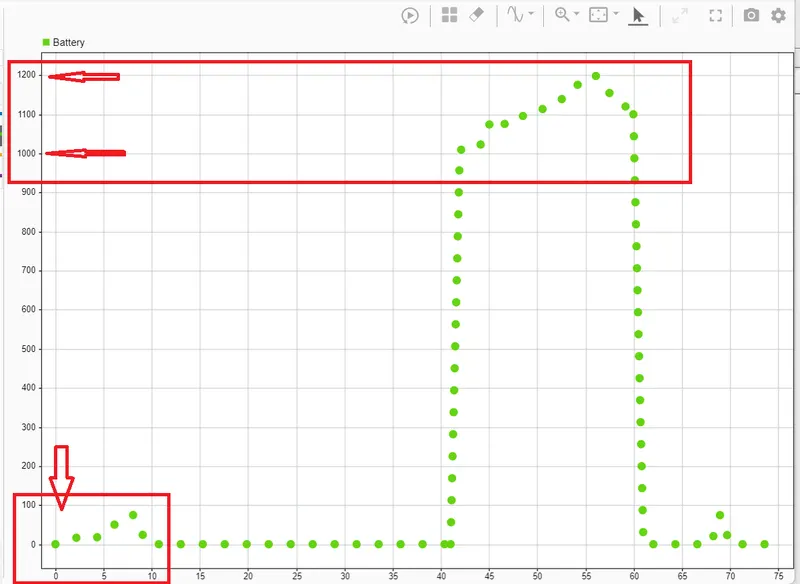
>>From the Above Datainspector graph we can observe that if the power demand i 0-100 KW and 1001 -1200KW only the Battery source wikll getting as ouput power demand.
>>in between the 101-1000 kw The battery source shows the Zero value.
FC_power Source :-
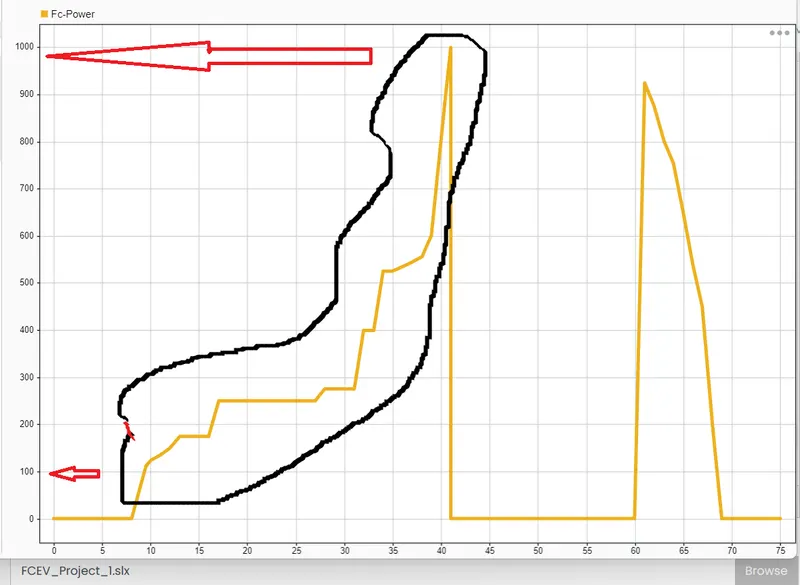
>>From the Above Datainspector graph we can observe that if the power demand 101 -1000 KW only the Fc-source gives the output as power to the Vehicle.
FC-Operating resion :-
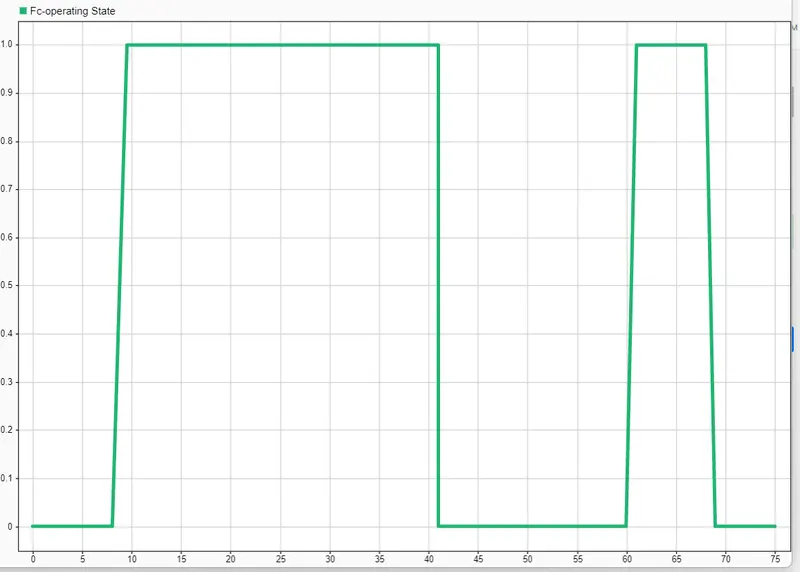
>>From this above graph we can conclude that the the power is between 100 to 1000 output from the switch from 1 ON state and 1000 to 100 will be OFF State.
RESULTS:-
Any Power drawn below 100 and above 1000 is suppiled by the battery.The basic power demand is suppiled by the fuel cell 101 to 1000.
The Fuel Operating State is 1 is ON and 0 is OFF.
---------------------------------------------------------------------------------------------------------------------------------------------
Conclusion :-All of the objectives have been met as per the requirement og given Flow chart.
--------------------------------------------------------------(The End)------------------------------------------------------------------