Read the excel file in the Matlab program and perform the interpolation in the range of -17.3:0.1:0.9. Generate the interactive plot for the interpolated data and store them in a text file:-
a)For this program we have to save the given excel data in MATLAB documents, then we can saw the required data of Excel sheet in MATLAB window, here attached the image view for your reference
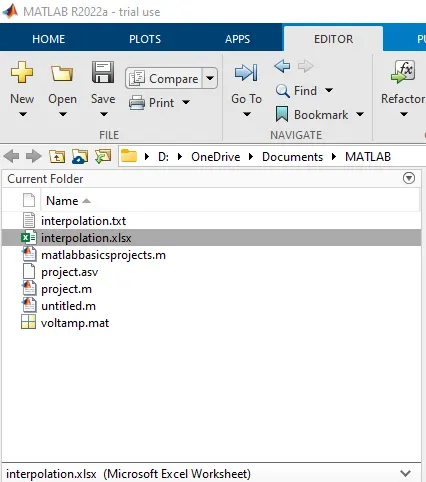
b) After import the excel data we have to read this data in to MATLAB by using MATLAB command "xlsread". and store this data into one independent variable 'A'.
****A=xlsread('interpolation.xlsx','Sheet1’) ***
OUTPUT:-
A =
-17.3000 -28.0000
-17.1000 -24.0000
-17.0000 -19.0000
-16.8000 -14.0000
-16.5000 -9.0000
-16.0000 -6.0000
-15.0000 -4.0000
-14.0000 -3.0000
-12.0000 -2.0000
-10.0000 -1.3000
-8.0000 -1.0000
-5.0000 -0.6000
-2.0000 -0.3000
-0.2000 -0.1000
0.0900 0
0.1900 0
0.2700 0
0.3900 0.0100
0.4300 0.0300
0.5000 0.1700
0.5500 0.4200
0.6000 1.2300
0.6200 1.9900
0.6500 3.9100
here,
A: - independent variable for store the data.
xlsread: - MATLAB command for read the excel data
sheet1:-It indicates in excel sheet which sheet we want to read to MATLAB software.
c)After read the entire data to a MATLAB software we are assigned each row to two dependent variables are as follows
%%% v=A(:,1);
a=A(:,2);
here,
- v: - store the 1st row of independent variable "A" data (1 number indicates 1st row of file-A)
- a: -store the 2nd row of independent variable "A" data (2 number indicates 2nd row of file-A)
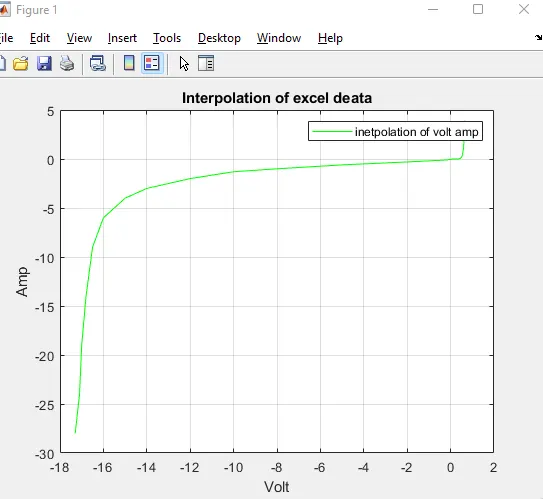
d)After store the data into dependent variable we are performing the plotting to this two varibles by using matlab comand (plot)
HERE MATLAB CODE IS MENTENED BELOW:-
A=xlsread('interpolation.xlsx','Sheet1')
v=A(:,1);
a=A(:,2);
plot(v,a,'-g');grid;hold;
xlabel('Volt');ylabel('Amp');
legend('inetpolation of volt amp');
title('Interpolation of excel deata');
output:-
...................................................................................................................................................................................................
e) Now we are performing the inetrpolation the data by using MATLAB comand in "interp1"
MATLAB CODE :-
A=xlsread('interpolation.xlsx','Sheet1')
v=A(:,1);
a=A(:,2);
plot(v,a,'-g');grid;hold;
xlabel('Volt');ylabel('Amp');
legend('inetpolation of volt amp');
title('Interpolation of excel deata');
V=interp1(v,a)
OPUT AFTER INTERPOLATION :-
V =
-17.2540
-17.1020
-16.8180
f) Now we want the write the text file in matlab by using MATLAB command
#### fileid=fopen('D:\OneDrive\Documents\MATLAB\interpolation.txt','w')
Here,
- D:\OneDrive\Documents\MATLAB\:- indicates the path of the file
- interpolation :- indicated the file name
- .txt :- file fomet
- w:- indicated write the data
g)Now we can save the file By using MATLAB comand "fprintf" followed by
>>>fprintf(fileid,'%d',VV)
Here,
%d :- indicates save the integer value.
Total Project MATLAB code is attached here :-
A=xlsread('interpolation.xlsx','Sheet1')
v=A(:,1);
a=A(:,2);
plot(v,a,'-g');grid;hold;
xlabel('Volt');ylabel('Amp');
legend('inetpolation of volt amp');
title('Interpolation of excel deata');
V=interp1(v,a)
fileidl=fopen('D:\OneDrive\Documents\MATLAB\interpolation.xlsx','r')
fileid=fopen('D:\OneDrive\Documents\MATLAB\interpolation.txt','w')
VV =[-17.2 -17.1 -13.8 -13.5 -13.0 -12.5 -11 -9 -5.76 -6 -1 0.11 0.25 0.5 0.61]
Vvolt=-17.3:0.1:0.9;
A=interp1(VV,Vvolt)
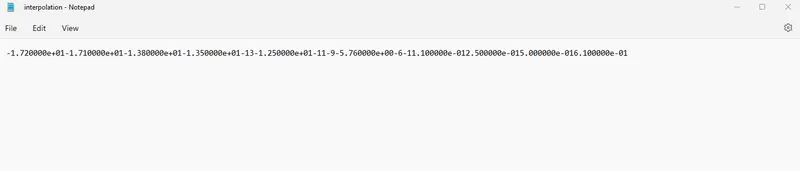
fprintf(fileid,'%d',VV)
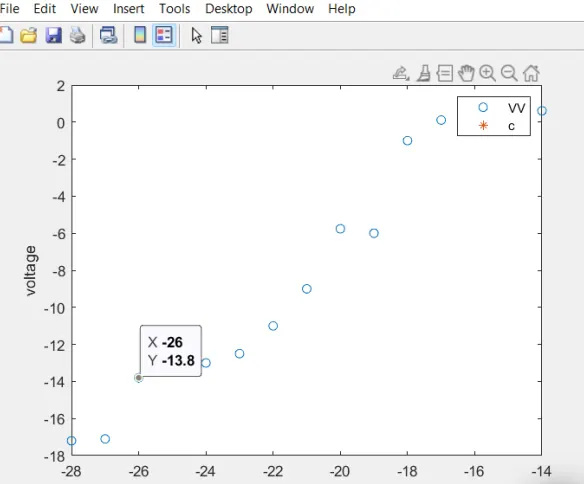
plot((-28:-14),VV,'o',VVolt,A,'*');
xlabel('Voltage');ylabel('current');
output :-
Text file :- output:-
..............................................................................................................................................................................................................
(The End)