Week-4 Challenge WOT Condition Part-2
1) What is the difference between mapped and dynamic model of engine, motor and generator? How can you change model type?
Aim )The main is to explain the difference between mapped and dynamic model of engine, motor and generator
a) Mapped Model Of Engine:-
power train Block provides two types of mapped engines
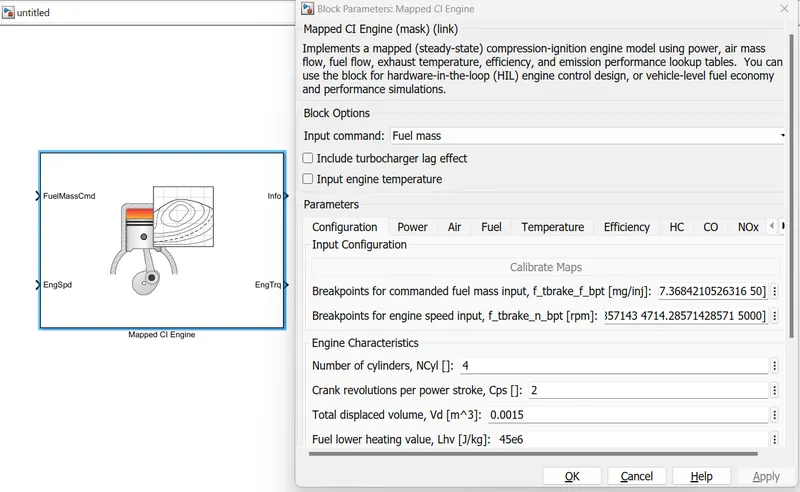
1)Mapped CI engine
Implements a mapped (steady-state) compression-ignition engine model using power, air mass flow, fuel flow, exhaust temperature, efficiency, and emission performance lookup tables.
You can use the block for hardware-in-the-loop (HIL) engine control design, or vehicle-level fuel economy and performance simulations.
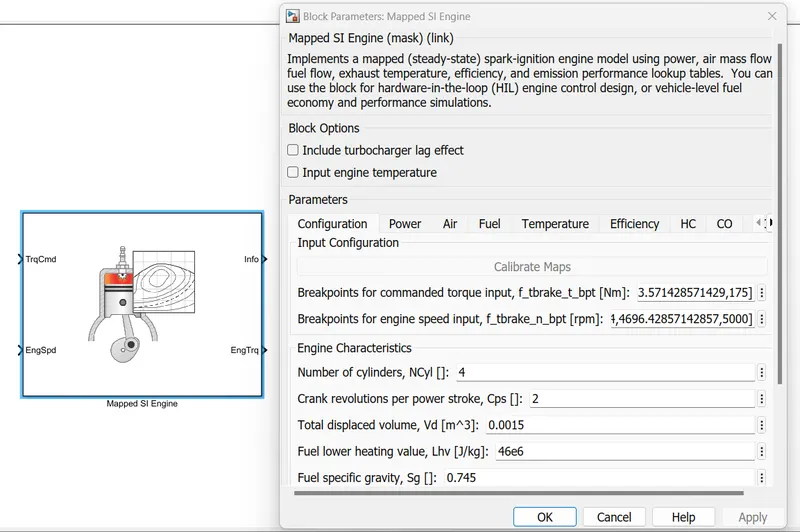
2)Mapped SI engine:-
Implements a mapped (steady-state) spark-ignition engine model using power, air mass flow, fuel flow, exhaust temperature, efficiency, and emission performance lookup tables.
You can use the block for hardware-in-the-loop (HIL) engine control design, or vehicle-level fuel economy and performance simulations.
Conclusion :-
Mapped engines(CI engine or SI engine) represent macro engine behavior as a set of lookup tables (brake torque, fuel flow, air mass flow, exhaust temperature, efficiency, and emissions) as functions of commanded load and measured engine speed.
Usually mapped models are comes with the lookup tables. In this models a set of steady state lookup tables which are used to characterize the engine performance.
This mapped engine block gives an output as per the input which are mentioned in the data set were we put in the lookup table.
This lookup tables provide overall engine characteristics such as actual torque, fuel flow rate, BSFC, and engine-out exhaust emissions
Above picture has the mapped blocks for CI and SI engines in the section on powertrain blockset of simulink library.
This mapped blocks has only used if there is any data set available for the appropriate models.
This Mapped Block Mainly used for for Two basic designs :-
1. Hardware-in-the-loop (HIL) engine control design
2. Vehicle-level fuel economy and performance simulations
b)Dynamic Model Of Engine:-
These are used to decompose the engine behaviour into smaller individual component models that account for engine dynamics, intake airflow and turbo charger dynamics.
They utilize the given data from all the subsystems or components to characterize the performance of engine in real time.Dynamic engines are used when we have component level data.
This block calculates the fuel flow, air mass flow, air fuel ratio, exhaust mass flow rate. They are mainly used to study the impact of individual engine components on the overall performance.
The following figure shows the Dynamic engine model configuration:-
Dynamic Engine Modeling Configuratio
c) Mapped Model Of Moter:-
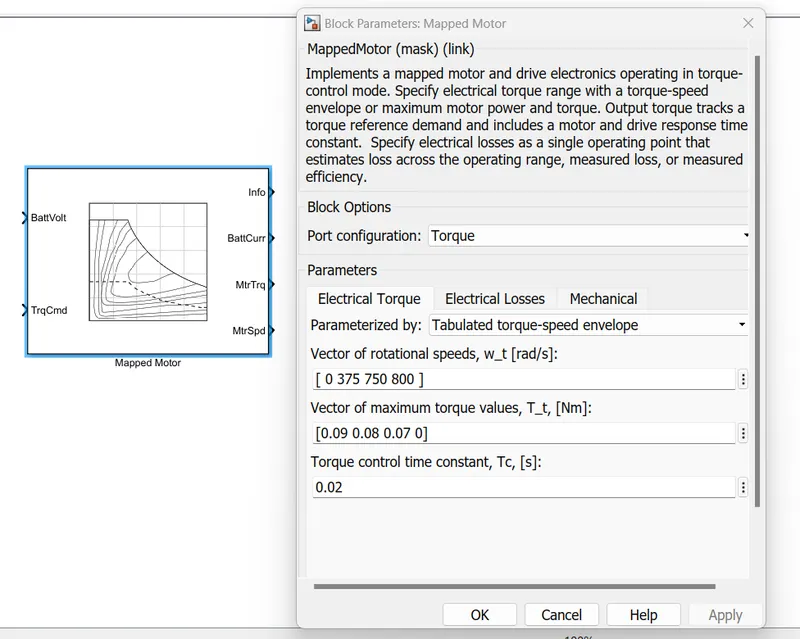
Implements a mapped motor and drive electronics operating in torque-control mode. Specify electrical torque range with a torque-speed envelope or maximum motor power and torque.
Output torque tracks a torque reference demand and includes a motor and drive response time constant. Specify electrical losses as a single operating point that estimates loss across the operating range, measured loss, or measured efficiency.
d)Dynamic Model Of Moter:-
This Dynamic model is used when all the parameters are known. So here the actual specifications of the motor is considered and result is simulated.
This motor uses a torque based field controller for an internal permanent magnet synchronous machine with an optional output loop speed controller.
These are more accurate when compared to the Mapped motors.
The following figure shows the Dynamic model of Moter powertrain system.
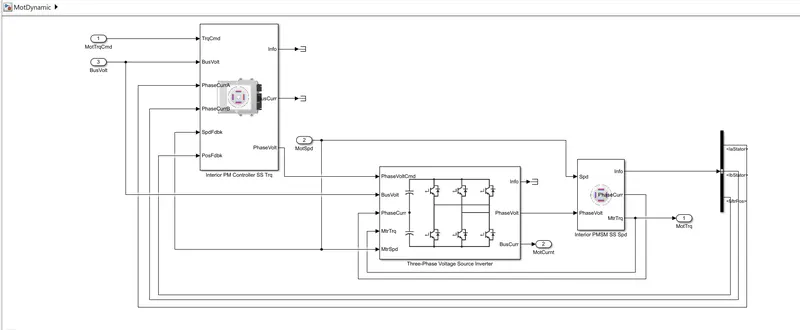
Dynamic model of Moter Powertrain System
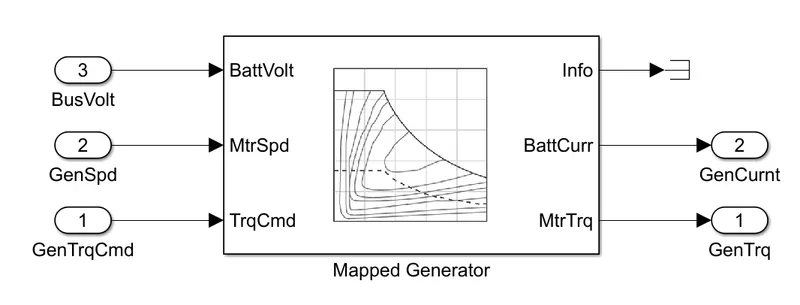
e) Mapped Model Of Generator:-
In this model we have to give the specifications of Battery torque, battery current and others in the lookup table before simulating the result. Results are given on the basis of the data interpreted.
The following figure shows the mapped model of generator:-
e) Dynamic Model Of Generator:-
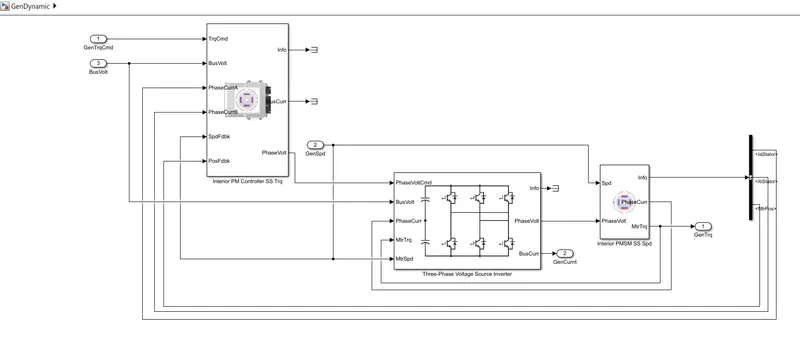
In this Dynamic Model of generator also the actual details are taken into consideration and simulate the result.
It performs real time simulation of components that actually takes place in real system. In model simulation gives detailed analysis.
The following figure shows the dynamic model of the wind turbine generator:-
Dynamic model of Generator Powertrain System
How can you change model type?
Steps to change the model type:-
step 1:- Firstly we have to select the EV reference application model in simulink from the powertrain blockset. from below link
Link :- EV Reference Application - MATLAB & Simulink - MathWorks India
Which is shown in the following figure.
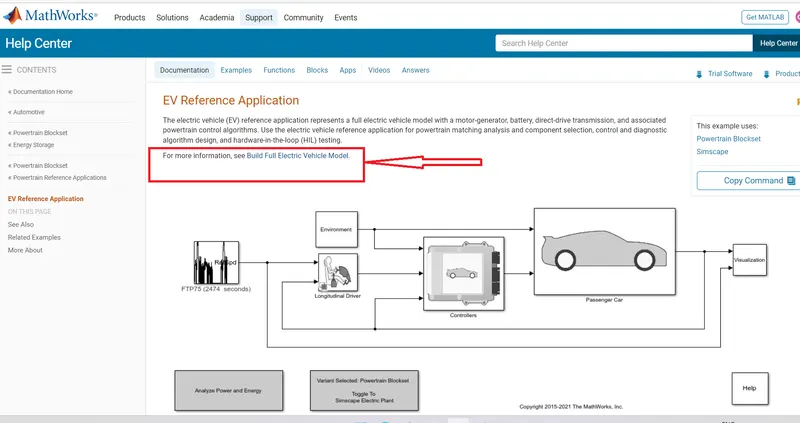
Where click on the Build Full Electric Vehicle Model. then we get this window
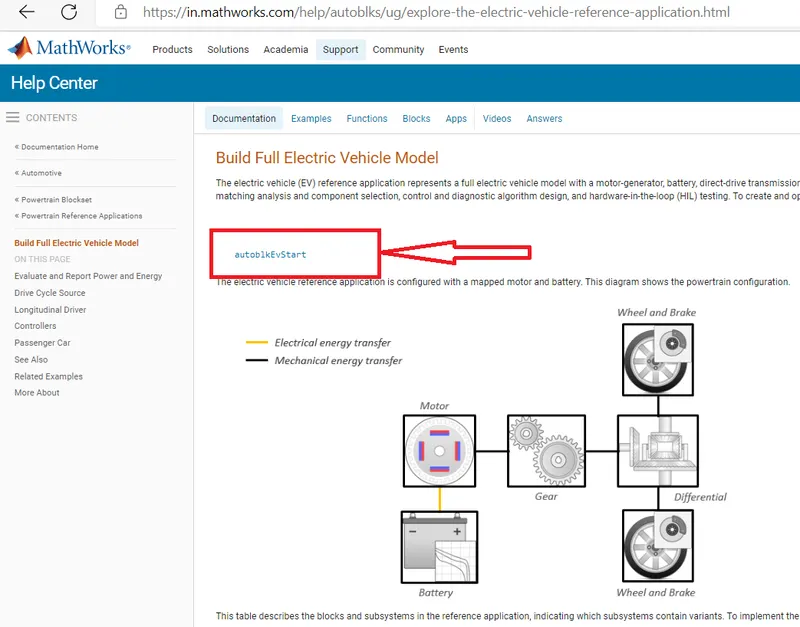
Now click on autoblkEvStart then we directly open the EV design matlab window.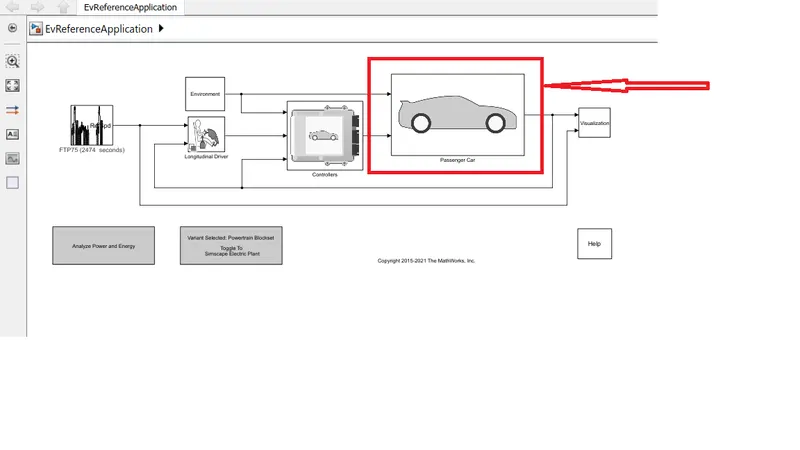
Now Double Click on the passanger Car then we get window like this:-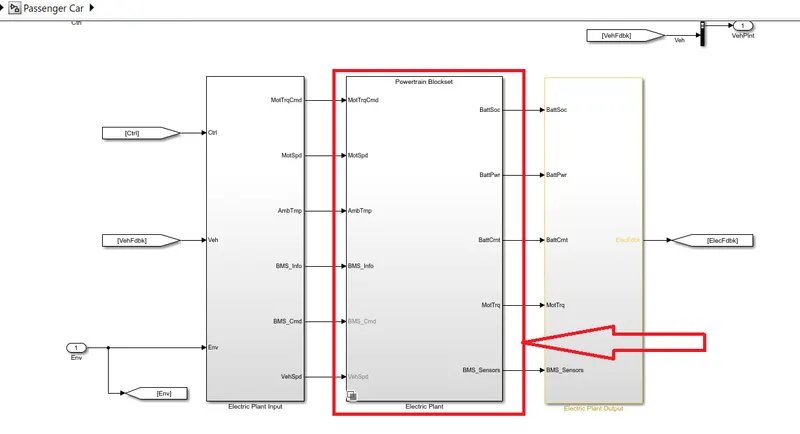
>>After opening the electric plant block a window will appears which consists of Generator and motor model blocks.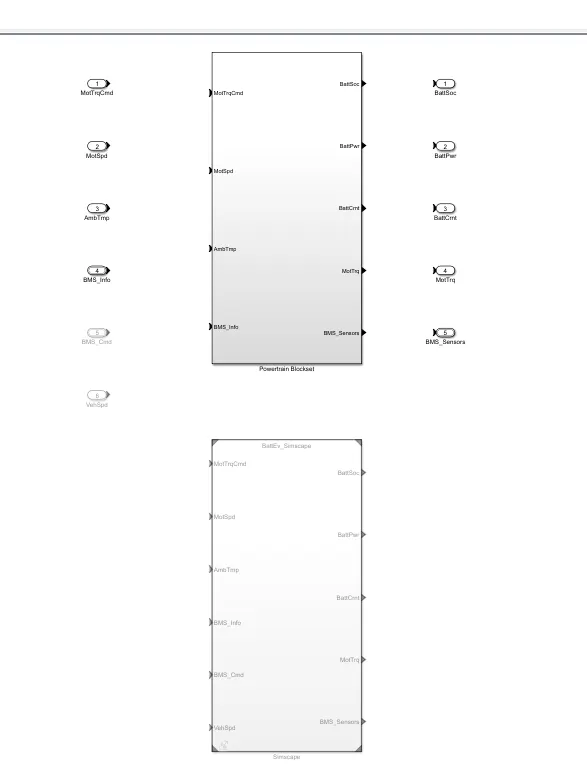
>>From above figure we abserved that the one is Mapped model (WHICH IS DARK IN nature )
>> The other one is Dynamic Model ( Light in nature )
>> That means The highlighted one is what we used run the model in simulation time.
By right clicking on required block to change the model from one to another.
>> After right clicking on that the following options wil appear.
from the choose the variennt option and change model from that
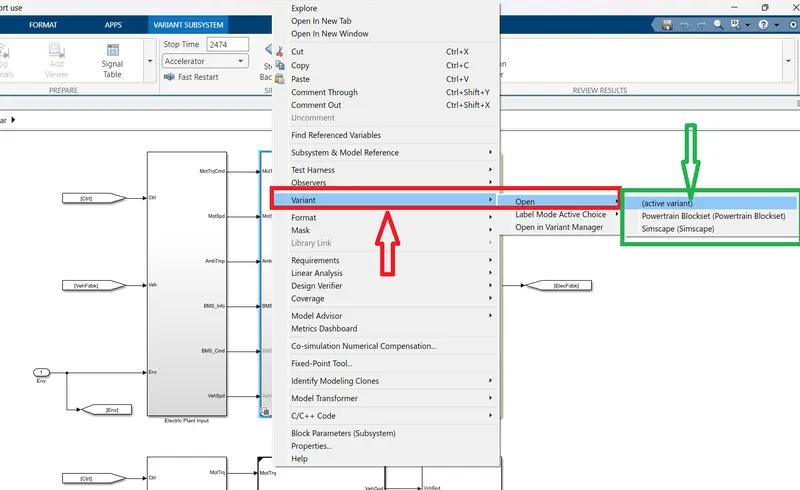
Conclusion :- From this these steps we can the the model from Dynamic model to Mapped model And vice versa.
2) How does the model calculate miles per gallon? Which factors are considered to model fuel flow?
Aim) The main iaim is to explain How the model calculate miles per gallon
Miles per gallon (mpg) are most commonly used in the United States, United Kingdom.
When miles per gallons unit is used, it is necessary to identify the type of gallon used. The amount of fuel energy required to move an engine power car through a distance is determined and then it is compared to the equivalent amount of electrical energy required to move the car through the same distance and it is expressed as the miles per gallon.
The powertrain blockset model calculates the miles per gallon for all kinds of vehicle.
The following diagram shows the figure of HEV reference application block:-
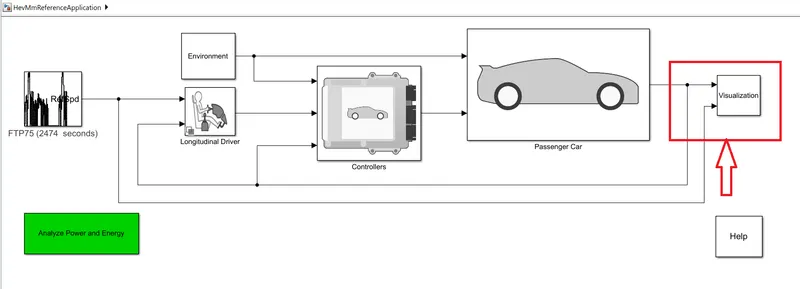
Now click on the block ''Visualization''then we get as followes :-
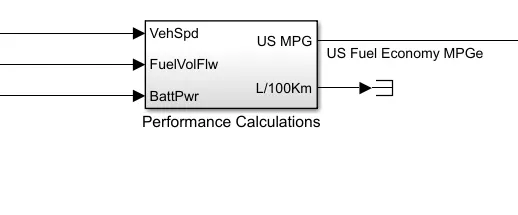
Now double click on the ''Performance Calculation '' block.
After opening the above block we can see the following figure where all the calculation part takes place. Where we can see that Vehicle speed, Fuel consumption flow and Battery are taken as inputs. Where the vehile speed is an important factor while considering the fuel consumption at theat particular time. To convert the speed into distance we can integrate the speed with time and here also same procedure applied i.e. converting the velocity to get the distance by taking the integration block.
Where the battery power is converted to Kw by dividing it by 1000. Battery power is then converted into energy KWH by multiplying it with the time. Then converting it from Kwh to euivaent energy in gallons we are diving it by 33.7. since we get the energy in kwh, to get it as gallons per second i.e. to convert from hour to sec we are dividing by 3600. Then US gallon per secong is multiplied by 0.0037841 to get the volume of fuel flow in m³/g and also get multiplied with 739 (density of gasoline) to get the mass flow rate in kg/s.
Then the fuel is expressed as the mass flow rate that is the amount of fuel is in kg/sec. Now integrating this will results in the mass of fuel, and by dividing the mass with the fuel density we can convert it to the volume. By multiplying with 1000 we can get it in liters. By comparing the results will get to know the amount of consumed fuel to run for 100km.
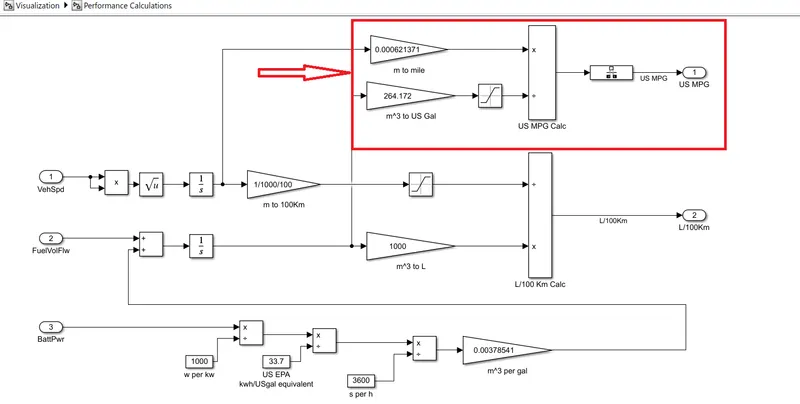
Now coming to major calculation part here
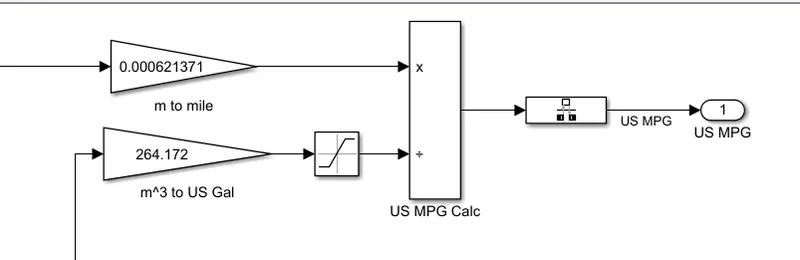
we are taking the inputs from the above calculation. The vehicle distance is taken and it is converted to the miles by multiplying with 0.000621371.
Then the inputs from fuel flow i.e. both Battery energy and Fuel energy which is in m³ are converted into equivalent US gallons by multiplying with 264.172.
Then two inputs Miles covered and equivalent US Gallon are further divided and the final result is achieved in MILES PER GALLON.
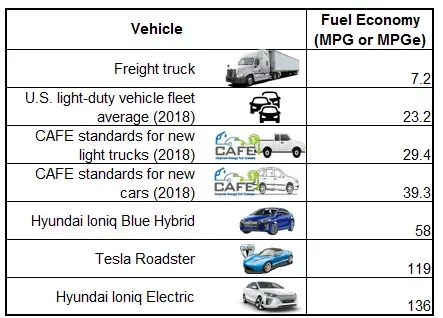
Example chart for different vechicle fuel economy :-
Which factors are considered to model fuel flow?
THE FOLLOWING 3 FACTORS MOSTEY CONSIDERED TO MODEL A FUEL FLOW :-
1)Battery power Capacity should be high and
2) vehicle power consumption should be low for higher MPGe (Miles Per Gallon equivalent).
3)vehicle speed
_________________________________________________________________________________________________________________ 3) Run the HEV ReferenceApplication with WOT drive cycle. Change the grade and wind velocity in the environment block. Comment on the results?
Aim) The main is to run the basic HEV ReferenceApplication with following Two conditions.
Condition (1) Drive cycle :- WOT drive cycle by
Condition (2) Changing the Grade and Velocity
Hybrid Electric Vehicle(HEV):- It is a type of Hybrid vehicle that combines a conventional Internal combustion Engine (ICE) system with an electric propulsion system.
The presence of the electric powertrain is intended to achieve either better fuel economy than a conventional vehicle or better performance. There is a variety of HEV types and the degree to which each function as an electric vehicle also varies.
The most common form of HEV is the hybrid electric car, although hybrid electric trucks, buses, boats and aircraft also exist. Modern HEVs make use of efficiency improving technologies such as regenerative brakes which convert the vehicles kinetic energy to electric energy, which is stored in a battery or supercapacitor.
Some varieties of HEV use an internal combution engine to turn on electrical generator, which either recharges the vehicles batteries or directly power its electric drive motors, this combination is known as a motor-generator.
Many HEVs reduce idle emissions by shutting down the engine at idle and restarting it when needed, this is known as a start-stop system. If the engine is not used to drive the car directly, it can be geared to run at maximum efficiency, further improving fuel economy.
To check the WOT drive cycle for Reference HEV application by using following steps :-
step 1 :- from the following link we can get the Reference HEV application
Link :-Build Hybrid Electric Vehicle Multimode Model - MATLAB & Simulink - MathWorks India
From this link we can get the model of Reeference HEV model :-
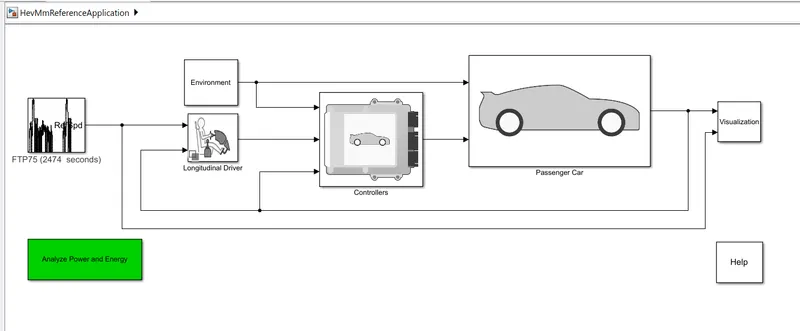
Condition (1) Drive cycle :- WOT drive cycle
Fro this condition we are change the basic drive cycle (FTP75 ) to required Drive cycle(WOT drive cycle)
The Basic HEV model contains a DRIVE CYCLE as :- FTP75
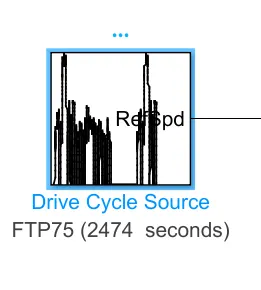
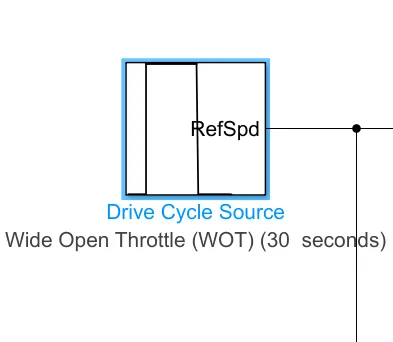
Step 2:- From this Drive cycle source Block we have to change the Drive Cycle as required WOT drive Cycle :
we can select the Drive cycle by scrowl down th option of DRIVE CYCLE SOURCE as followe
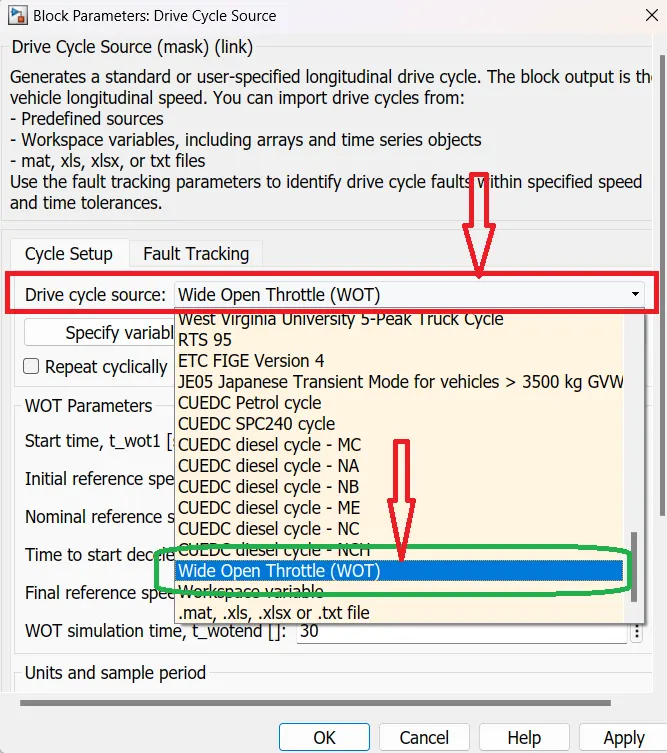
Then The basic drive cycle source changes to WOT drive cycle .
Condition (2) Changing the Grade and Velocity
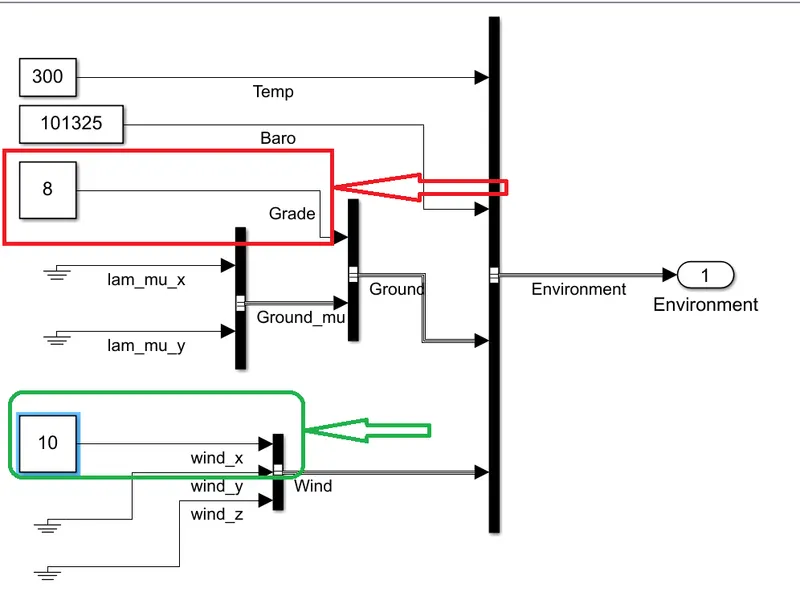
for this condition we are using the environment block :-
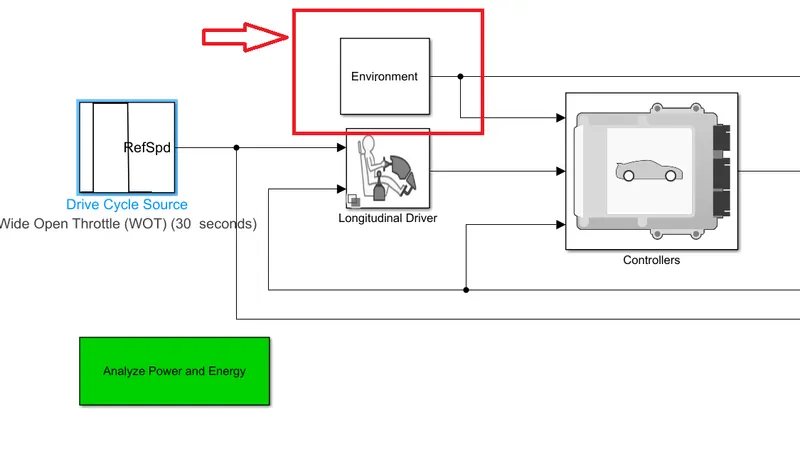
After double click on the environment block we get the Subsystem window as followes :-
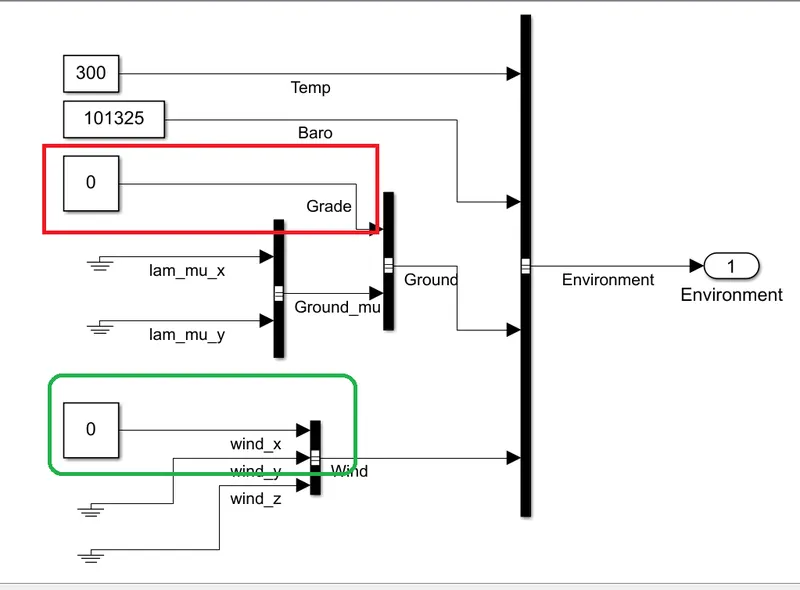
From above diagram the red box is for grade value and the green box is for velocity value.
Now we are checking the WOT drive cycle with 2 cases of Grade and Velocity values.
Case 1) NOW we are using
a) grade angle value to 0°
b) wind velocity to 0 m/s.
Then the plot results are as shown in the following figure:-
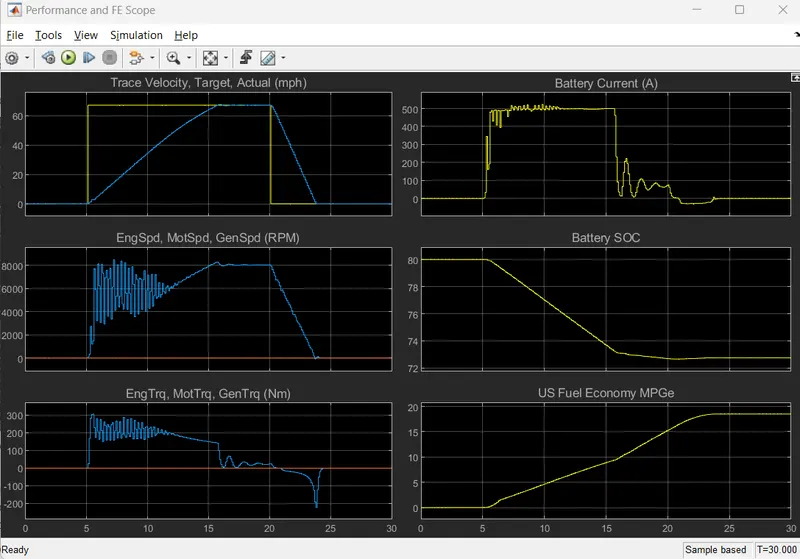
From the above graph :-
LEFT SIDE :-
PLOT 1: Trace velocity , Target actual(mph)
This plot shows the velocity of the vehicle with respect to the driving cycle.
The time value is taken on X axis. The accelaration time to reach 67.1 mph is 15.6sec
PLOT 2: Engine speed, Motor speed, Generator speed
This plot shows the changes in speed of engine, motor and generator in terms of RPM through out the driving cycle.
The supply power from the battery is observed and distributed by control system that power is generated to motor.
Here the peak engine and generator speed is 5437, generator speed is 13872RPM.
PLOT 3:- Engine torque, Motor torque, Generator torque
This plot shows the torque characterstics and its change in Engine, Motor and generator.
The raise of velocity in vehicle at intial stage is driven by the supply of torque.
The peak engine torque is 174Nm and Motor is 302Nm. Generator has no torque.
RIGHT SIDE:-
PLOT 1: Battery Current (A)
This plot shows the Battery current values in amperes and its change for various accelaration inputs as per the given drive cycle.
Peak current discharge from battery s 503 A and peak current charge the battery is 202 A.
PLOT 2: Battery SOC
This plot shows the Battery State Of charge(SOC) in % and its changes corresponding to the given inputs.
The SOC is decreased from 80% to 73 % of charge in10.39 sec.
The SOC refers to the recharging condition of battery during the decelaration process.
PLOT 3: US Fuel economy MPGs
This plot shows the Fuel economy in US miles per Gallons.
This calculates the milage of vehicle during the accelaration of vehicle.
The maximum miles that car can run per Gallon of fuel is 23.687 mpg.
Case 2) NOW we are using
a) grade angle value to 8°
b) wind velocity to 10 m/s.
Then the plot results are as shown in the following figure:-
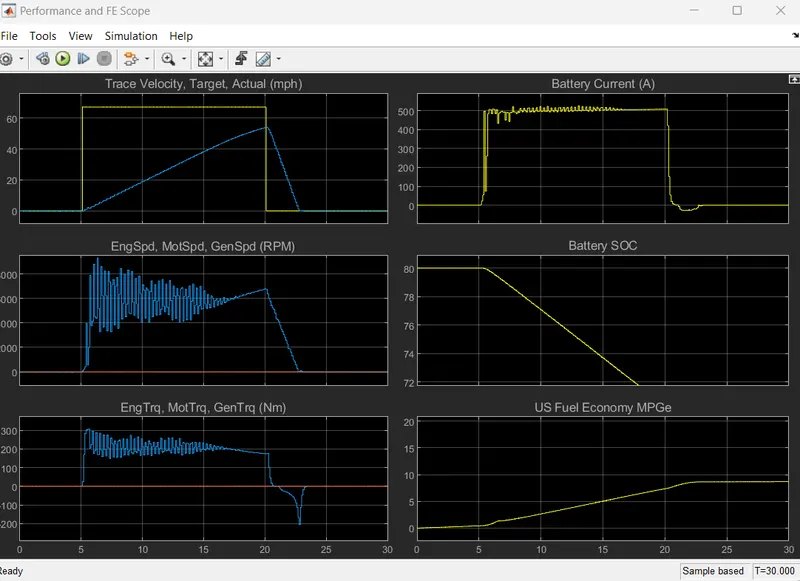
Left Side :-
PLOT 1: Trace velocity, Target Actual (mph)
This plot shows the velocity of the vehicle with respect to the driving cycle.
The top speed can not be achieved as we have some additional forces acting and so car can only run upto 67.1 mph.
The accelaration time to reach this value is 14.95sec and from here decelarate it takes 3.025 sec.
PLOT 2: Engine speed, Motor speed, Generator speed
This plot shows the changes in speed of engine, motor and generator in terms of RPM through out the driving cycle.
Here the peak engine and generator speed is 423RPm, generator speed is 7863 RPM. Due to change in the gradeability these values are different from the default one.
PLOT 3: Engine torque, Motor torque, Generator torque
This plot shows the torque characterstics and its change in Engine, Motor and generator.
The peak engine torque is 280 Nm and Motor is 198Nm. Generator has no torque.
The torque values are raised due to presence of wind velocity.
Right side :-
PLOT 1: Battery SOC
This plot shows the Battery State Of charge(SOC) in % and its changes corresponding to the given inputs.
The SOC is decreased from 80% to 70 % of charge in 14.595 sec.
SOC is not acting at the same point when the slope portion is obtained and torque will reduced.
PLOT 2: Battery Current (A)
This plot shows the Battery current values in amperes and its change for various accelaration inputs as per the given drive cycle.
Peak current discharge from battery s 506A and peak current charge the battery is --3.65.4A.
Battery supply is also high. Sometimes generator is acting as recharge system.
PLOT 3: US Fue economy MPGs
This plot shows the Fuel economy in US miles per Gallons.
The maximum miles that car can run per Gallon of fuel is 17.12 mpg. Fuel economy is high due to wing and grade angle.
CONCLUSION:-
The top speed reached by the vehicle is less in case 2 compared to case 1 due to presnce of grade angle and wind force.
The SOC is also shows that the discharge is high compared to default model. Fuel economy is also down in case2.
So we can say that the efficiency of no load vehicle is high compared to the vehicle with additional loads and force acting on them.
_________________________________________________________________________________________________________________ 4)Keeping all other parameters same, compare the simulated results of hybrid and pure electric powertrains.
Aim) The main is comparision bwtween both Hybrid and Pure Electrical powertrains
Hybrid Electric Vehicle(HEV):-
It is a type of Hybrid vehicle that combines a conventional Internal combustion Engine (ICE) system with an electric propulsion system.
The presence of the electric powertrain is intended to achieve either better fuel economy than a conventional vehicle or better performance. There is a variety of HEV types and the degree to which each function as an electric vehicle also varies.
The most common form of HEV is the hybrid electric car, although hybrid electric trucks, buses, boats and aircraft also exist. Modern HEVs make use of efficiency improving technologies such as regenerative brakes which convert the vehicles kinetic energy to electric energy, which is stored in a battery or supercapacitor.
Some varieties of HEV use an internal combution engine to turn on electrical generator, which either recharges the vehicles batteries or directly power its electric drive motors, this combination is known as a motor-generator.
Many HEVs reduce idle emissions by shutting down the engine at idle and restarting it when needed, this is known as a start-stop system. If the engine is not used to drive the car directly, it can be geared to run at maximum efficiency, further improving fuel economy.
To check the WOT drive cycle for Reference HEV application by using following steps :-
step 1 :- from the following link we can get the Reference HEV application
Link :-Build Hybrid Electric Vehicle Multimode Model - MATLAB & Simulink - MathWorks India
From this link we can get the model of Reeference HEV model :-
Condition (1) Drive cycle :- WOT drive cycle
Fro this condition we are change the basic drive cycle (FTP75 ) to required Drive cycle(WOT drive cycle)
The Basic HEV model contains a DRIVE CYCLE as :- FTP75
Step 2:- From this Drive cycle source Block we have to change the Drive Cycle as required WOT drive Cycle :
we can select the Drive cycle by scrowl down th option of DRIVE CYCLE SOURCE as followe
Then The basic drive cycle source changes to WOT drive cycle .
Condition (2) Changing the Grade and Velocity
for this condition we are using the environment block :-
After double click on the environment block we get the Subsystem window as followes :-
From above diagram the red box is for grade value and the green box is for velocity value.
Then the plot results are as shown in the following figure:-
From the above graph :-
LEFT SIDE :-
PLOT 1: Trace velocity , Target actual(mph)
This plot shows the velocity of the vehicle with respect to the driving cycle.
The time value is taken on X axis. The accelaration time to reach 67.1 mph is 15.6sec
PLOT 2: Engine speed, Motor speed, Generator speed
This plot shows the changes in speed of engine, motor and generator in terms of RPM through out the driving cycle.
The supply power from the battery is observed and distributed by control system that power is generated to motor.
Here the peak engine and generator speed is 5437, generator speed is 13872RPM.
PLOT 3:- Engine torque, Motor torque, Generator torque
This plot shows the torque characterstics and its change in Engine, Motor and generator.
The raise of velocity in vehicle at intial stage is driven by the supply of torque.
The peak engine torque is 174Nm and Motor is 302Nm. Generator has no torque.
RIGHT SIDE:-
PLOT 1: Battery SOC
This plot shows the Battery State Of charge(SOC) in % and its changes corresponding to the given inputs.
The SOC is decreased from 80% to 73 % of charge in10.39 sec.
The SOC refers to the recharging condition of battery during the decelaration process.
PLOT 2: Battery Current (A)
This plot shows the Battery current values in amperes and its change for various accelaration inputs as per the given drive cycle.
Peak current discharge from battery s 503 A and peak current charge the battery is 202 A.
PLOT 3: US Fuel economy MPGs
This plot shows the Fuel economy in US miles per Gallons.
This calculates the milage of vehicle during the accelaration of vehicle.
The maximum miles that car can run per Gallon of fuel is 23.687 mpg.
Pure Elctrical Vechicle :-
An electric car or battery electric car is an automobile that is propelled by one more electric motors, using only energy stored in batteries. Compared to the Internal combution engine (ICE) vehicles, electric cars are quiter, have no exhaust emissions
In the US and European Uninion, as of 2020, the total cost of ownership of recent electric vehicles is cheaper than the equivalent ICE cars, due to lower fuelling and maintainance costs.
Charging an electric car can be done at a variety of charging stations. These charging stations can be installed in both houses and public areas.
To check the WOT drive cycle for Reference HEV application by using following steps :-
step 1 :- from the following link we can get the Reference HEV application
Link :- Build Full Electric Vehicle Model - MATLAB & Simulink - MathWorks India
From this link we can get the model of Reeference HEV model :-
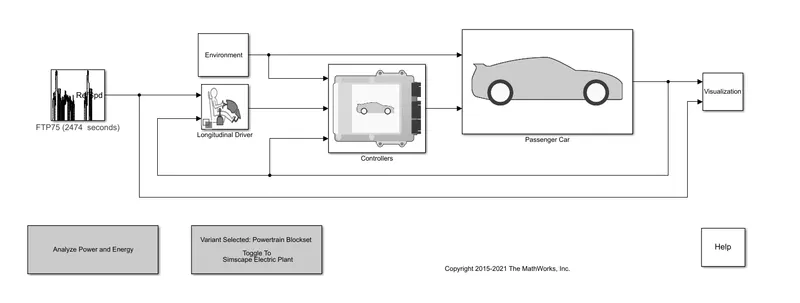
We are change the basic drive cycle (FTP75 ) to required Drive cycle(WOT drive cycle)
The Basic HEV model contains a DRIVE CYCLE as :- FTP75
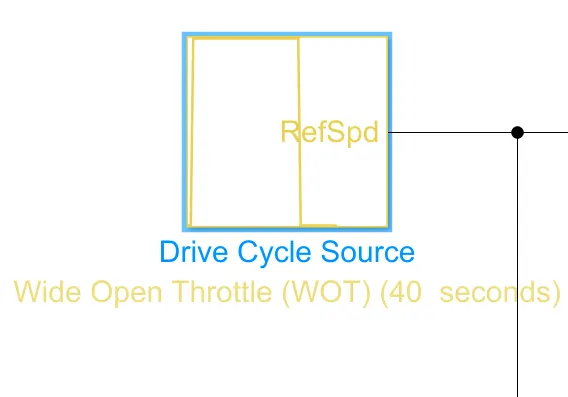
Step 2:- From this Drive cycle source Block we have to change the Drive Cycle as required WOT drive Cycle :
we can select the Drive cycle by scrowl down th option of DRIVE CYCLE SOURCE as followe
Then The basic drive cycle source changes to WOT drive cycle :-
Now are run the PURe electrical model for Wot condition with all parameters same :-
Then the results are as followes :-
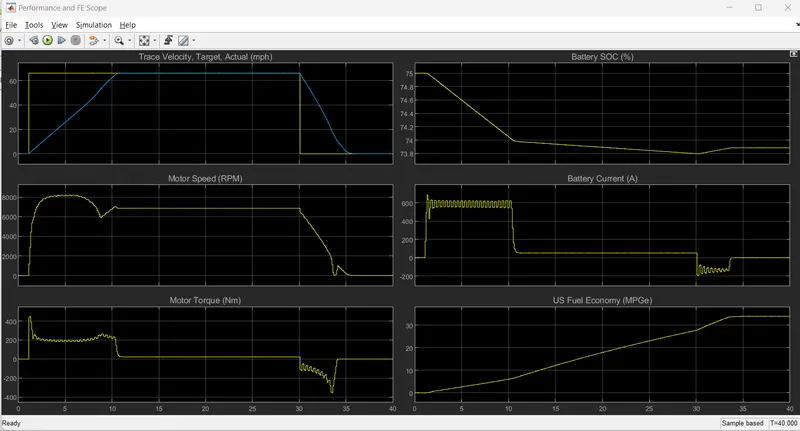
Same like the previous model here also showing 6 plots (Left side -3 and right side 3 plots )of different parameters.
Left Side :-
PLOT 1: Trace velocity, Target Actual (mph)
This plot shows the velocity of the vehicle for the drive cycle data with the Time on X axis.
The top speed is obtained here at 65.9 mph. The acceleration time to reach 65.9 mph is 9.03 sec.
And the decelaration time from this point to minimum point is 10.51sec.
PLOT 2: Engine speed, Motor speed, Generator speed
This plot shows the speed variations of Engine, Motor and Generator throughout the drive cycle.
In this model the maximum speed is 1780.6RPM.
PLOT 3: Engine torque, Motor torque, Generator torque
The plot shows the Torque values of Engine, Motor and Generator with respect to the given inputs.
Maximum Motor toque is acieved at 208.720 Nm.
Right Side :-
PLOT 1: Battery SOC
This plot shows the SOC values in terms of %.
The SOC decreased from 75 %to 74.% of charge in 8.61 sec for the specified driving conditions.
PLOT 2: Battery Current (A)
This plot shows the Battery current values in amperes and its variations corresponding to the accelaration inputs.
The peak current discharge from battery is 98.6 A and the peak current charging the battery is -91.2A.
PLOT 3: US Fue economy MPGs
The plot shows the Fuel economy as Miles per Gallons for the inputs through the driving cycle.
The highest Miles per Gallon is 55.41 mpg.
CONCLUSION:-
Here we are comparing the default models of the both models i.e. HEV and EV.
The Electric vehicle when compared to HEV with same environmental drive cyclle conditions results in less top speed achievement.
As the pure electric car here uses Lithium-ion battery compared to the Nickel metal hydride battery, the discharging capacity and the rate of charging is higher in pure electric car.
The HEV allows the battery to compensate the required power by the vehicle and generator helps charge the battery at faster rate which allows to travel the vehicle over long distances.
The SOCshows the battery efficiency of the pure EV is higher than the HEV. Electric vehicle produces 0 emissions whereas HEV produces waste gas emission.
-------------------------------------------------------------------------------------------------------------------------------------------------------------------------------------------------------------------------------------------------------------------------------------------------------------------------------------------------------------------------------------------(The End)-----------------------------------------------------------------------------------