Project 1
Monitoring the vital patient parameters by ”near-patient” testing, usually outside the critical care facility like hospital or primary care facility like home etc, is referred to as point of-care monitoring (POC monitoring). The point- of-care patient monitoring is usually performed by the doctor visiting the patient and conducting check-up. Usually, parameters like
heart rate, pulse rate, blood oxygen saturation level, body temperature, blood pressure etc. are checked by the doctor.
Since these parameters give the doctor a fair idea about the patient’s condition, these parameters are called vital parameters. However, if these parameters are transmitted directly to the doctor’s location, it saves time and imparts comfort to both the doctor and the patient. Remote patient monitoring (RPM) systems work in off- line mode and record patient data, which is then read by the hospital at regular intervals, an example is the diabetes monitoring, considered to be vital
parameters for a patient monitoring system.
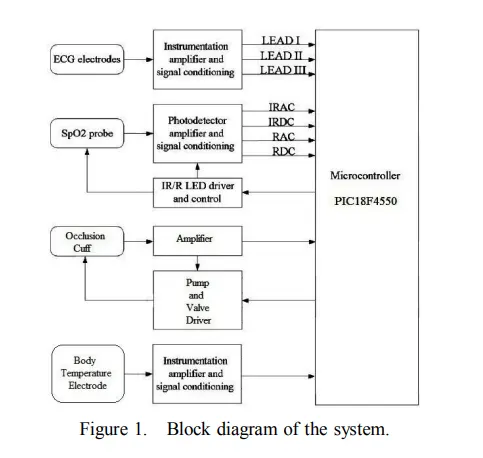
Tele-monitoring applications have been classified by Korhonen et al.in two groups. The first group is the wellness and disease management model where clinical personnel plays a supportive role in monitoring patient, and the independent living and remote monitoring model, where the medical personnel monitors health status. Remote monitoring devices fitting in the second model, allowing patient’s mobility could be classified into three categories. The dataloggers, which measure and store data between downloads, the data-forwarding systems, which measure and transmit data and the data-processing systems, which measure, analyze and transmit data analysis. Data-loggers have the obvious disadvantage that they cannot communicate parameters and a change in health status between downloads. Data-forwarding devices are the obvious choice, when continuous monitoring is required. Forwarding devices are lacking processing power of data processing devices, but due to their simplicity it is relative easy to be designed and implemented with low cost furthermore the processing algorithms could be upgraded or adapted to patient needs, without directly interfacing the device. Fig.1. shows the block diagram of the system. The system
consists of the pulse oximeter probe, the ECG surface electrodes and the blood pressure measuring occlusion cuff and their respective signal conditioning and amplification circuits. The analog signals are fed to the PIC18F series microcontroller which converts them to digital signals.
II. DESIGN CONSIDERATIONS
A few parameters like ECG, SpO2 , heart rate, body temperature and blood pressure, which are the important vital parameters, are selected for designing the patient monitoring system.
1) Blood Oxygen Saturation Level (SpO2): A pulse oximeter is a portable, non-invasive monitoring of oxygen saturation which can quickly detect hypoxemia. Pulse oximetry basically measures oxygen saturation (SpO2) i.e. the percentage of haemoglobin saturated with oxygen.
2) Electrocardiogram (ECG) and Heart Rate: ECG is the recording of the electrical activity of the human heart. ECG can be used to detect various cardiac abnormalities including some forms of arrhythmia, high and low heart rates and cardiac damage.
3) Heart Rate: Heart rate is number of times the heart beats per minute. The heart rate is typically expressed as beats per minute (bpm). The heart rate can vary according to the body’s physical activities. Activities like physical exercise, sleep, anxiety, stress, illness, ingesting, and drugs can affect the heart rate. The normal human heart rate ranges from 60 to 100 bpm. When the heart rate falls below 60bpm, the condition is called Bradycardia. When the heart rate rises above 100bpm, the condition is called Tachycardia. When the heart is not beating in a regular pattern, this is referred to as an arrhythmia. These
abnormalities of heart rate sometimes, but not always, indicate disease.
4) Body Temperature: Rise of fall in body temperature is one of the foremost indication of many diseases and disorders. A temperature sensor is integrated with the system to measure the changes in body temperature of the patient.
5) Blood Pressure: Blood Pressure (BP) is the pressure exerted by circulating blood upon the walls of blood vessels, and is one of the principle vital signs. During each heartbeat, blood pressure varies between a maximum (systolic) and a minimum (diastolic) pressure. The blood pressure in the circulation is principally due to the pumping action of the heart. The normal human blood pressure varies between 120(higher value) to 80(lower value). Blood pressure above and below these values indicate abnormalities like hypertension, hypotension etc.
A. PCB Design Considerations
Bio-signals are very critical in nature and are easily affected by environmental and physical conditions. Special attention is given in the manufacturing of the printed circuit boards (PCB’s). Several ground planes have been defined and routing strictly enforced to avoid any noise coupling between the analog and digital sections. Separate areas are provided for digital and analog sections.
B. Reconfiguration of Hardware and Software
The hardware and software design of the system has to allow the addition or removal of various sensors with varying levels of input. The scaling, offset and gain aspects of the sensor input channels should be configurable in software. The sensors are connected to the circuit through miniature connectors.
C. Accurate and Noise/Interference Free System Design
Accuracy is an important consideration for the design of the system. The ECG electrodes and pulse oximetry sensor are very sensitive to noise. Thus a good noise isolation and filtering system is designed for their signal conditioning. The analog sections of the system are completely isolated from the digital sections in order to reduce the coupling of noise induced by clocks in the digital circuits. The analog circuitry is totally isolated from the supply. Isolation techniques need to be used throughout the board. Separate grounds are provided for analog and digital sections.
III. SYSTEM DESIGN AND DEVELOPMENT
A. Patient Monitoring Module Design.
1) Blood Oxygen Saturation Level (SpO2 ): The Nellcor DS100 finger probe is used as sensor. It consists of two narrow band LEDs as sources of light. One is red LED of 660nm wavelength and other one is an infrared LED of 940nm wavelength, placed on one side and a photo detector placed on opposite side of the probe. The output of the photo-detector is given to the signal conditioning and amplification circuitry.
Fig.2. shows the block diagram of the signal conditioning and amplification circuitry.
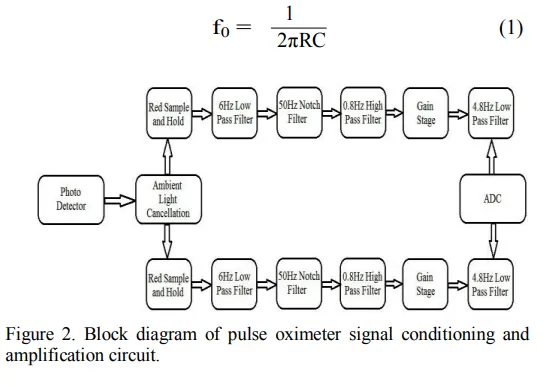
The first filter is a low pass filter with a cut-off frequency (f0) of 6Hz designed to eliminate high frequency noise. The filter cut frequency of 6Hz is calculated using (1), by selecting the appropriate values of resistor and capacitor. The second filter is a 50Hz notch filter. The purpose of this filter is to eliminate the 50Hz power-line interference. The notch filter is designed as a passive filter in the twin- T
configuration. The notch filter is referenced to Vcc/2 to add an offset voltage. The third filter is a 0.8Hz high pass filter. The desired cut-off frequency is calculated using (1).

This filter separates the DC component of the signal. Thefourth filter is a first order active 6Hz low pass filter that also provides a gain of 31. The cut-off frequency of this filter is set by calculating the value of components using (1). The values of components are calculated using (2) to set the desired gain of 31. The fifth and last one is a 4.8Hz low pass filter. The cut-off frequency of this filter is also calculated using (1). The last stage is an active amplifier with variable gain to adjust the amplitude of the derived photoplethysmogram. The values of components are calculated using (2). The result at this point is a noise-free photoplethysmogram. This photoplethysmogram is further fed to the microcontroller for the calculation of SpO2..
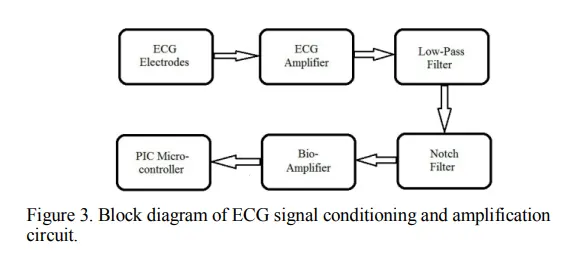
2) Electrocardiogram (ECG) and Heart Rate: Fig.3. shows the block diagram of ECG signal conditioning and amplification circuitry. The Electrocardiogram (ECG) is sensed by the clamp type sensors. The signal achieved from clamp type sensor is very low(in micro-volt). The maximum differential signal from the sensor at R wave is up to 1.2mV. Hence the signal should be applied to the instrumentation amplifier for the faithful amplification and S/N level improvement. The suitable gain of the amplifier is decided by the resistance used in the circuit. The amplified signal is applied to low pass filter for the faithful nature of ECG signal.The cutoff frequency of the low pass filter is decided to be 150Hz to pass the element of all ECG signal. The signal is then applied to notch filter to filter the noise of line frequency 50Hz. One more stage of bio-amplifier is inserted and finally signal is applied to the comparator for the detection of R wave. This signal is applied to the comparator to detect the R pulses. After detection of the R pulses the signal is applied to mono- stable multi-vibrator. The output of mono-stable multi-vibrator is the sharp spike having very low on time with respect to the offtime. The ECG pulses are regularly generated. The duration
between two conjugative pulses is inversely proportional to the heart rate. If the duration is long the heart rate will be low. And if the duration is short then the heart rate will be very high. The normal heart rate is varying from 70-120 bpm. The microcontroller counts the heart rate from the number of Rwave peaks.
3) Body Temperature: The temperature measurement circuit consists of the following parts:
• Temperature sensor
• Bridge circuit
• Differential amplifier
For temperature measurement, the thermistor based biosensor is used. Thermistor based temperature sensors arewidely used for body temperature measurements. The thermistor, which is a temperature sensor, is connected in one arm of the Wheatstone’s bridge and resistors of rest of the arms are selected such that at zero degree Celcius the bridge is balanced and 0V appear at the output of the bridge circuit. The resistance of the sensor changes with respect to temperature, i.e. as the temperature increases, the resistance of the sensor increases and vice-versa. Now depending on the application of temperature the resistance of thermistor changes proportionally which gives further changes in the output voltage of the bridge circuit At zero degree Celcius the bridge will be in balanced condition but as the temperature of thermistor changes due to application of some temperature input, then the bridge circuit becomes unbalanced. This unbalance results in small voltage across the bridge output. This small voltage is fed to the differential amplifier for the amplification purpose. The amplified voltage is further fed to the microcontroller which calculates the body temperature.
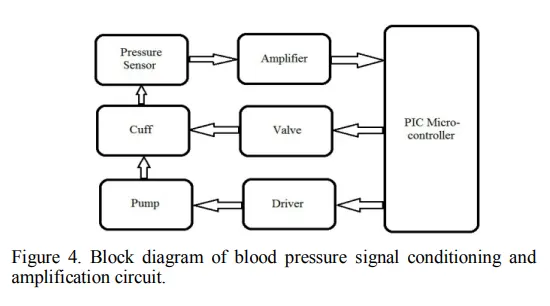
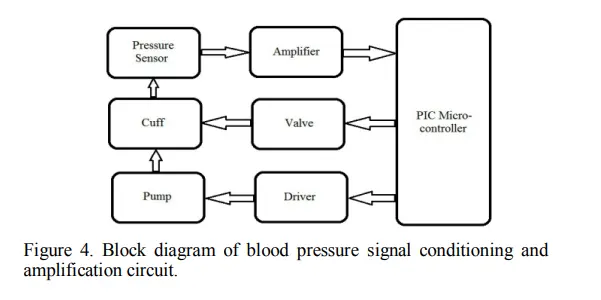
4) Blood Pressure: Fig.4. shows the block diagram of blood pressure measurement. The occlusion cuff is used as the sensor. It is placed on the left arm of the subject. The air-pump fills air in the cuff till the artery is occluded. Then the air in the cuff is released till blood flows back in the artery. The pressure sensor calculates the systolic and diastolic pressures and gives the data to microcontroller. The microcontroller converts the data into digital values of high and low blood pressures.
5) Microcontroller: The PIC18F4550 Microcontroller includes 32kb of internal program memory, 2048 bytes of RAM area and an internal EEPROM of 256 bytes. A 13- channel,10- bit A/D converter is included within the microcontroller, making it ideal for real-time systems and monitoring applications. The ports of the micro- controller are brought-out into standard connectors, which makes connection of external components to the pins of the microcontroller easy.The programming pins of the micro- controller are also brought-out such that the programmer can be easily connected. This enables the microcontroller program to be easily updated and modified as required, without the need to remove the microcontroller.
B. Wireless Communication and PC Front-End Module
The Global System for Mobile Communication(GSM) module is selected for wireless communication. GSM MODEM provides full functional capability to serial devices to send SMS and data over GSM Network. The GSM MODEM is available in 300/900/1800MHz frequency bands. It requires less than 3.5mA current during the idle mode. The GSM MODEM supports popular ”Attention (AT)” command set.
Some of the common AT commands are:
• AT-Attention Command. Alerts GSM module for communication.
• ATZ-Reset Command. Resets the GSM module.
• AT+CMGF-Sets SMS input mode as text mode.
• AT+CNMI-Sets the SMS indicator format.
• AT+CMGS-Sends text message.
• AT+CMGR-Receives text message.
The GSM receiver module is connected to thepersonal computer, which provides the wireless communication to the patient monitoring module and a front-end application developed with Microsoft Visual Studio technology. The Visual Studio application receives quasi-real time data, transmitted by the patient monitoring module and presents data’s numerical values (HR, SpO2 , body temperature and NIBP) and as physiological parameters numerical trends. The basic signal processing, such as signal filtering, HR and SpO2 calculation is performed on the patient monitoring device.
C. Central Monitoring Module
The data from the patients is transmitted to a healthcare facility using the wireless technology. It is a Windows based program which runs on a PC. This program was written using Microsoft Visual Studio for the .net framework. It uses the RS-232 protocol for communication with the receiver unit. The data is read from the hyper-terminal of the PC and displayed in the personal computer’s front-end window.
Patient Monitoring in Intensive-Care Units
There are at least five categories of patients who need physiological monitoring:
1. Patients with unstable physiological regulatory systems; for example, a patient whose respiratory system is suppressed by a drug overdose or anesthesia
2. Patients with a suspected life-threatening condition; for example, a patient who has findings indicating an acute myocardial infarction (heart attack)
3. Patients at high risk of developing a life-threatening condition; for example, patients immediately after open-heart surgery or a premature infant whose heart and lungs are not fully developed
4. Patients in a critical physiological state; for example, patients with multiple trauma or septic shock.
5. Mother and baby during the labor and delivery process
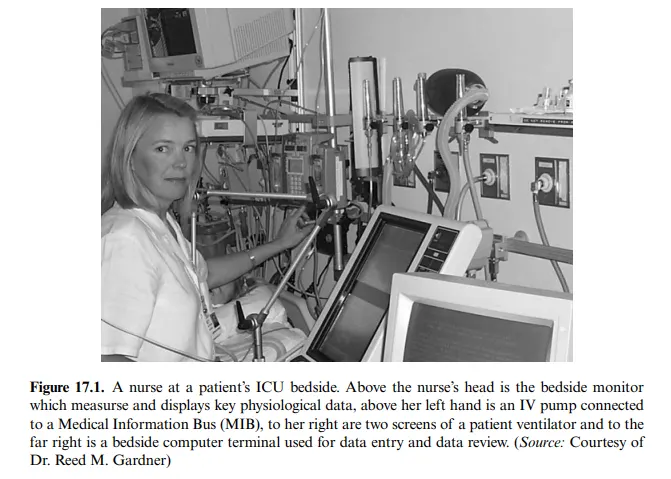
Care of the critically ill patient requires prompt and accurate decisions so that life protecting and life-saving therapy can be appropriately applied. Because of these requirements, ICUs have become widely established in hospitals. Such units use computers almost universally for the following purposes:
● To acquire physiological data frequently or continuously, such as blood pressure readings
● To communicate information from data-producing systems to remote locations (e.g.,laboratory and radiology departments)
● To store, organize, and report data
● To integrate and correlate data from multiple sources
● To provide clinical alerts and advisories based on multiple sources of data
● To function as a decision-making tool that health professionals may use in planning the care of critically ill patients
● To measure the severity of illness for patient classification purposes
● To analyze the outcomes of ICU care in terms of clinical effectiveness and cost effectiveness
Data Acquisition and Signal Processing
The use of microcomputers in bedside monitors has revolutionized the acquisition, display, and processing of physiological data. There are virtually no bedside monitors or ventilators marketed today that do not use at least one microcomputer. Figure 17.3 shows a block diagram of a bedside monitor. Physiological signals such as the ECG are derived from sensors that convert biological signals (such as pressure, flow, or mechanical movement) into electrical signals. In modern computerized monitors, these signalsare digitized as close to the patient as possible.
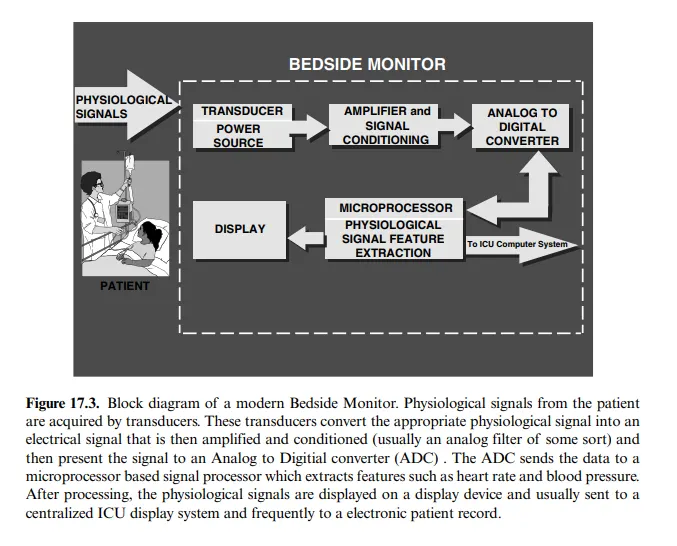
Some biological signals are already in electrical form, such as the currents that traverse the heart and are recorded as the ECG. The ECG voltage signal derived from the
electrodes at the body surface is small—only a few millivolts in amplitude. The patient
is electrically isolated from the bedside monitor, and the analog ECG signal is amplified
to a level sufficient for conversion to digital data using an analog-to-digital converter
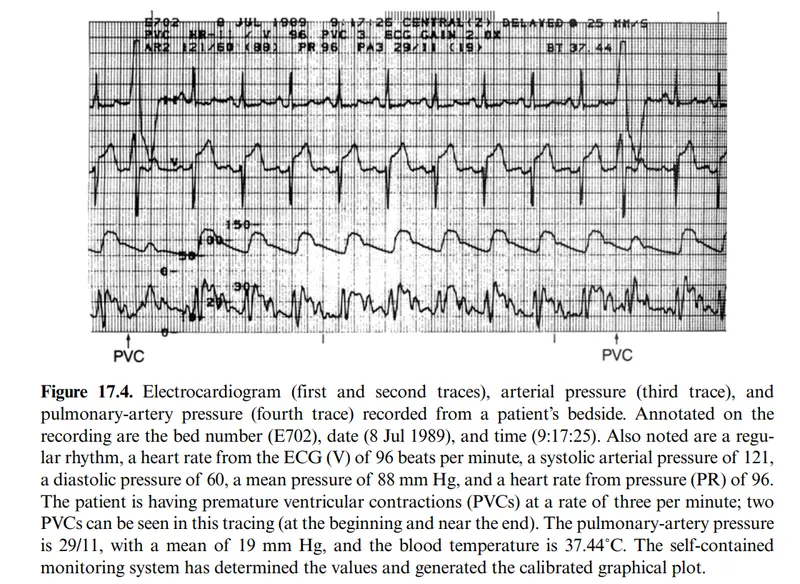
(ADC). Digital data then can be processed and the results displayed (Weinfurt, 1990,
p. 130) (Figure 17.4).
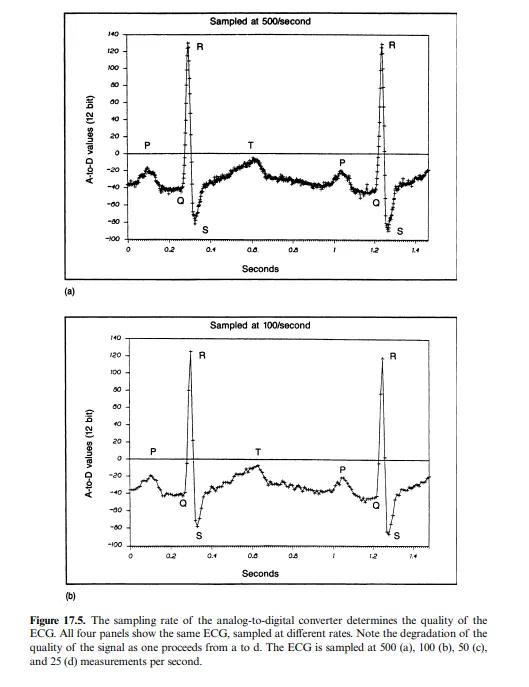
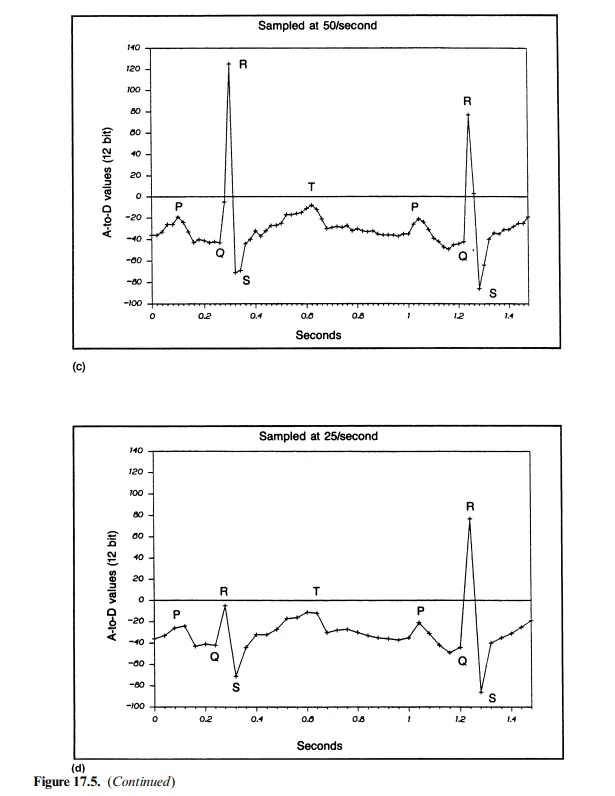
The sampling rate is an important factor that affects the correspondence between an analog signal and that signal’s digital representation. Figure 17.5 shows an ECG that has been sampled at four different rates. At a rate of 500 measurements per second (Figure 17.5a), the digitized representation of the ECG looks like an analog recording of the ECG. All the features of the ECG, including the shape of the P wave (atrial depolarization), the amplitude of the QRS complex (ventricular depolarization), and the shape of the T wave (ventricular recovery), are reproduced faithfully. When the sampling rate is decreased to 100 measurements per second, however, the amplitude and shape of the QRS complex begin to be distorted. When only 50 observations per second are recorded, the QRS complex is grossly distorted, and the other
features also begin to distort. At a recording rate of only 25 measurements per second, gross signal distortion occurs, and even estimating heart rate by measuring intervals from R to R is problematic.
Cleaning the Device and Accessories
Your device should be cleaned on a regular basis. If there is heavy pollution or lots of dust and sand in your place,
the device should be cleaned more frequently. Before cleaning the equipment, consult your hospital’s regulations for
cleaning the device.
Recommended cleaning agents are:
Sodium hypochlorite bleach (diluted)
Hydrogen peroxide (3%)
75% Ethanol
70% Isopropanol
To clean your device, follow these rules:
Switch off the monitor and disconnect the power cable before cleaning.
Kept the monitor from dust.
It is recommended to clean the outer shell and screen of the monitor to keep it clean. Only non-corrosive cleanser such as clear water is permitted.
Wipe the surface of the monitor and transducers with an Ethanol impregnated wipe, and dry it with dry and clean wipe or simply air-dry.
This monitor can be disinfected, please clean the monitor firstly.
Do not let the liquid cleanser flow into the connector jack of the monitor to avoid damage.
Clean the exterior of the connector only.
Dilute the cleanser.
Do not use scrub materials.
Do not let any liquid flow into the shell or any parts of the monitor.
Do not let the cleanser and disinfectant stay on its surface.
Do not perform high pressure sterilization to the monitor.
Do not put any parts of the monitor or its accessories in the liquid.
Do not pour the disinfectant on its surface while disinfectant.
If the monitor is accidentally wet, it should be thoroughly dried before use. The rear cover can be removed by qualified service technician to verify absence of water.
Never use this machine in an environment with inflammable gas.
Avoid being hit by lightning. The power cable should be plugged into an outlet with grounding wire. Do not use an outlet with poor condition. If possible, use power supply system with regulator.
It must be used in a clean environment protected against shock. Keep it away from corrosive substances, explosive substances, high temperature and dampness.
If it is installed in a cabinet, make sure the installation allows for good ventilation, and easy maintenance, observation and operation.
Disinfecting the Device and Accessories
Disinfection may cause damage to the device and is therefore not recommended for this monitor unless otherwise
indicated in your hospital’s servicing schedule. Cleaning device before disinfecting is recommended.
The recommended disinfects include:
75% Ethanol
70% Isopropanol
Do not use damaged accessories.
Accessories can not be entirely immerged into water, liquor or cleanser.
Do not use radiation, steam or EO to disinfect accessories.
Do wipe off the remained Ethanol or ispropanol on the accessories after disinfection, for good maintenance can
extend the life of accessories.
Single-use accessories are not designed to be reused. Reuse may cause a risk of contamination and affect the
measurement accuracy.
Multi-Parameter Patient Monitoring Systems:
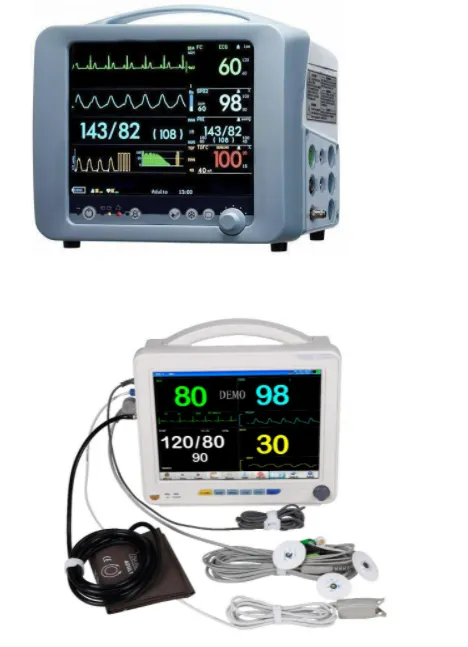
A multi-parameter Patient Monitoring System (PMS) is used for multiple critical physiological signs of the patient to transmit the vital information like Electrocardiograph, Respiration Rate, Blood pressure etc. Therefore, multi parameter PMS has always been occupying a very significant position in the field of medical devices. Due to continuous improvement of technologies in PMS help to put out the vital multiple physiological measurements signs to the medical personnel.
The latest PMS simplifies the measurement of physiological sign and increases the monitoring effectiveness. So nowadays PMS is very flexible and it can monitor multiple physiological signals in a single monitoring system.
Clinical used in Hospital:
The PMS commonly used in some clinical areas such as Intensive Care Unit (ICU), Critical Care Unit (CCU), operation room and emergency room because, the monitor can provide multiple physiological parameters of the patient to medical personnel.
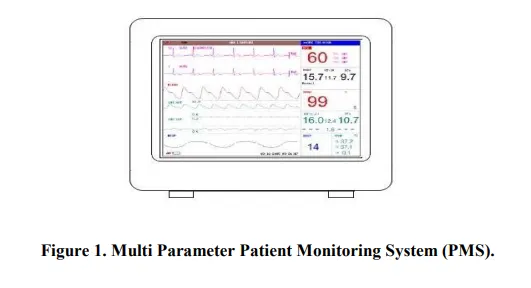
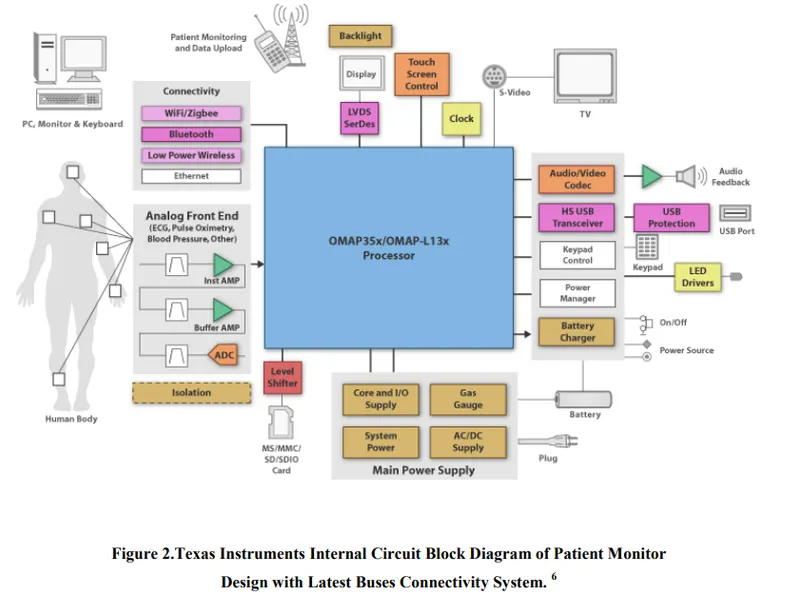
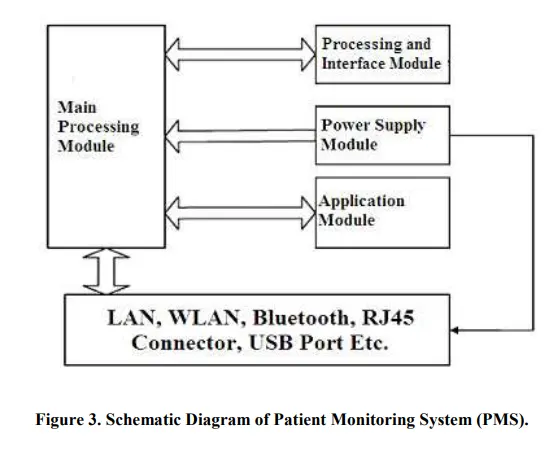
The Application parameters module of Patient Monitoring System (PMS) is made up by following physiological measurements
• Electro Cardio Graph (ECG) Module.
• Respiration Rate Module.
• Non-Invasive Blood Pressure (NIBP) Module.
• Invasive Blood Pressure (IBP) Module.
• Oxygen Saturation in Blood (SpO2) Module.
• Temperature Module.
• Carbon Monoxide (CO) Measuring Module.
• Carbon Dioxide (CO2) Measuring Module.
• Gas Measuring Module.
Alarms are typically displayed in two ways or as a combination of both:
- Acoustic
The alarm is given as a warning sound. Most manufacturers distinguish the priority of an alarm with different signals. Intuitive alarms with different tone sequences (e. g. 'short-long-short' for 'ven-ti-late') have been the object of research but have not found their way into routine clinical practice. Alarms directly mentioning organ systems, device hardware, or parts of it (e. g., ventilation or circulation) or alarms with direct labeling of the physiological problem ('blood pressure' or 'oxygen') have also not been introduced into practice.
- Visual
Visual alarms involve mostly flashing or coloring of the related parameter in an eye-catching manner. Some systems provide integrated displays of several parameters. One example is a spider-display, which shows the relationship of different parameters in a stylized spider web. Such applications can be useful to display different parameters in context. Compared to other professions in industry and aviation, adoption of such new displays in healthcare has been slow.
5 minutes
One of the challenges faced by the biomedical technician is performing periodic functional performance verifications on a large number of patient monitors. Typically, your CMMS software will generate a list of monitors, by model or by the department, that are scheduled for preventive maintenance every six or twelve months. In most facilities, the monitors must be checked on-site i.e. in the location where they are assigned. We rarely have the luxury of taking them to the shop where they can be checked in a systematic, orderly sequence. Nor, in most cases, is it practical? In most situations, it is necessary to verify the location of the monitors, then diplomatically ask the clinical staff for access to the monitors; which often requires performing the PMs as quickly as realistically possible.
This situation underscores the value of a simulator that incorporates all clinical parameters, thereby minimizing the number of test devices and associated accessories, cables, and power supply modules needed for each verification procedure. An ideal simulator will also provide pre-configured sets of abnormal as well as normal values or waveforms necessary for testing any patient monitor, from a basic NIBP machine in an outpatient clinic to a fully-opted multiparameter monitor on a cardiovascular anesthesia workstation.
The Fluke Biomedical ProSim 8 provides pre-sets for the six most commonly used parameters:
- Electrocardiograph (ECG)
- Non-invasive blood pressure (NIBP)
- Invasive blood pressure (IBP)
- Oxygen saturation (SpO2)
- Respiration
- Temperature
When initially powered-on, the ProSim 8 defaults to a “Normal” pre-set for these six values, and the user can select a “Hypertensive” as well as a “Hypotensive” pre-set. In terms of time, NIBP is unique among these parameters since it requires the unit under test (UUT) to pressurize a cuff or reservoir, then slowly decrease the pressure while making a determination of systolic, diastolic, and mean arterial pressures. On its initial NIBP cycle, the typical monitor will pressurize to160 mmHg. If the simulated systolic pressure is 120 mmHg, the UUT will successfully detect that systolic value, and store it in memory for use in the next NIBP cycle. On starting the next cycle, most NIBP monitors will pump up to a value slightly above the last systolic value, on the premise that the patient’s systolic pressure likely hasn’t increased significantly since the last cycle. However, if the next simulated systolic is in the “Hypertensive” pre-set, e.g. 200 mmHg, the UUT will “look” for the lower (“Normal”) systolic. Because it will detect pulsations immediately, its software will determine that the new systolic is higher, and command a new NIBP cycle. In some monitors the second cycle may still not find the new systolic value, requiring a third attempt. All of this will require additional time, so the proper sequence of test pre-sets will make a big difference in the total time taken for a thorough functional test.
In order to minimize the time taken for NIBP determinations, we recommend testing in the following sequence of pre-sets: “Hypertensive”, then “Normal”, then “Hypotensive”. Most monitors will require a re-attempt to detect the high systolic value on the first cycle, but NIBP cycles for the subsequent pre-sets will be made in one attempt. Our validations show that after brief familiarization, a technician can test a monitor for all six parameters in all three pre-set configurations in less than five minutes.
Suggested procedure:
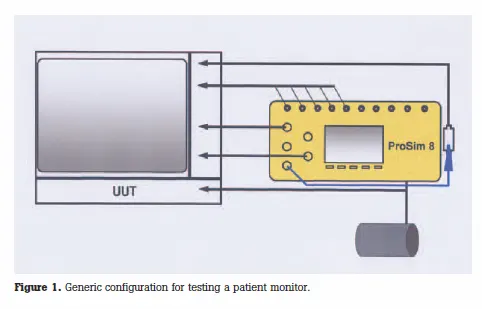
- Connect the UUT to the ProSim™ 8 with the appropriate ECG connections, NIBP test setup, pulse-oximeter sensor, and adapters for invasive blood pressure and temperature. See Figure 1.
- Power-on the UUT and the ProSim 8. (Set the NIBP function on the UUT to manual mode, if necessary.)
- Select the “Hypertensive” pre-set softkey on the ProSim 8.
- Start an NIBP cycle on the UUT; while the NIBP is being determined, verify that the other five parameters are within tolerances for the UUT.
- When the NIBP has been determined, verify that is within tolerances for the UUT.
- Select the “Normal” preset softkey on the ProSim 8.
- Repeat steps 4) and 5).
- Select the “Hypotensive” preset softkey on the ProSim 8.
- Repeat steps 4) and 5)
For testing a monitor in more depth, use the Autosequences feature available with the “Special Functions” key. With this feature, any one parameter or clinical status can be checked at many pre-configured points with a minimum of key-strokes. See the ProSim 8 Users Manual, page 55.
Testing patient care equipment can be a logistical challenge and there is always the temptation to take short-cuts in order to meet time constraints. By using pre-configured values for normal, as well as abnormal, clinical states, a full-function simulator like ProSim 8 can enable the technician to test any patient monitor thoroughly in minimal time. Then, if any of the tests fail, they can initiate troubleshooting efforts in order to fix the issue(s).