Plot a function y(x) = (x-1) and Suspension System Comparison
basic Simulink blocks
AIM:-Plot a function y(x) = (x-1) * (x-3)^2 * (x-9)^2 using basic Simulink blocks and analysing Simulink example “Suspension System Comparison” .
first objective:-Plotting a function y(x) = (x-1) * (x-3)^2 * (x-9)^2 using basic Simulink blocks.
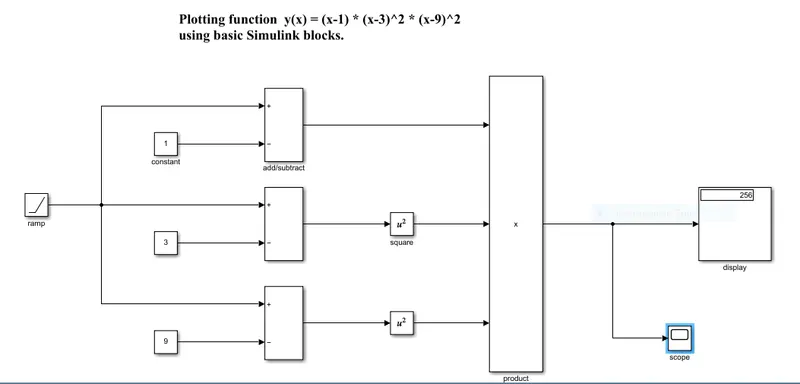
explanation :-
RAMP=using of ramp block which gives multiple number like an for loop with increase in number with every for loop completes as in the form of x.
CONSTANT =taking 3 constant block with gives the constant values for the given no which is 1,3,9 in {y(x) =(x-1) * (x-3)^2 * (x-9)^2}
ADD= using the add block to add/subtract to the give input
SQUARE= this block square the input add block passes forther output.
PRODUCT= output of square and add is given to product block which multiplies it and give output.
DISPLAY= the final output of product is displayed in the display block.
SCOPE= same output of product is send to scope which display signal and gives the graph .
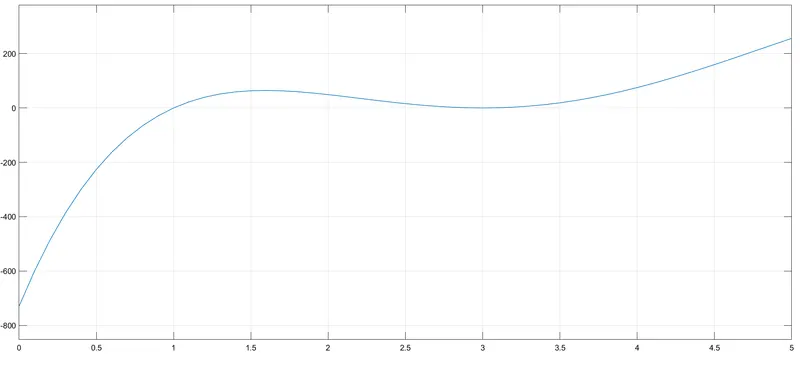
RESULT:
display =output of the given input is 256 shown in display which is run at the time duration of 5 second.
scope = the graph ploted by the scope with given function f(y) which is plotted in 5 second.
SECOND OBJECTIVE:-
Run Simulink example “Suspension System Comparison” and answer the following:
A shock absorber or damper is a mechanical or hydraulic device designed to absorb and damp shock impulses. It does this by converting the kinetic energy of the shock into another form of energy (typically heat) which is then dissipated. Most shock absorbers are a form of dashpot (a damper which resists motion via viscous friction).
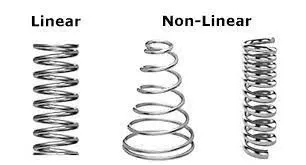
A linear spring is one with a linear relationship between force and displacement, meaning the force and displacement are directly proportional to each other. A graph showing force vs. displacement for a linear spring will always be a straight line, with a constant slope.
A nonlinear spring has a nonlinear relationship between force and displacement. A graph showing force vs. displacement for a nonlinear spring will be more complicated than a straight line, with a changing slope.
What is the objective of the simulation?
Simulation is used to predict the performance of an existing or planned system and to compare alternative solutions for a particular design problem.
it saves money and time and risk free of any experiment performed in real life.
helps to increase accuracy of the performing modle.
Acquaint the participants with the decision-making process in situations of uncertainty and in the presence of confused and inaccurate information.
Encourage participants to make a critical analysis of information received concerning the disaster.
Provide an opportunity to make decisions on most of the problems associated with the emergency.
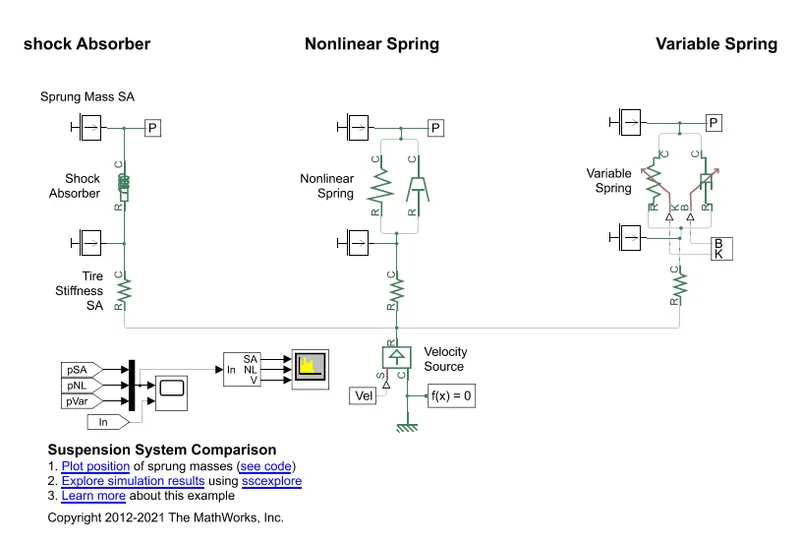
in this “Suspension System Comparison” the objective is to give the same velocity as input and check the sprung mass position with with change in frequency of it.
What are the similarities and differences between the three systems understudy?
all three system are provided with same velocity source and tire stiffness .
all three system is given same sprung mass and same unsprung mass.
first one is shock abosorver block or Represents a translational shock absorbe.
second one is combination of nonlinear spring and nonlinear damping system.
third one is combination of variable translational spring and variable translational damper
What are your observations from the results?
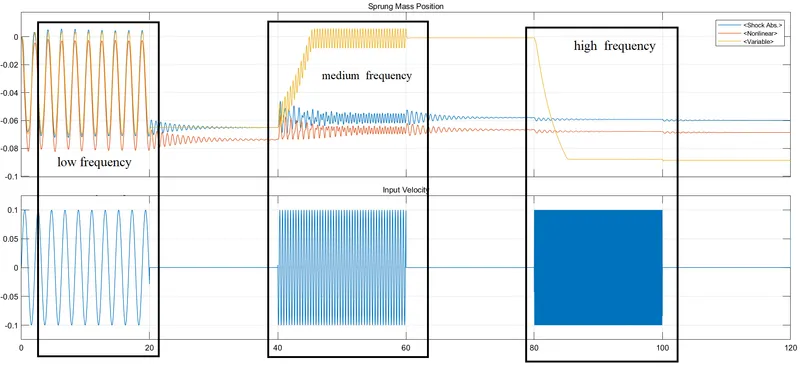
in the below figure the simulation was run for 120 sec which provides with 2 graph in scope .
the graph sprung mass position shows the vibrations of shock abs,nonlinear spring and variable spring
the graph input velocity represent frequency with given time period .
when the freauency is 3 (rad/sec) the time period of 0-20 sec the graph for all three is almost same
when the freauency is 15 (rad/sec) the time period of 40-60 sec the graph for shock abs and nonlinear are close to each other. but the variable spring is way far from shock abs and nonlinear.
and when the freauency is 75 (rad/sec) the time period of 80-100 sec the graph for shock abs and nonlinear are littel close to each other. but the variable spring is lower shock abs and nonlinear.
this graph tell that when the frequency of the is low the mass postion are same but with increase in frequency changes the mass postion of the the three system.
How the oscillating velocity source is created?
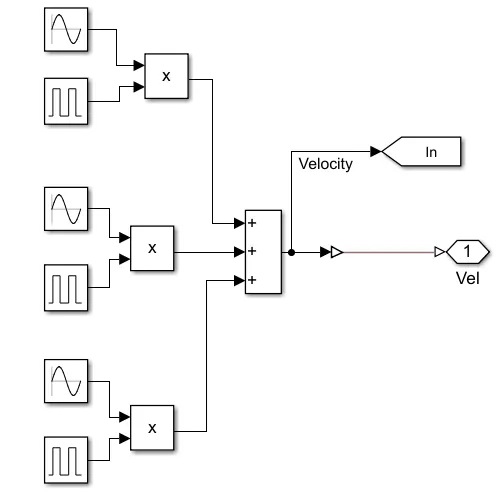
three set are created of with 3 product input values of sine wave block and pulse generater block .
first sine wave block and pulse generater block input is stored in first product.3rad/sec
second sine wave block and pulse generater block input is stored in second product .15rad/sec
third sine wave block and pulse generater block input is stored in third product .75rad/sec
a sum block is introduce which takes all three product block output and calculate the sum of it.
the final sum is taken as the velocity signal.
refrences:-
https://en.wikipedia.org/wiki/Shock_absorber
https://www.sciencebuddies.org/science-fair-projects/references/linear-nonlinear-springs-tutorial
thank you