Project 1 - Parsing NASA thermodynamic data
Project 1 - Parsing NASA thermodynamic data
AIM: Write a code in matlab to extract data from NASA thermodynamic file of various species.
OBJECTIVE:
Write a function that extracts the 14 co-efficients and calculates the enthalpy, entropy and specific heats for all the species in the data file.
Calculate the molecular weight of each species .
Plot the Cp, Enthalpy and Entropy for the local temperature range
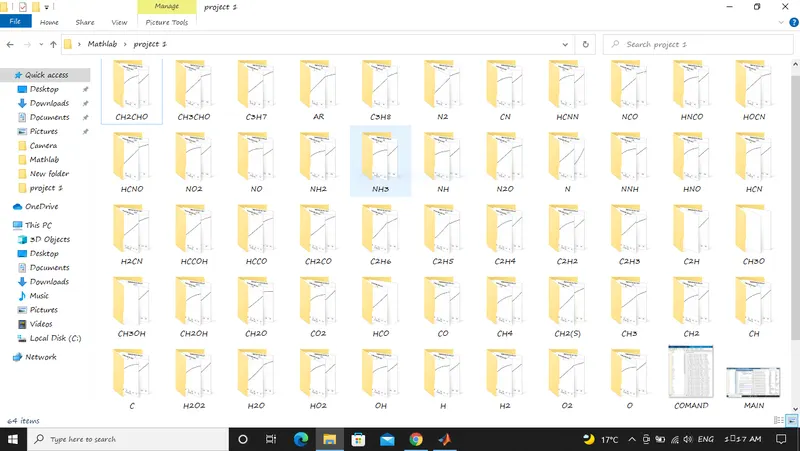
Save the plots as images with appropriate names and dump them in separate folders for each species with suitable name. All these should be generated automatically.
WHAT IS DATA PARSING
Data parsing is the process of taking data in one format and transforming it to another format. You'll find parsers used everywhere. They are commonly used in compilers when we need to parse computer code and generate machine code.This happens all the time when developers write code that gets run on hardware.
NASA came up with polynomials that can be used to evaluate thermodynamic properties such as Cp, H and S. They have also documented the co-efficients that are required to evaluate these polynomials for 1000+ species.To guide you we have broken down the problem into meaningful bits that you can work on individually.
FORMULA TO FIND enthalpy [S], entropy [H] and specific heats [CP]
where R is universal gas constant.
and a1, a2,a3 .....,a14 are the co-efficient that need to be extracted from the file .
The FIRST 7 coefficients are HIGH-temperature coefficients and the SECOND 7 coefficients are LOW-temperature coefficients
example:
H=R*T.*(a1+((a2*T)/2)+((a3*T.^2)/3)+((a4*T.^3)/4)+((a5*T.^4)/5)+a6./T) multiply with high temp
H=R*T.*(a8+((a9*T)/2)+((a10*T.^2)/3)+((a11*T.^3)/4)+((a12*T.^4)/5)+(a13./T)) multiply with low temp
how i had multiply see it in function.
EXPLANATION OF DATA FILE
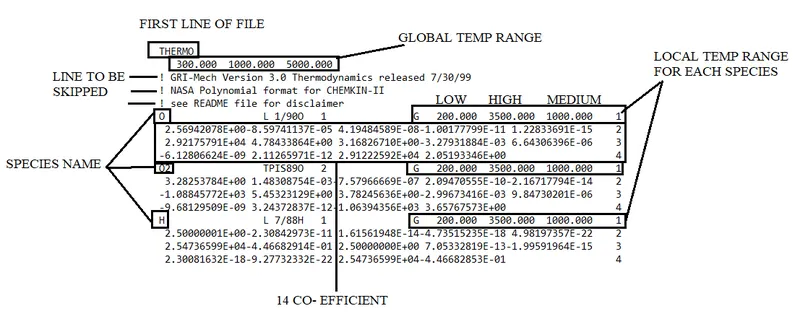
code for Parsing NASA thermodynamic data
clear all
close all
clc
% UNIVERSAL GAS CONSTANT  J .mol^{-1} .K^{-1}
R = 8.3145;
% READING THE FILE
f1=fopen('THERMO.dat','r');
%SKIPPING LINE
READ=fgetl(f1);
% STORING LINE I NEED
GLOBAL_TEMP=fgetl(f1);
% SPECIFING THE LINE BY SPACING
A=strsplit(GLOBAL_TEMP,' ');
% CONVERTING CELL TO NUMBER
global_low_temp=str2num(A{2});
global_mid_temp=str2num(A{3});
global_high_temp=str2num(A{4});
%SKIPPING LINE
for i=1:3
    fgetl(f1)
end
for q=1:53
% DATA PRESENT IN LINE NO-1 OF "O2" {LOCAL TEMPERATURE RANGE}
LINE_1=fgetl(f1);
species_name=strtok(LINE_1);               % using strtok to get first name
X=findstr(LINE_1,'.');
tlow=str2num(LINE_1(X(1)-4:X(1)+3));
tmid=str2num(LINE_1(X(3)-4:X(3)+3));
thigh=str2num(LINE_1(X(2)-4:X(2)+3));
% CREATING TEMPERATURE RANGE
T=linspace(tlow,thigh,100);
% EXTRACTING DATA FROM LINE NO-2 OF "O2"
LINE_2=fgetl(f1);
a=findstr(LINE_2,'E');
a1=LINE_2(1:a(1)+3);                   % IN THE FORM OF STRING
a1=str2num(a1);                        % CONVERT FROM STRING TO NUMBER
a2=LINE_2(a(1)+4:a(2)+3);
a2=str2num(a2);
a3=LINE_2(a(2)+4:a(3)+3);
a3=str2num(a3);
a4=LINE_2(a(3)+4:a(4)+3);
a4=str2num(a4);
a5=LINE_2(a(4)+4:a(5)+3);
a5=str2num(a5);
% EXTRACTING DATA FROM LINE NO-3 OF "O2"
LINE_3=fgetl(f1);
b=findstr(LINE_3,'E');
a6=LINE_3(1:b(1)+3);
a6=str2num(a6);
a7=LINE_3(b(1)+4:b(2)+3);
a7=str2num(a7);
a8=LINE_3(b(2)+4:b(3)+3);
a8=str2num(a8);
a9=LINE_3(b(3)+4:b(4)+3);
a9=str2num(a9);
a10=LINE_3(b(4)+4:b(5)+3);
a10=str2num(a10);
% EXTRACTING DATA FROM LINE NO-4 OF "O2"
LINE_4=fgetl(f1);
c=findstr(LINE_4,'E');
a11=LINE_4(1:c(1)+3);
a11=str2num(a11);
a12=LINE_4(c(1)+4:c(2)+3);
a12=str2num(a12);
a13=LINE_4(c(2)+4:c(3)+3);
a13=str2num(a13);
a14=LINE_4(c(3)+4:c(4)+3);
a14=str2num(a14);

%% PLOTTING  Cp, ENTHALPY and ENTROPY FOR THE LOCAL TEMPERATURE RANGE
% TEMPERATURE VS CP [SPECIFIC HEAT]
figure(1)
Cp=specific_heat(a1,a2,a3,a4,a5,a8,a9,a10,a11,a12,tmid,T,R);
plot(T,Cp,Color='k',LineWidth=2);
xlabel('TEMPERATURE');
ylabel('SPECIFIC HEAT');
title('TEMPERATURE VS SPECIFIC HEAT',species_name);
grid on;

% TEMPERATURE VS ENTHALPY [H]
figure(2)
H=enthalpy(a1,a2,a3,a4,a5,a6,a8,a9,a10,a11,a12,a13,tmid,T,R);
plot(T,H,Color='k',LineWidth=2);
xlabel('TEMPERATURE');
ylabel('ENTHALPY');
title('TEMPERATURE VS ENTHALPY',species_name);
grid on;
% TEMPERATURE VS ENTROPY [S]
figure(3)
S=entropy(a1,a2,a3,a4,a5,a7,a8,a9,a10,a11,a12,a14,tmid,T,R);
plot(T,S,Color='k',LineWidth=2);
xlabel('TEMPERATURE');
ylabel('ENTROPY');
title('TEMPERATURE VS ENTROPY',species_name);
grid on;

                     %% CALCULATING MOLICULAR MASS

species_name=species_name;
elements=['O','H','C','N','A','S'];
atomic_weight=[15.999,1.00784,12.0107,14.0067,39.948,32.065];
mol_weight=0;
for l=1:length(species_name)
    for m=1:length(atomic_weight)
        if strcmp(species_name(l),elements(m))
            mol_weight=mol_weight+atomic_weight(m);
            position=m;
        end
    end
    n=str2double(species_name(l));
    if n>1
        mol_weight=mol_weight+atomic_weight(position)*(n-1);
    end
end
% PRINTING MOLECULAR WEIGHT IN COMMAND WINDOW
fprintf('%s species %s %f\n',species_name,'molecular mass',mol_weight);

 %% MAKING ANF FOLDER GIVING NAME BY SPECIES_NAMES AND SAVING PLOT
mkdir(species_name);
cd(species_name);
saveas(figure(1),'TEMPERATURE VS SPECIFIC HEAT','jpg');
saveas(figure(2),'TEMPERATURE VS ENTHALPY','jpg');
saveas(figure(3),'TEMPERATURE VS ENTROPY','jpg');
cd('C:\Users\ASUS\Desktop\Mathlab\project 1');

%% CREATING TEXT FILE AND WRITTING SPECIES NAME AND MOLICULAR WEIGHT
f2=fopen('molecular weight.txt','a');
 fprintf(f2,'%10s %2s %20s %2.3f \n','species name :', species_name,'molecur weight :',mol_weight);
 fclose(f2);
end
fclose(f1);
specific heat function
function [Cp]=specific_heat(a1,a2,a3,a4,a5,a8,a9,a10,a11,a12,tmid,T,R)

% FINDING SPECIFIC HEAT WITH LOW AND HIGH TEMPERATURE VARIABLES
if T<=tmid
    %the SECOND 7 coefficients are LOW-temperature coefficients.
    Cp=R*(a8 + (a9 *T) + (a10* T.^2) + (a11 *T.^3) + (a12 *T.^4));
else
    % The FIRST 7 coefficients are HIGH-temperature coefficients
    Cp=R*(a1 + (a2 *T) + (a3* T.^2) + (a4 *T.^3) + (a5 *T.^4));
end
end
entropy function
function [S] =entropy(a1,a2,a3,a4,a5,a7,a8,a9,a10,a11,a12,a14,tmid,T,R)
% FINDING ENTROPY WITH LOW AND HIGH TEMPERATURE VARIABLES
if T<=tmid
    %the SECOND 7 coefficients are LOW-temperature coefficients.
    S =R*((a8*log(T))+(a9*T)+((a10*T.^2)/2)+((a11*T.^3)/3)+((a12*T.^4)/4)+a14);
else
    % The FIRST 7 coefficients are HIGH-temperature coefficients
    S = R*((a1*log(T))+(a2*T)+((a3*T.^2)/2)+((a4*T.^3)/3)+((a5*T.^4)/4)+a7);
end
end
enthalpy function
function [H] =enthalpy(a1,a2,a3,a4,a5,a6,a8,a9,a10,a11,a12,a13,tmid,T,R)
% FINDING ENTHALPY WITH LOW AND HIGH TEMPERATURE VARIABLES
if T<=tmid
    %the SECOND 7 coefficients are LOW-temperature coefficients.
     H=R*T.*(a8+((a9*T)/2)+((a10*T.^2)/3)+((a11*T.^3)/4)+((a12*T.^4)/5)+(a13./T));
else
    % The FIRST 7 coefficients are HIGH-temperature coefficients
    H=R*T.*(a1+((a2*T)/2)+((a3*T.^2)/3)+((a4*T.^3)/4)+((a5*T.^4)/5)+a6./T);
end
end
EXPLANATION
first start with clear all ,close all, clc, which will help to run fresh program every time we runs.
providing the value of R which univertal gas constant.
using fopen comand to open the thermo file and ' r ' to read the file and stored it in f1.
using fgetl comand to skip the line and saved as read which do not contain necessory data.
{every time fgetl is entered it provides it prints the next line.}
starsplit comand use to split the line where we have space .it takes the line and [' '] seprates the them.
example
300.000 1000.000 5000.000
{0×0 char} {'300.000'} {'1000.000'}{'5000.000'}
used star2num comand to convert string to number and saved it in the format as see in codes.
using for loot for 3 time for skiping the lines which have no data by printing it in comand bad using fgetl comand.and end for loop.
as there are total 53 species using creating new for loop for 1:53 and ending it at the last of the code.
line_1 contains the data of species name and temperature range of that species.
strtok comand take the first value of the line which gives the species name.
findstr this comand takes the line and finds what we need written in inverted [' . '] and stored as x.
this will tell where the dot[.] is present so that i can find the position of the number in the line.
str2num comand too convert the string into number taking the line where the temp is present .x(1) where the [.] is present in x line. that line -4 is the number of digit back from the dot[.] t0 : x(1) where the [.] is present in that same linex. +3 is the number of digit forword from the dot[.] .
example
200.000 3500.000 1000.000
200.000
same process is repeated to next 2 temperature range.
t is linspace comand with starting temp to ending temp with 100 values. temperature which are extracted from x line.
line_2,line_3,line_4 with fgetl comand which have 14 coefficient data
a=findstr comand to find 'E' in the line_2
a1=LINE_2(1:a(1)+3)
in line_2 where 1 is the first number of the line to : a(1) which is the position of the E present in the line +3 is the forword 3 digit of the line
str2num to convert the string to number of the line we find the first coefficient.
example ' 2.56942078E+00' to 2.5694
same process is repeated and store the content in definite name tell we get all 14 coefficient.
using figure(1), (2) ,(3) to plot figures
using of specific_heat ,enthalpy,entropy function which is sepately written.[see in codes]
plot comand to plot the graph with color of line and linewidth
providing x labe and y label
providing title with proper name and species name { which is extracted from line_1 by using strtok comand}
see the my code for better experience.
calculating of MOLICULAR MASS
making an array of elements which contain all the common of the species.
another array of atomic weight whic contain the automic weight of common species in element
example
elements=['O','H','C','N','A','S'];
atomic_weight=[15.999,1.00784,12.0107,14.0067,39.948,32.065];
creating a for loot for length of species_name another for loop for length of atomic_weight length.
providing if condition and using strcomp comand to compair both elements,atomic_weight array
what is happening here is this will comapir the value of species name and element name . if any match is found then it will take the value from atomic weight and if more than 1 match is found then the atomic weight is added as many time it is found of .
[ NOTE for COMAPRING both thr array should have same size.]
pos comand use to know which element is found
if n>1 adding the atomic weight if more than one element is found.
fprintf comand to print species name and molweight in command window.
where %s is for text and %f is for floting no and \n is to go to next line
mkdir comand for making a folder.
cd is where the file is to be located.
saveas to save the figure with aproprate name.
using the cd comand to come back again where the comand is running.
angin opening fopen with different name with molecular weight.txt' name and 'a' is for Open or create new file for writing. Append data to the end of the file.
this will write continously if running in a loop .
if using 'r' it wll only write and re write for another one.
if using 'a' it wll write till the end at which all the species are printed.
end {the loop 1:53 which is crated to run 53 time for extracting data and molecular weight and writting in txt file for all the 53 species.}
fclose for where we were writting and fclose for reading file.
EXPLANATION OF FUNCTION
SPECIFIC HEAT
output = function name (input as T AND R AND ,coefficient present in cp formulas only)
starts with if T<=tmid
where time array is taken and if the value is less then tmid then that values will be taken by this R*(a8 + (a9 *T) + (a10* T.^2) + (a11 *T.^3) + (a12 *T.^4));
or values higher then tmid will be taken by this coefficient
R*(a1 + (a2 *T) + (a3* T.^2) + (a4 *T.^3) + (a5 *T.^4));
end
entropy
output = function name (input as T AND R AND ,coefficient present in entropy formulas only)
starts with if T<=tmid
where time array is taken and if the value is less then tmid then that values will be taken by this R*((a8*log(T))+(a9*T)+((a10*T.^2)/2)+((a11*T.^3)/3)+((a12*T.^4)/4)+a14);
or values higher then tmid will be taken by this coefficient
S = R*((a1*log(T))+(a2*T)+((a3*T.^2)/2)+((a4*T.^3)/3)+((a5*T.^4)/4)+a7)
end
enthalpy
output = function name (input as T AND R AND ,coefficient present in enthalpy formulas only)
starts with if T<=tmid
where time array is taken and if the value is less then tmid then that values will be taken by this
R*T.*(a8+((a9*T)/2)+((a10*T.^2)/3)+((a11*T.^3)/4)+((a12*T.^4)/5)+(a13./T));
or values higher then tmid will be taken by this coefficient
R*T.*(a1+((a2*T)/2)+((a3*T.^2)/3)+((a4*T.^3)/4)+((a5*T.^4)/5)+a6./T);
end
Screenshot of the window where all the folders are saved.
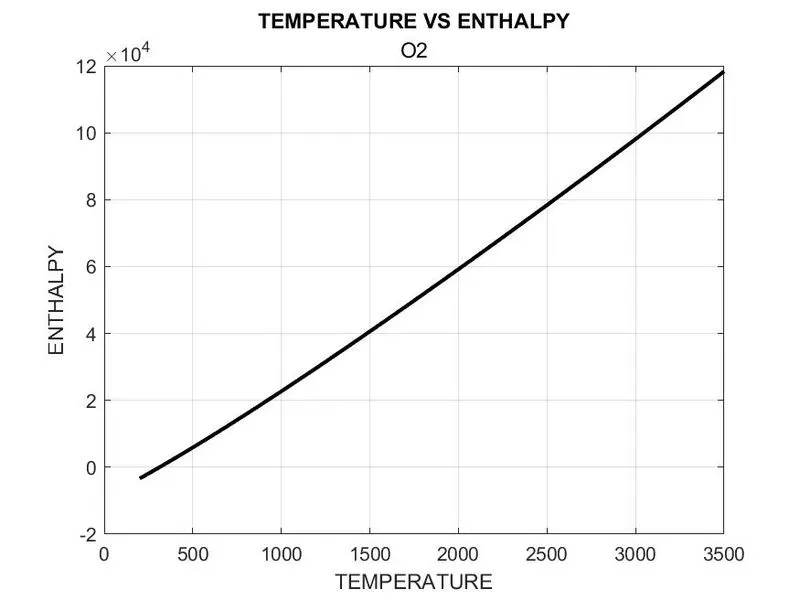
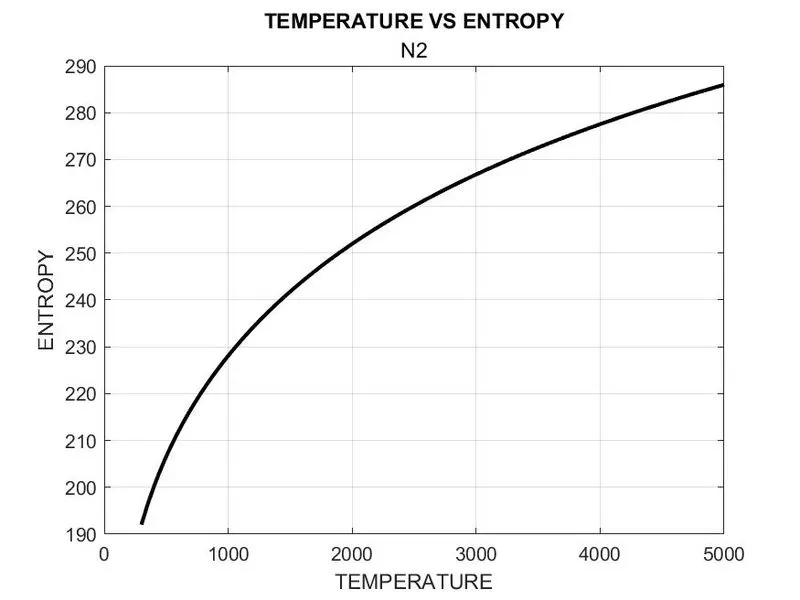
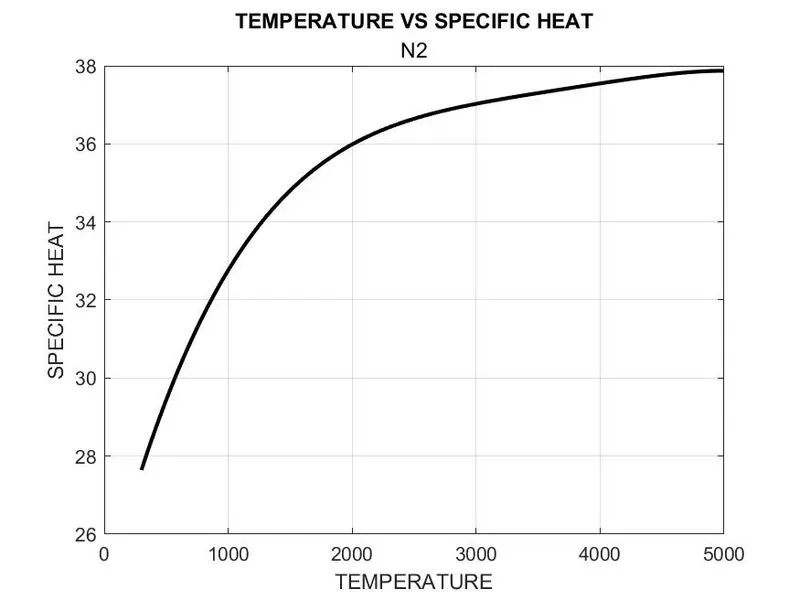
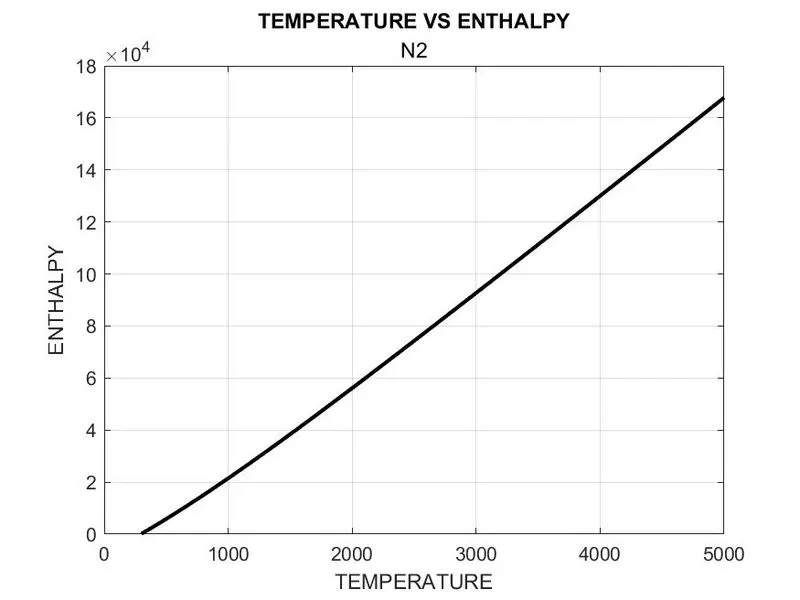
Plots for o2, N2 and Co2 species
FOR O2
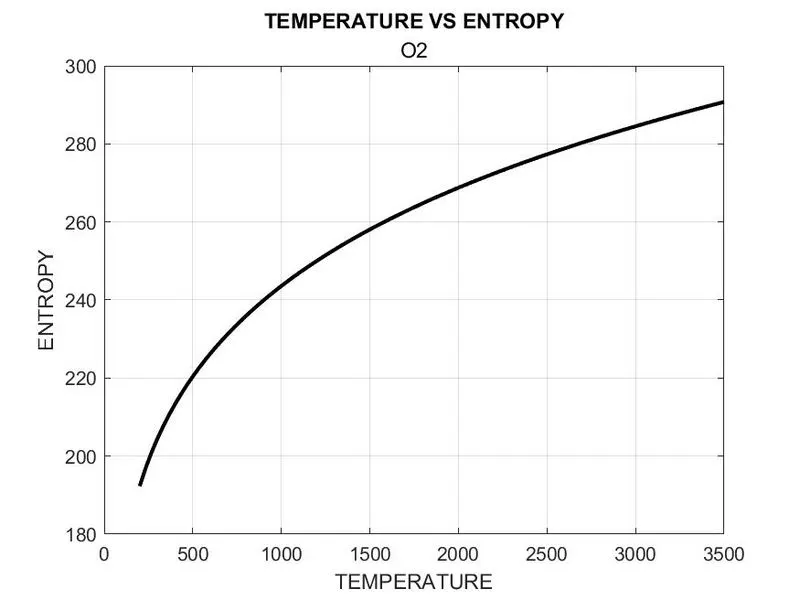
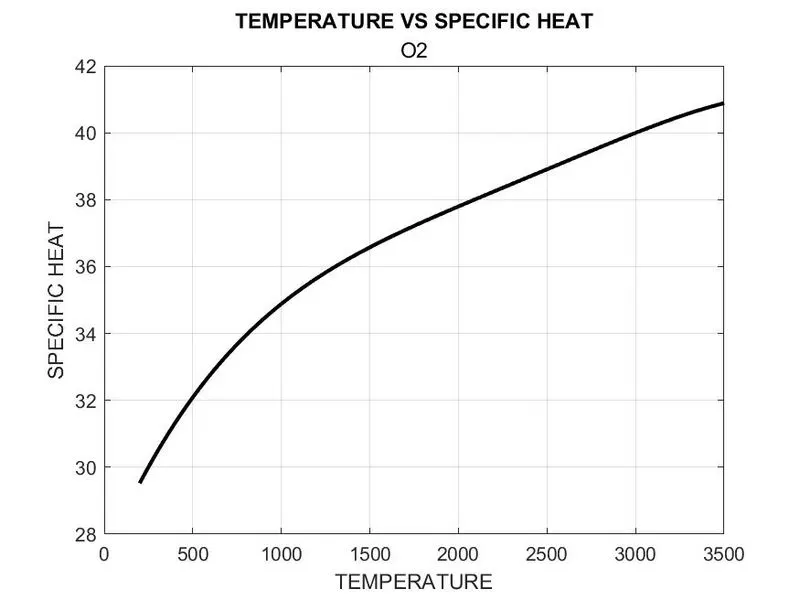
FOR N2
FOR CO2
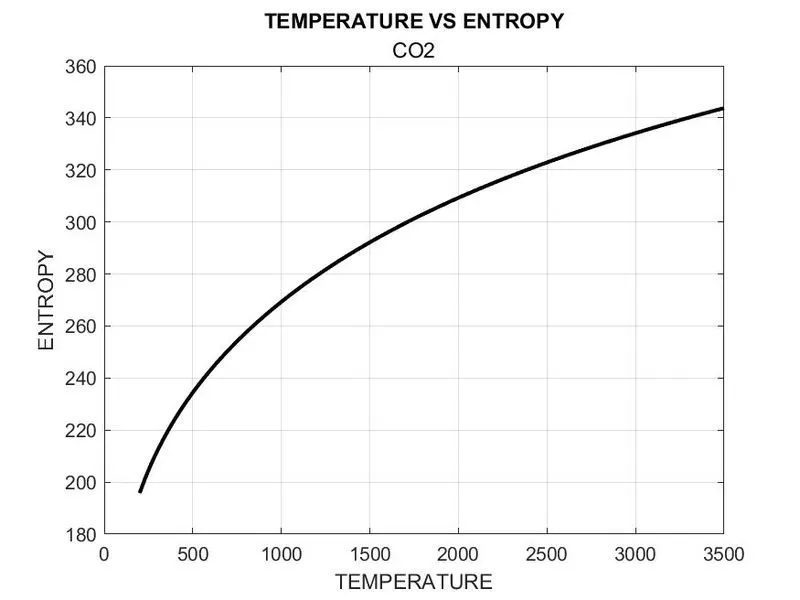
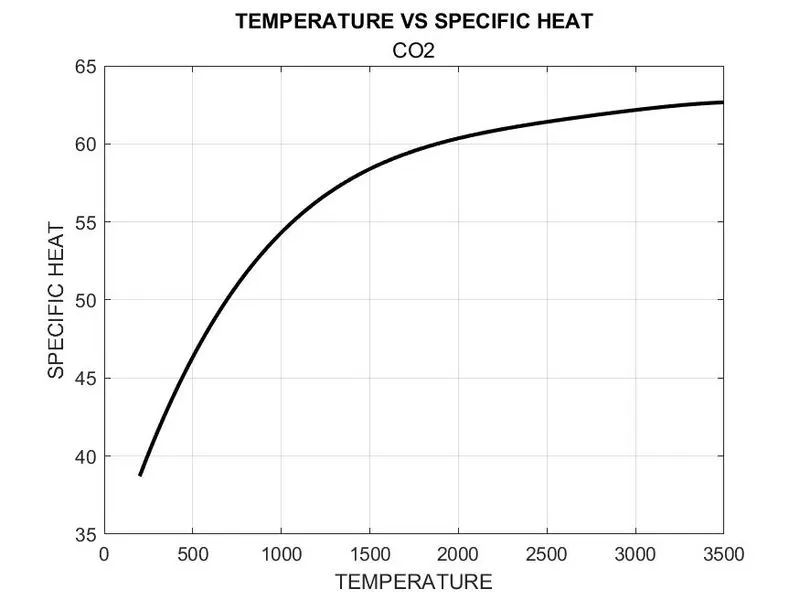
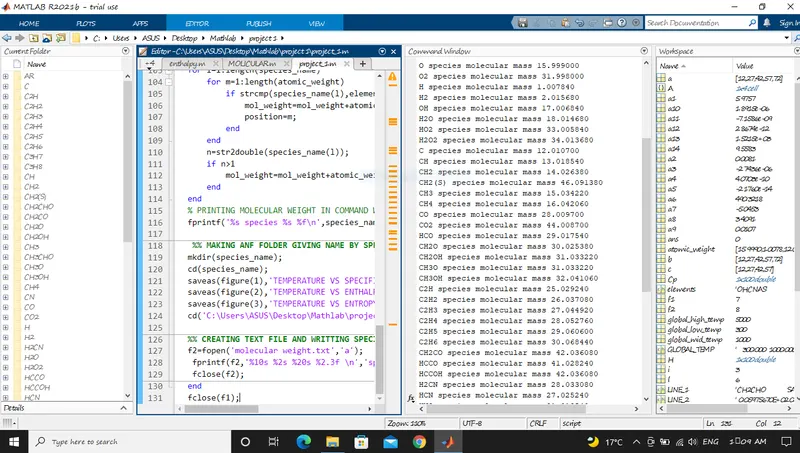
Calculate the molecular weight of each species and display it in the command window.
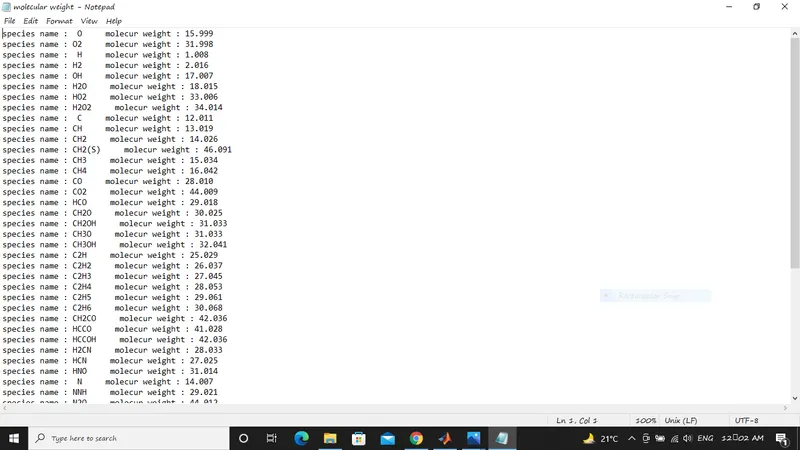
CREATED TEXT FILE AND SAVED AUTOMATICALLY
errors
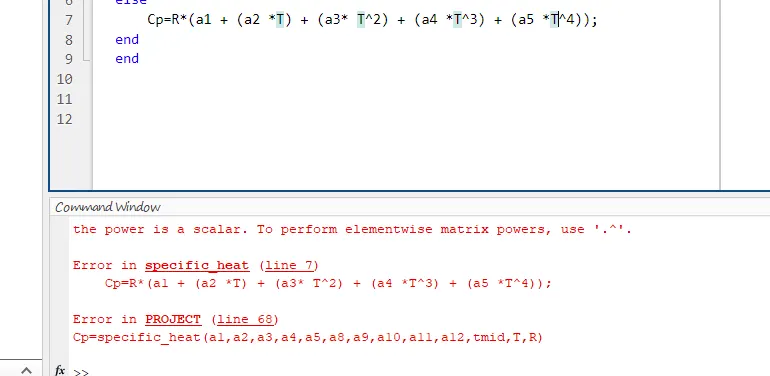
forgot to put elementwise oprating.
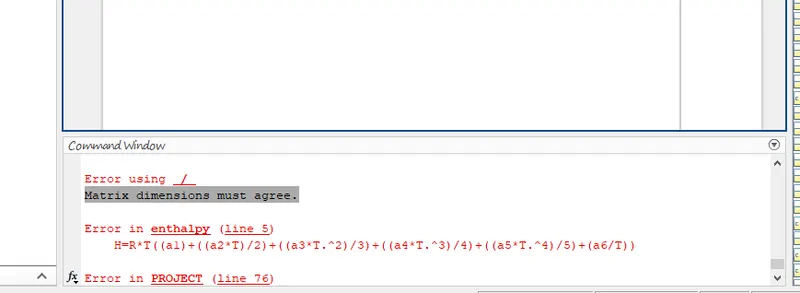
THIS ERROR WAS FREAKING ME OUT ACTUALLY IT SHOULD BE R*T.* AND[ ./T]
references
https://in.mathworks.com/help/matlab/ref/fopen.html
https://in.mathworks.com/help/matlab/ref/mkdir.html
https://in.mathworks.com/help/matlab/ref/saveas.html
https://in.mathworks.com/help/matlab/ref/strcmp.html
THANK YOU