PARSING NASA THERMODYNAMIC DATA
AIM: To write a MATLAB code to parse NASA thermodynamic data and calculate various thermodynamic properties of the given species
OBJECTIVES:
- Write a function that extracts the 14 coefficients and calculates the enthalpy, entropy and specific heat for all the species in the data.
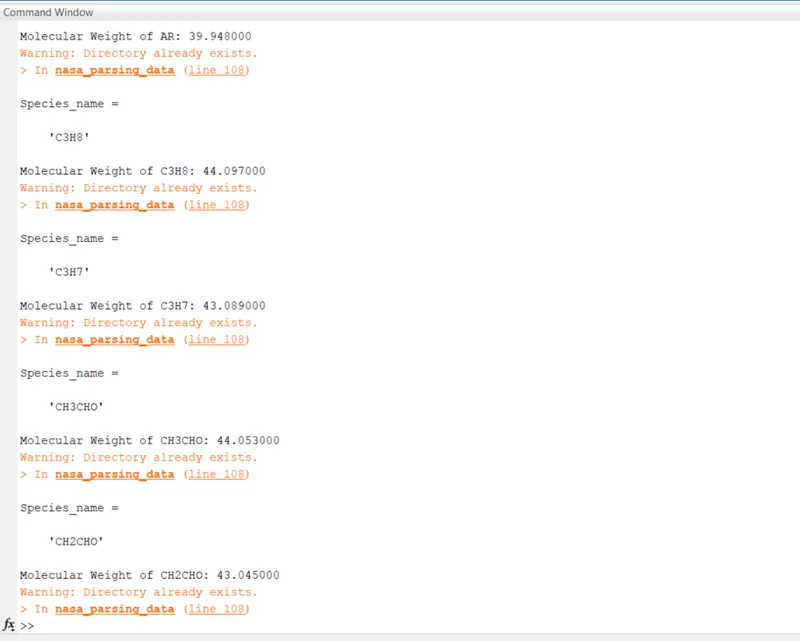
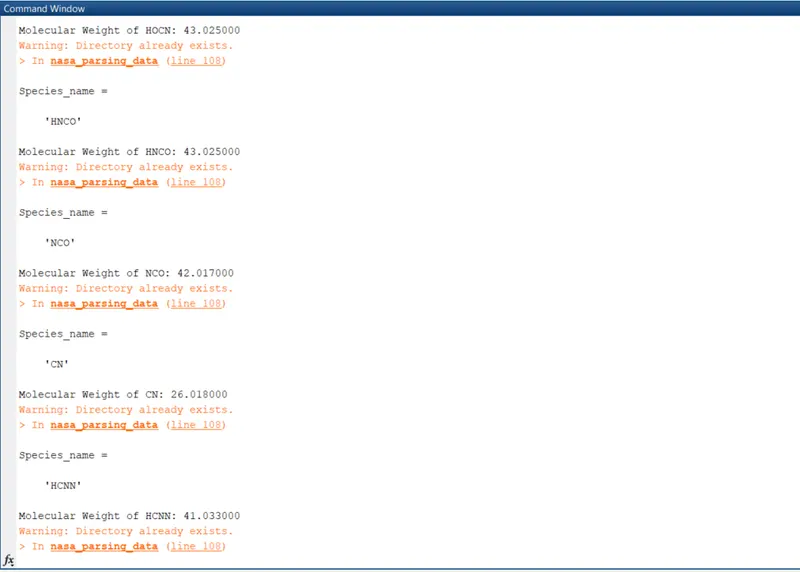
- Calculate the molecular weight of each species and display it the command window
- Plot the specific heat, enthalpy and entropy for the local temperature range (low temperature:high temperature) specific for each species.
- Save the plots as images with appropriate names and dump them in separate folders for each species with suitable name. All should be generated automatically.
- The main program should take only the “THERMO.dat” file as an input and generate the Specific heat (Cp), Entropy (S) and Enthalpy (H) plots.
- Screenshot of the window where all the folders of species are saved.
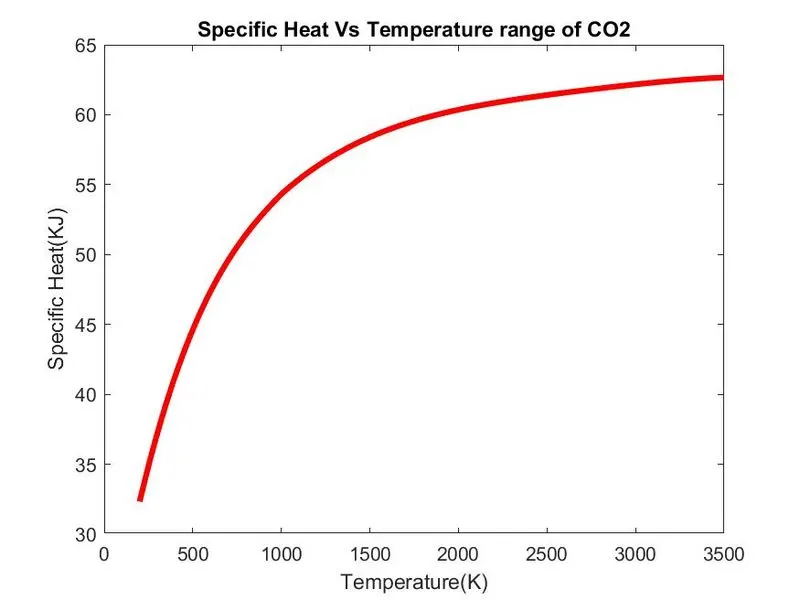
- Plots for O2, N2 and CO2 species.
EQUATIONS USED:
`Cp⁄R=a1+a2T+a3T^2+a4T^3+a5T^4`
`H⁄RT=a1+a2T/2+(a3T^2)/3+(a4T^3)/4+ (a5T^4)/5+ a6/T`
`S⁄R=a1 lnT+a2T+(a3T^2)/2+(a4T^3)/3+(a5T^4)/4+a7`
DETAILS:
Programming language: MATLAB
Concepts used: Data parsing, specific heat, entropy, enthalpy, atomic weight.
Loop used: For loop
THEORY:
Data parsing:
Nowadays, with multiple innovations in science we have assisted to the introduction of concepts like big data into our daily activities such as business models. Thus, the need for data extraction, analysis and processing is increasingly unavoidable to most of the companies across industries. However, as natural languages require translation to effectively communicate interpersonally, computer and programming languages also require such process which refers to data parsing. So, in simple words, data parsing is the transformation of unstructured and sometimes unreadable data into structured and easily readable data.
Specific heat:
It is the amount heat required to raise the temperature of a unit mass of a homogeneous phase of a substance by one degree. If the process takes place with either constant-volume or constant-pressure, the term is respectively referred as constant-volume (Cv) or constant-pressure (Cp) specific heat. Its units are KJ/Kg.K or Btu/Ibm.F.
Entropy (S):
It is a measure of the disorder of a system. The change in the entropy of a system is always greater, or at least equal to the heat transfer to or from the system divided by the temperature of the system. Its units are J/K or Btu/R
Enthalpy (H):
It is the summation of the internal energy (U) and pressure work (PV). The internal energy represents the energy on the microscopic level.
Molecular weight:
Molecular weight of a compound is the sum of the atomic weights of the atoms that constitute a molecule of the compound.
Species involved:
The species concerned are a total of 53 and following is the list:
O O2 H H2 OH H2O H2O2 C CH CH2 CH2(S) CH3
CH4 CO CO2 HCO CH2O CH2OH CH3O CH3OH C2H
C2H2 C2H3 C2H4 C2H5 C2H6 CH2CO HCCO HCCOH
H2CN HCN HNO N NNH N2O NH NH2 NH3 NO NO2
HCNO HOCN HNCO NCO CN HCNN N2 AR C3H8 C3H7
CH3CHO CH2CHO
PROGRAM AND STEPWISE EXPLANATION:
- Program Function
- subfunc
  %One global sub-function
  %In this function we will calculate specific heat, entropy and enthalpy
  %for both low temperature range and high temperatue range.

function [Cp S H] = subfunc(a1,a2,a3,a4,a5,a6,a7,a8,a9,a10,a11,a12,a13,a14,T,R,local_medium_temp)%Function defintion

for k = 1:length(T)%THis loop runs along the length of the temperature T

    %Calculation of Cp, S and H for high temperature coefficients

    if T(k) > local_medium_temp %Comparing each element of T to the local medium teemperature

        Cp(k) = R*(a1 + (a2.*T(k)) + (a3.*(T(k)).^2) + (a4.*(T(k)).^3) + (a5.*(T(k)).^4));%formula to calculate the Cp

        S(k) = R*(a1.*log(T(k)) + (a2.*T(k)) + (a3.*((T(k)).^2)/2) + (a4.*((T(k)).^3)/3) + (a5*((T(k)).^4)/4) + a7);%formula to calculate the S

        H(k) = R*T(k).*(a1 + (a2.*T(k)/2) + (a3.*((T(k)).^2)/3) + (a4.*((T(k)).^3)/4) + (a5*((T(k)).^4)/5) + a6./T(k));%formula to calculate the H


        %Calculation of Cp, S and H for low temperature coefficients
    else


        Cp(k) = R*(a8 + (a9*T(k)) + (a10*T(k).^2) + (a11*T(k).^3) + (a12.*(T(k)).^4));%formula to calculate the Cp

        S(k) = R*(a8.*log(T(k)) + (a9.*T(k)) + (a10.*((T(k)).^2)/2) + (a11.*((T(k)).^3)/3) + (a12*((T(k)).^4)/4) + a14);%formula to calculate the S

        H(k) = R*T(k).*(a8 + (a9.*T(k)/2) + (a10.*((T(k)).^2)/3) + (a11.*((T(k)).^3)/4) + (a12*((T(k)).^4)/5) + a13./T(k));%formula to calculate the H
    end  %Ending of if-else condition

end      %Ending of for loop
end %Ending of the function- Stepwise explanation
- Since the function is to let us calculate the specific heat, entropy and enthalpy, firstly we define the function by specifying the inputs that the function takes and the output variables in which the results will be stored.
- Now we have to start comparing temperature values to the local medium temperature.As the input variable T is an array, we create a for loop which let us achieve the comparison for each value of T.
- Then we calculate specific heat, entropy and enthalpy for high temperature coefficients by creating a condition using if-condition.
- we calculate specific heat, entropy and enthalpy for low temperature coefficients using else-condition.
- And finally, we close the if-else condition, end the for loop and the function.
2. Molecular_Weight
% Function to calculate the molecular weight

function M_W = Molecular_Weight(Species_name)%Defining the function

 %Definition of  atomic name
 atomic_name = ['H','C','O','N','A'];%Here are atomic n  amses representing respectively Hydrogen,Carbon,Oxygen,Nitrogen,Argon

 %Let'sdefine the atomic masses of the previous species
 atomic_weight = [1.008 12.011 15.999 14.007 39.948];

 M_W = 0 ; %Defining the starting range of molecular weight

 for i=1:length(Species_name)%This for loop will run along the length of the species name
     for k = 1:length(atomic_name)%This loop will run to the length of the atomic name
         if strcmp(Species_name(i),atomic_name(k))%Comparison of two strings
             M_W = M_W + atomic_weight(k);
             position = k;
         end
     end
     n = str2num(Species_name(i)); %We have to figure out wether ther is more elements in the species name; if so then we will increment the atomic weight for that particular species

     if n > 1
         M_W = M_W + atomic_weight(position)*(n-1);
     end
 end

 fprintf('Molecular Weight of %s: ',Species_name);
 fprintf('%f',M_W);
 disp(' ')


end- Stepwise explanation
- Specification of inputs and outputs of the function.
- Definition of the atomic names of atoms comprises in all the present species.
- We now specify the atomic weight
- Setting the initial value for molecular weight
- After we create a for loop which length is equal to the number of species name.
- We create a second for loop of which runs along the length of the atomic name
- Comparison of two strings using “stscmp” command for each atom position .
- Now we convert the corresponding string to each species name into number.
- After we create if-condition to verify if the previous number is greater than one; if so then the molecular weight is incremented.
- Then we print molecular weight using “fprintf” command.
- End of the function.
- Main program
clear all
close all
clc

%Input

R = 8.314; %Gas constant

%Data file openning and reading
f1 = fopen('THERMO.dat','r')
get_data = fgetl(f1);

%Temperature reading from THERMO file
global_temp_data = fgetl(f1);


 %The following Commands enable us to skip the comment lines in the data
 %file
 for i =1:3
     get_data = fgetl(f1);
 end


 %Let's open a file which will contain the molecular weight of each
 %species
M_W_file = fopen('Molecular Weight.txt','W');%This is to open the file

%The commands below let us read the species in the data file
%All the commands are grouped within a for loop since each of the command
%has to be executed 53 times which is the number of the species in our
%study file.
 for i = 1:53
     get_data = fgetl(f1);
     A = strsplit(get_data,' ');
     Species_name = (A{1})

%Determination and reading of local temperatures

local_low_temp = str2num(A{end-3});
local_high_temp = str2num(A{end-2});
local_medium_temp = str2num(A{end-1});

 %Definition of the temperature range
  T = linspace(local_low_temp,local_high_temp,1000);

 tline1 = fgetl(f1); %This is to get the first line
 a = strfind(tline1,'E');%This is to find the location of the string E

 %The following commands are to find the First 7 higher and Second 7 lower
 %coerfficients
 %Determination of Higher coefficients

 a1 = tline1(1:a(1)+3);
 a1 = str2num(a1);
 a2 = tline1(a(1)+4:a(2)+3);
 a2 = str2num(a2);
 a3 = tline1(a(2)+4:a(3)+3);
 a3 = str2num(a3);
 a4 = tline1(a(3)+4:a(4)+3);
 a4 = str2num(a4);
 a5 = tline1(a(4)+4:a(5)+3);
 a5 = str2num(a5);

 tline2 = fgetl(f1);%This is to get the second line
 b = strfind(tline2,'E');%This is to find the location of the string E
 a6 = tline2(1:b(1)+3);
 a6 = str2num(a6);
 a7 = tline2(b(1)+4:b(2)+3);
 a7 = str2num(a7);

 %Now the following commands are for finding the Second 7 lower
 %coefficients
 %Determination of Lower coefficients

 a8 = tline2(b(2)+4:b(3)+3);
 a8 = str2num(a8);
 a9 = tline2(b(3)+4:b(4)+3);
 a9 = str2num(a9);
a10 = tline2(b(4)+4:b(5)+3);
a10 = str2num(a10);

 tline3 = fgetl(f1);%This is to get the second line
 c = strfind(tline3,'E');%This is to find the location of the string E
 a11 = tline3(1:c(1)+3);
 a11 = str2num(a11);
 a12 = tline3(c(1)+4:c(2)+3);
 a12 = str2num(a12);
 a13 = tline3(c(2)+4:c(3)+3);
 a13 = str2num(a13);
 a14 = tline3(c(3)+4:c(4)+3);
 a14 = str2num(a14);

 %Calculation of different elements
 %Specific heat, Entropy,Enthalpy,Moleculsr weight
 %Specific Heat, Entropy,Enthalpy
 [Cp S H] = subfunc(a1,a2,a3,a4,a5,a6,a7,a8,a9,a10,a11,a12,a13,a14,T,R,local_medium_temp);%Calling of subfunc function

 %Calculation of the Molecular Weight
 M_W = Molecular_Weight(Species_name);%Calling of Molecular_Weight function

  %Through the following commands let's write the molecular weight file
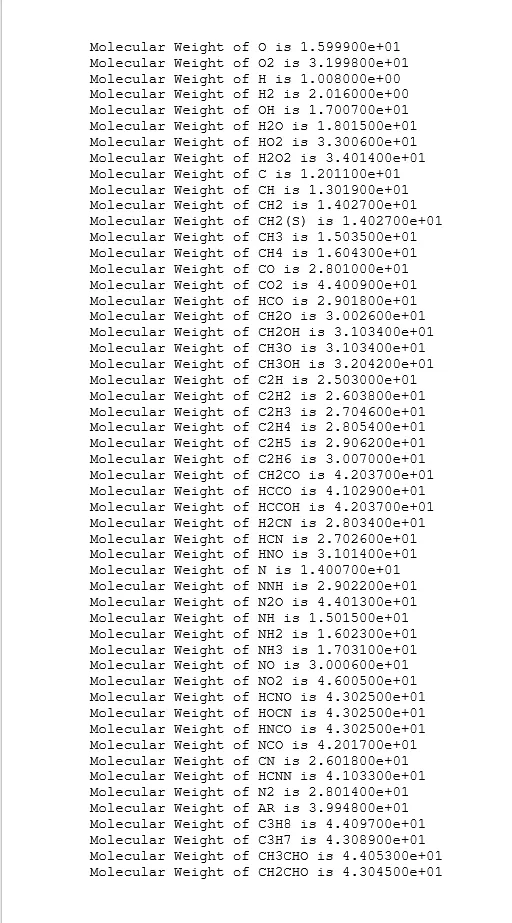
  fprintf(M_W_file,'Molecular Weight of %s is %d n',Species_name,M_W);

  %Plotting Cp,H,S vs T
  %Let's create the folder where the plots will be saved

  cd 'D:/OneDrive/Documents/MATLAB/temp_program/NASA/SPECIES'
  mkdir(Species_name);
  cd(Species_name);

  %plot of Cp vs T
 figure(1)
plot(T,Cp,'linewidth',3,'color','r');
xlabel('Temperature(K)');
ylabel('Specific Heat(KJ)');
title(sprintf('Specific Heat Vs Temperature range of %s',Species_name));
saveas(figure(1),'Specific Heat.jpg');


%plot of S vs T
 figure(2)
plot(T,S,'linewidth',3,'color','b');
xlabel('Temperature(K)');
ylabel('Entropy(KJ/mol-K)');
title(sprintf('Entropy Vs Temperature range of %s',Species_name));
saveas(figure(2),'Entropy.jpg');

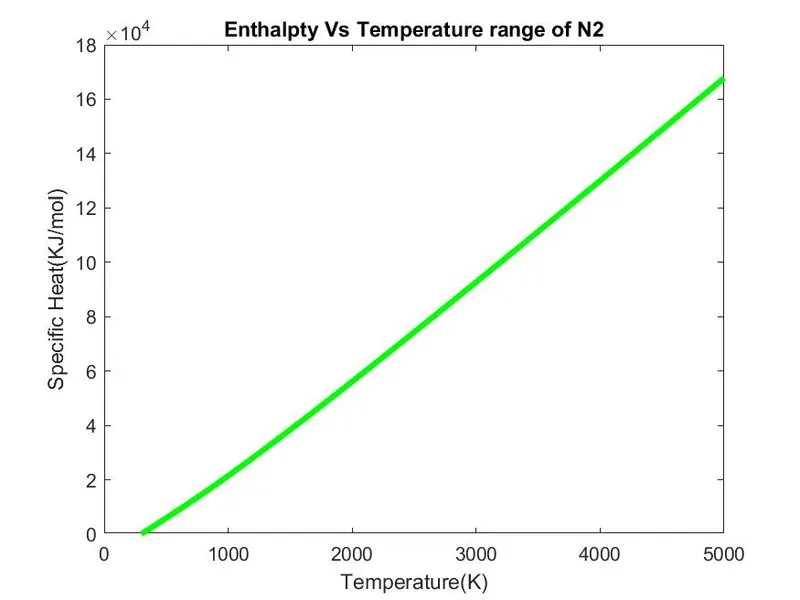
%plot of H vs T
 figure(3)
plot(T,H,'linewidth',3,'color','g');
xlabel('Temperature(K)');
ylabel('Specific Heat(KJ/mol)');
title(sprintf('Enthalpty Vs Temperature range of %s',Species_name));
saveas(figure(3),'Enthalpy.jpg');

cd 'D:/OneDrive/Documents/MATLAB/temp_program/NASA/SPECIES'


 end
fclose(M_W_file); %This is to close the file- Stepwise explanation
- We started the main program by freeing the memory using ‘clear all’, ‘close all’ and ‘clc’ commands.
- Declaration of inputs: universal gas constant and THERMO.dat file.
- Opening and reading of the THERMO.dat file using ‘fopen’ command and by passing the reading permission.
- We read the first two lines of the file using ‘fgetl’ command.
- From the line 19 to 21 we used a for loop to skip the three comment lines in the file.
- On the line 26 we open a new file named Molecular Weight which will further store the values of molecular weight for each species.
- We create a for loop on line 32 which runs 53 times
- From line 33 to 41 we read the next line of THERMO.dat file, we split the string data inside using ‘strsplit’ command and ‘str2num’ command to convert them into numbers in order to get the values of the local temperatures (low,high and medium temperatures)
- On the line 44 we defined the temperature range using ‘linspace’ command
- The commands block from line 46 to line 91 deals with the extraction of the 14 coefficients. In this block, the main commands used are ‘fgetl’, ‘str2num’ and a new command that is ‘strfind’ used to get a specific string character here.
- Line 92 to 96 are about calling the “subfunc” function which calculates the specific heat, entropy and enthalpy.
- Line 97 to 99 are about the calling of “Molecular_Weight” function which let us calculate the molecular weight for each species.
- On the line 102 we print the molecular weight in the file we opened on line 26 using “fprintf” command.
- Line 107 to 109 are about changing the director, making a new directory using “cd” and “mkdir” commands respectively.
- The command block from line 111 to 134 is about plotting the graphs of Cp vs T, S vs T, and H vs T.
- After we used “cd” command to return to our directory
- End of the for loop started on line 32 followed by the closing of the file we opened on line 26.
OUTPUTS:

PLOTS OF O2:
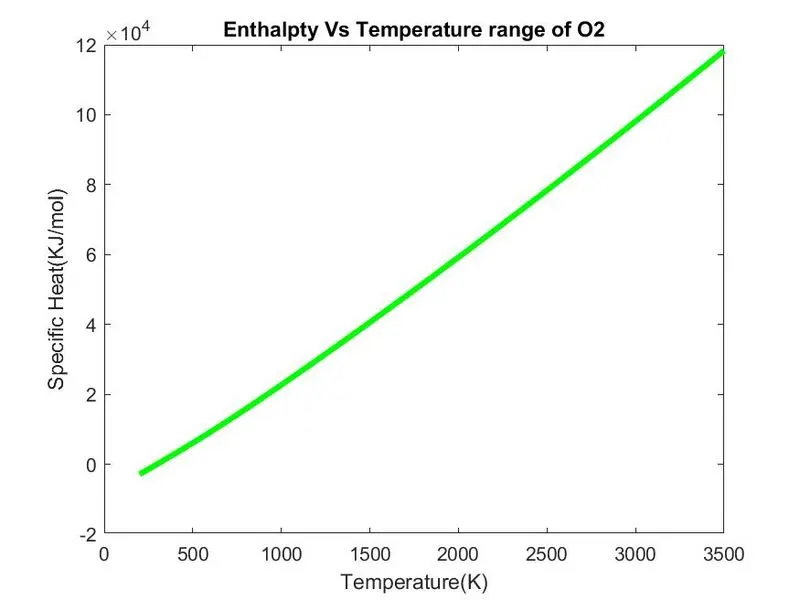
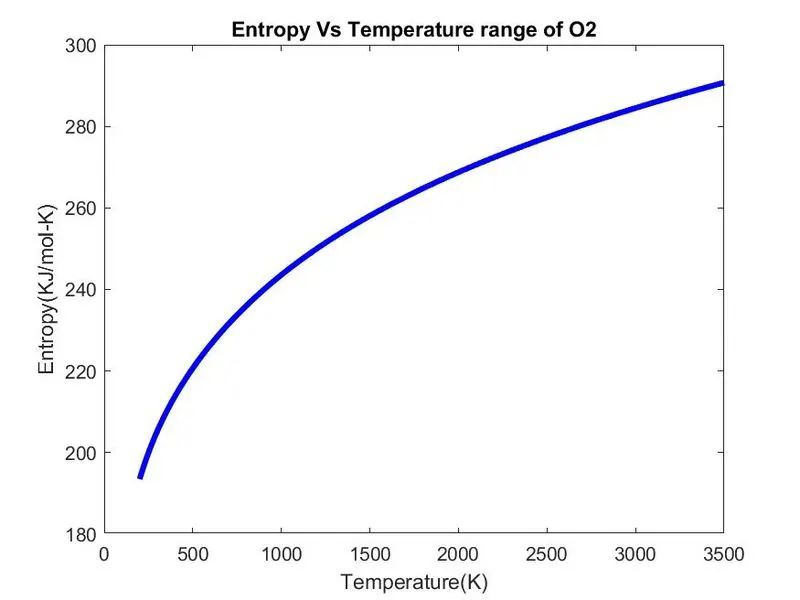
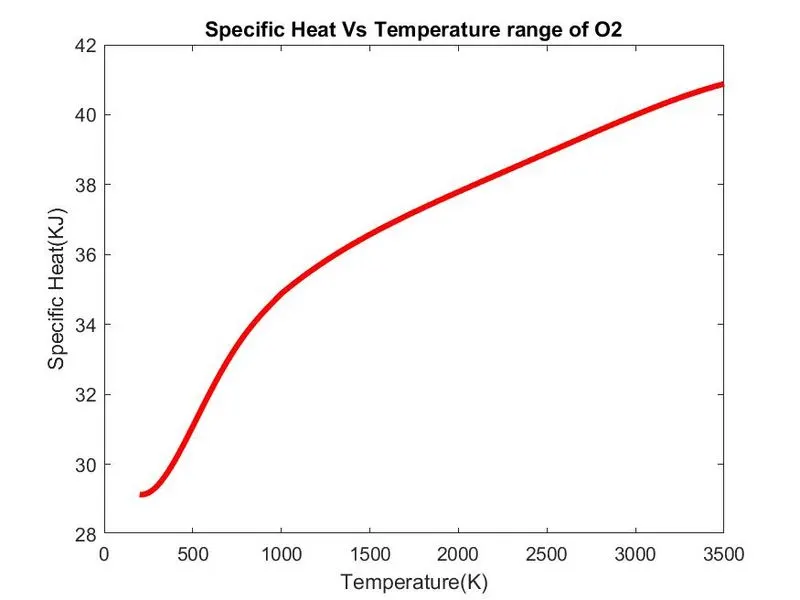
PLOTS OF N2:
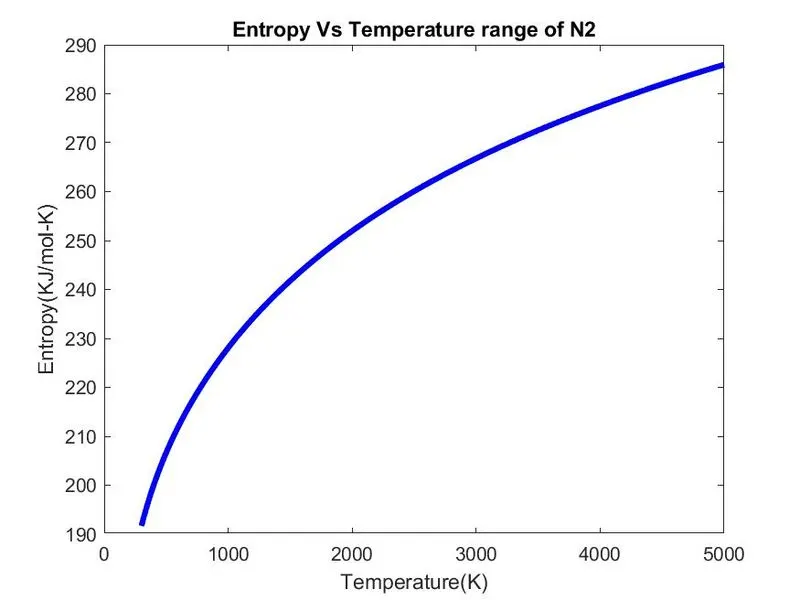
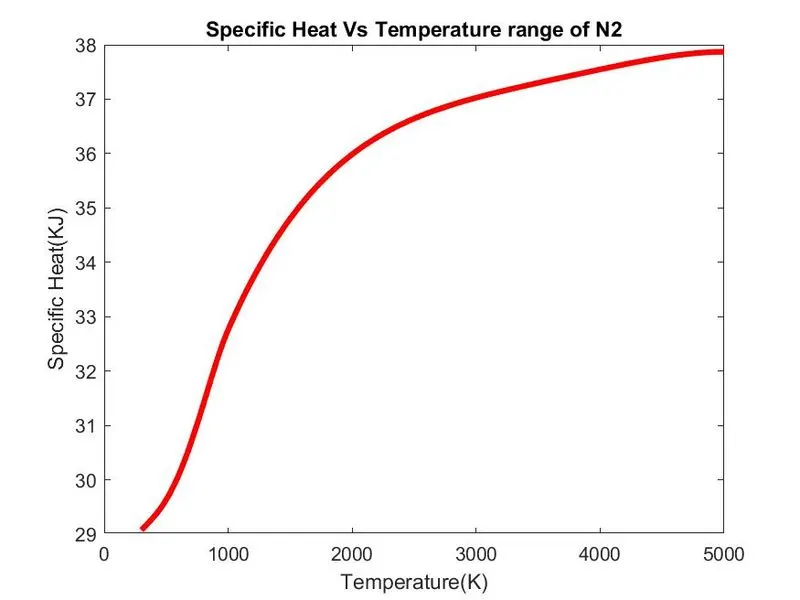
PLOTS OF CO2:
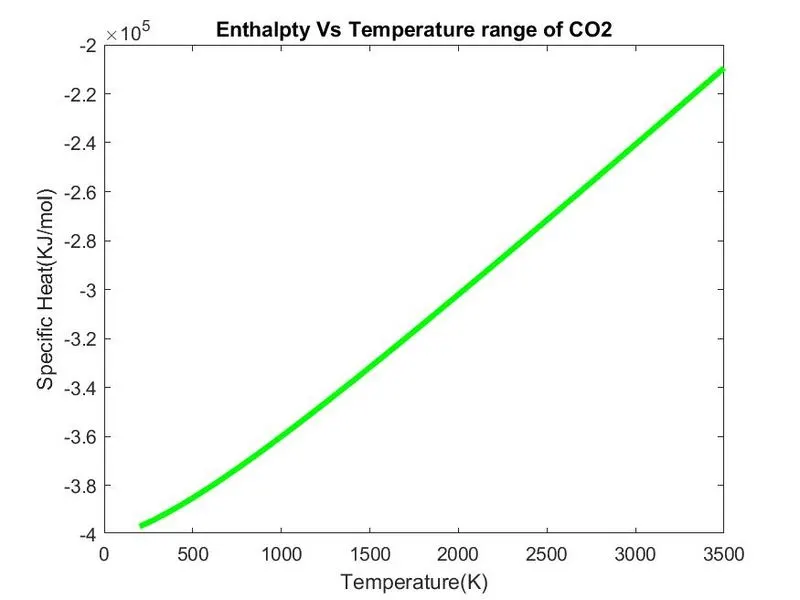
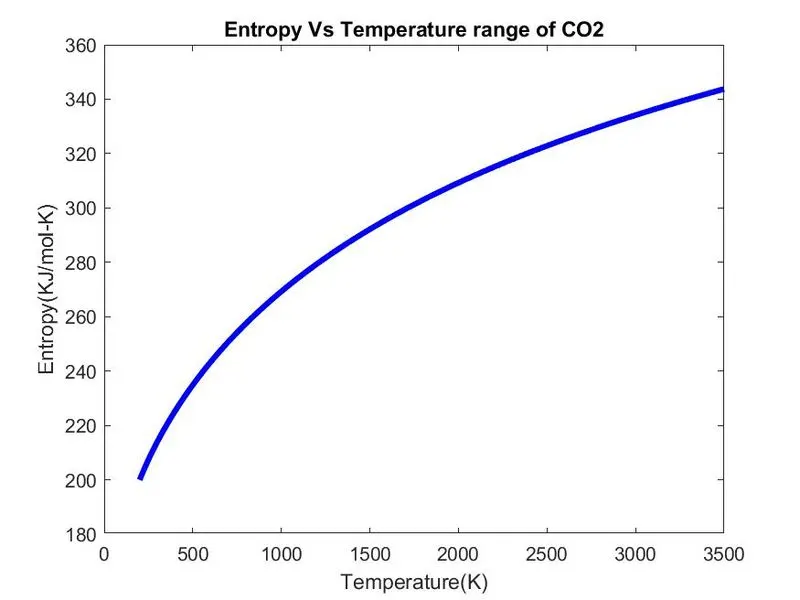
Screenshots of Molecular weight in the command window:
PICRURE OF THE FILE SHOWING THE MOLECULAR WEIGHT OF ALL THE SPECIES
REFERENCES:
- Engineering Thermofluids Book by Dr. Mahmoud Massoud