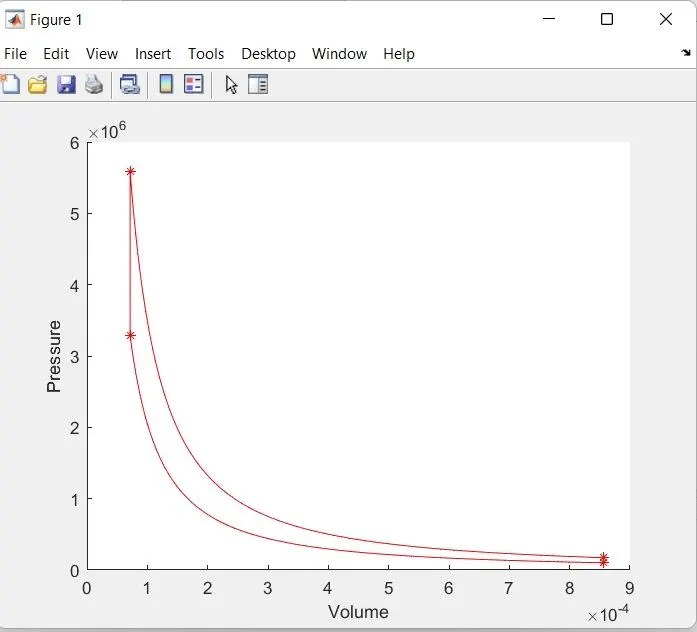
P-V Diagram and the Efficiency of an Otto Cycle
% To Plot a P-V Diagram and find the Efficiency of the Otto Cycle

clear all
close all
clc

%Inputs of Constants
gamma= 1.4;
p1=101325; % Initial Pressure
t1=500;    % Initial Temperature
t3= 2300;  % Maximum Temperature

% Input of Engine parameters
bore= 0.1;
stroke= 0.1;
con_rod= 0.15;
cr= 12;

% Calculating the Swept Volume and the Clearance Volume
v_swept= (pi/4)*bore^2*stroke;
v_clearance= v_swept/(cr-1);
v1= v_swept+v_clearance;
v2= v_clearance;

% Calculate Variables at State point 2
%p1v1^gamma=p2v2^gamma
p2=p1*(cr)^gamma;

%p1v1/t1=p2v2/t2
t2=(p2*v2*t1)/(p1*v1);

% Calculate the Volume and Pressure during Isentropic Compression
% Calling of a Function named engine_kinematics() to Calculate volume
c=p1*v1^gamma;
V_compression= engine_kinematics(bore,stroke,con_rod,cr,180,0);
P_compression= c./V_compression.^gamma;

%Calculate Variables at State point 3
v3=v2;

%p2v2/t2=p3v3/t3 || p3=(p2*t3)/t2
p3=(p2*t3)/t2;

% Calculate the Volume and Pressure during Isentropic Expansion
% Calling of a Function named engine_kinematics() to Calculate volume
c=p3*v3^gamma;
V_expansion= engine_kinematics(bore,stroke,con_rod,cr,0,180);
P_expansion=c./V_expansion.^gamma;

%Calculate Variable at State point 4
v4=v1;
% p3v3^gamma=p4v4^gamma
p4=p3*(v3/v4)^gamma;

% Plotting the P-V Diagram
hold on
plot(v1,p1,'*','color','r');
plot(V_compression,P_compression,'color','r');
plot(v2,p2,'*','color','r');
plot([v2,v3],[p2,p3],'color','r');
plot(v3,p3,'*','color','r');
plot(V_expansion,P_expansion,'color','r');
plot(v4,p4,'*','color','r');
plot([v4,v1],[p4,p1],'color','r');
xlabel('Volume');
ylabel('Pressure');

%Calculatin the Efficiency of the Otto Cycle

x1= (1/cr)^(gamma-1);
eta_otto= 1-x1
Explanation:
Step1: Take the Inputs of the constants such as gamma, temperature at state 3.
step 2: Take Input of the state variable such as pressure and temperature at point 1.
step 3: Take inputs of the engine parameters such as bore, stroke, connecting rod length and compression ratio.
step 4: Calculate the swept volume and the clearance volume.
step5: calculate all the state variable at each point.
step 6: plot on the graph all the state variables at 4 points.
step7: To join all the 4 points on the graph we have to create a function named 'V'.
step 8: In the function we should calculate the value of V for each value of 'theta' and store in the array
step 9 : This function is called in the main code and the graph is plotted
step 10: after plotting the graph, the efficiency is calculated using the formula.
The function [V]
% Create a function to evaluate the Volume Changes inside the chamber
function[V]= engine_kinematics(bore,stroke,con_rod,cr,start_crank,end_crank)

a = stroke/2; % Calculate the crank pin radius
R = con_rod/a; % Calculate the ratio of the con_rod and the crank pin radius
vs = pi/4*bore^2*stroke; % Calculate the swept volume
vc =vs/(cr-1); % Calculate the clearance volume

theta= linspace(start_crank,end_crank,100); % create an array

term1= 0.5*(cr-1);
term2= R+1-cosd(theta);
term3= (R^2-sind(theta).^2).^0.5;

V= (1+term1*(term2-term3)).*vc; % calculate each volume

end
Explanation:
step 1: A Function is created to calculate the value of V and return the value an dstore in the array V
Step 2: for each value of theta the value of V is calculated
Errors:
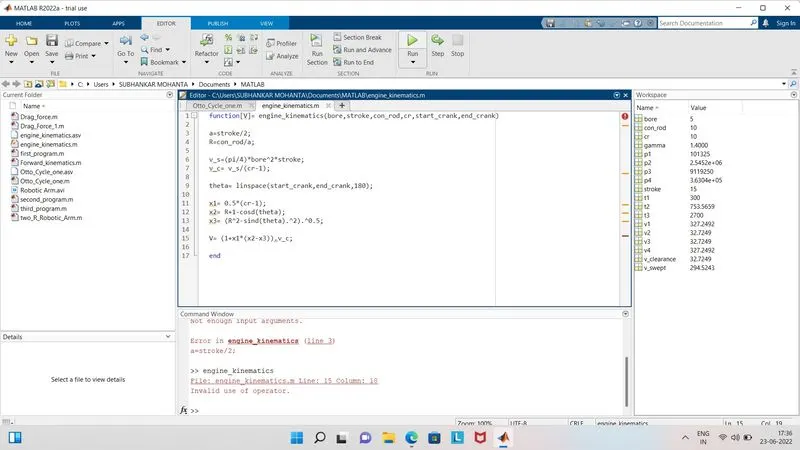
Error: Operator was missing
2.
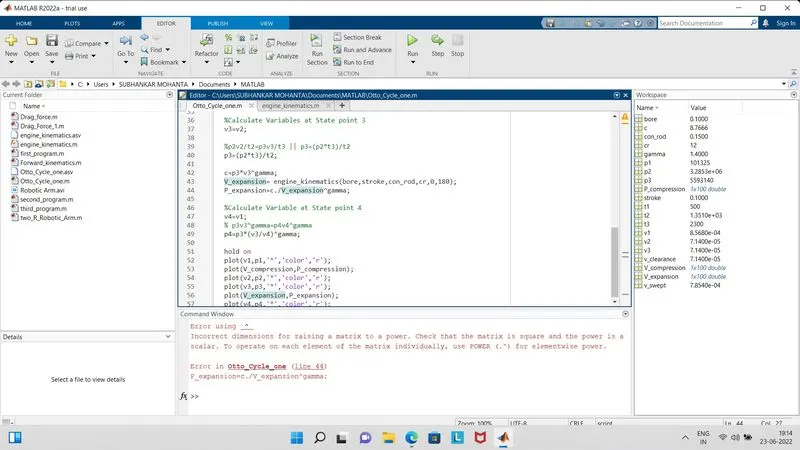
Error: Element wise operatoe was missing
3.
Error: The number of Input paramater in the function was wrong
Outputs:
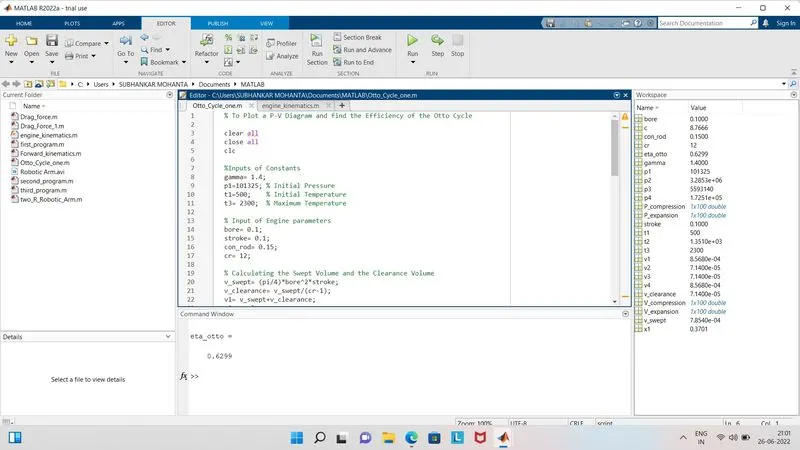
P-V diagram of the otto cylce