Modelling of Battery Pack
OBJECTIVES:
- Build a battery pack with 3S4P configuration
- Simulate the model and comment on the results for SOC, voltage, and current
- Change the configuration to 4S3P and simulate the model
- Compare the results for both models
Battery configuration:
The lithium-ion datasheet used for this project is:
https://www.ineltro.ch/media/downloads/SAAItem/45/45958/36e3e7f3-2049-4adb-a2a7-79c654d92915.pdf
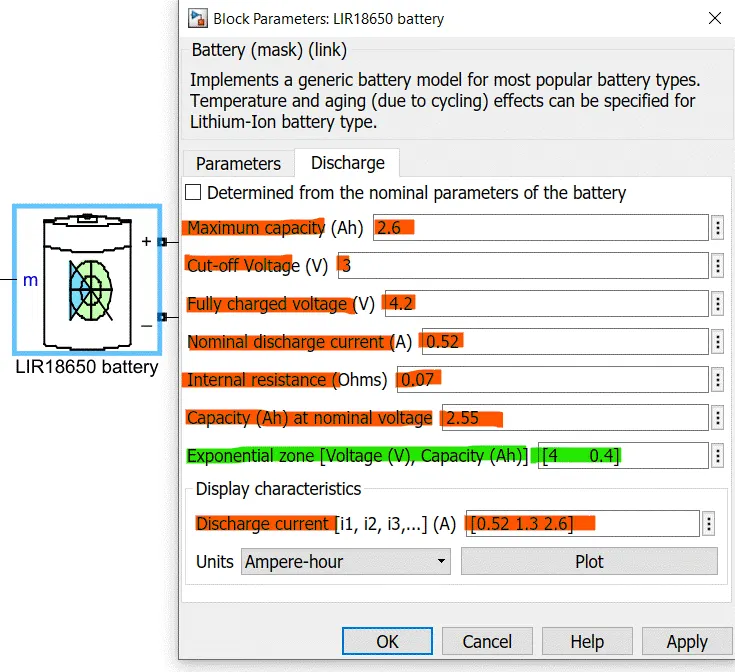
Data used to configure the battery:
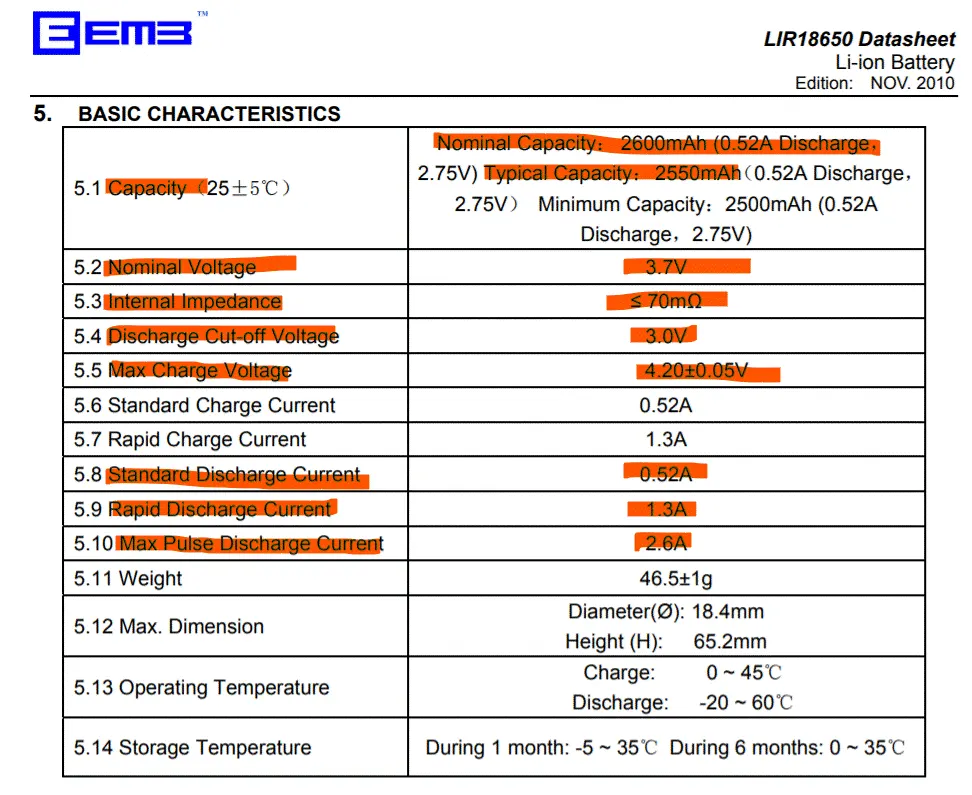
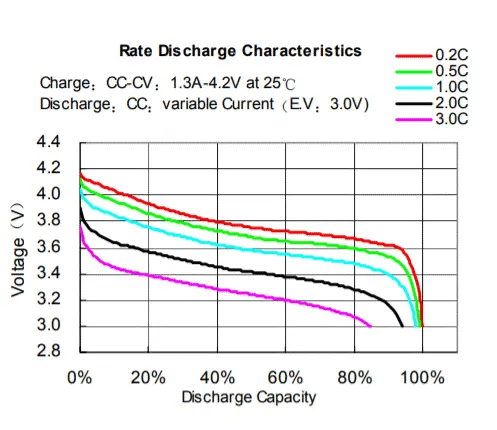
According to the above data, `V_exp` and `Q_exp` can be determined by looking at the discharge characteristic curve:
3S4P SIMULINK MODEL:
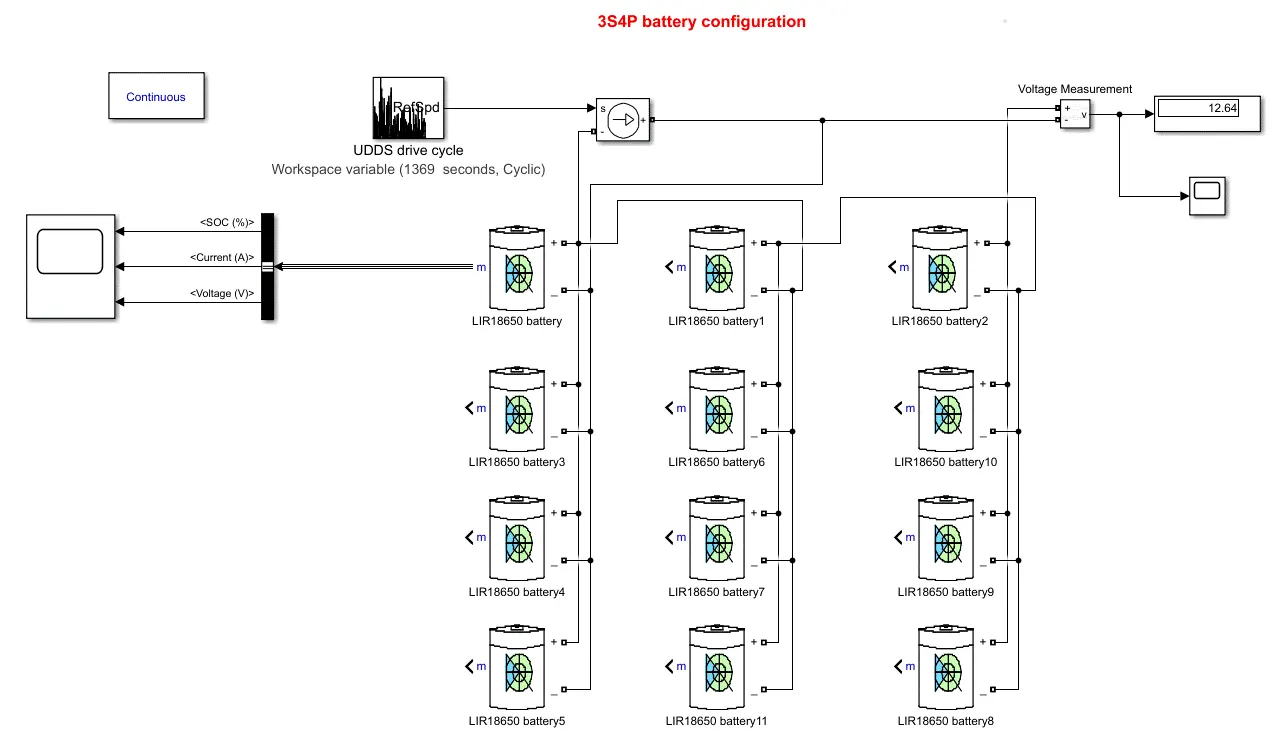
- 3S4P refers to 3-series-4-parallel: as is evident, 3 cells are connected in series (+ve terminal connected to -ve terminal) while the remaining are connected in parallel (+ve terminal connected to +ve and -ve terminal connected to -ve)
- The fully charged voltage of one cell is 4.2V, hence 3 cells connected in series would mean a total voltage of around 12.6V, which is evident from the voltage measurement
- The maximum capacity of each cell is 2.6Ah so 4 cells connected in parallel means a total capacity of 2.6*4 = 10.4Ah
How to ensure that the total pack is providing a capacity of 10.4Ah?
- The battery is configured to discharge a nominal current of 0.52A, which means if the current is assumed to be 0.52A on average, an approximation on how long this battery will last can be estimated.
- 10.4Ah/0.52A = 20 hours, however this is assuming the discharge current is 0.52A throughout, which cannot be the case all the time as the drive cycle requirements demand a higher current at times. Higher current discharge brings in Peukert's effect and the capacity of the battery is reduced.
- So I ran the UDDS drive cycle for 20 hours to find out when the SOC will become 0. Approximation for when SOC would deplete to 0% was around 18 hours.
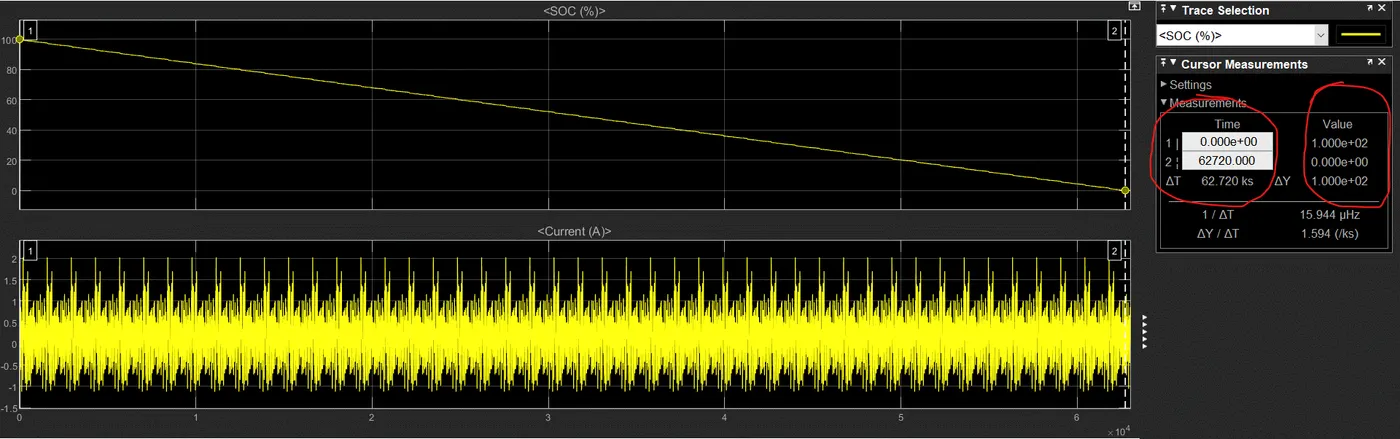
- Evidently, SOC depleted to 0% before 63000 seconds, which is about 17.5 hours. Hence, it can be concluded that this pack was indeed constructed in the correct way to provide a capacity of 10.4Ah
- There might be an easier way to confirm that the cells have been connected correctly to give the expected capacity, but as of now I'm unaware of it.
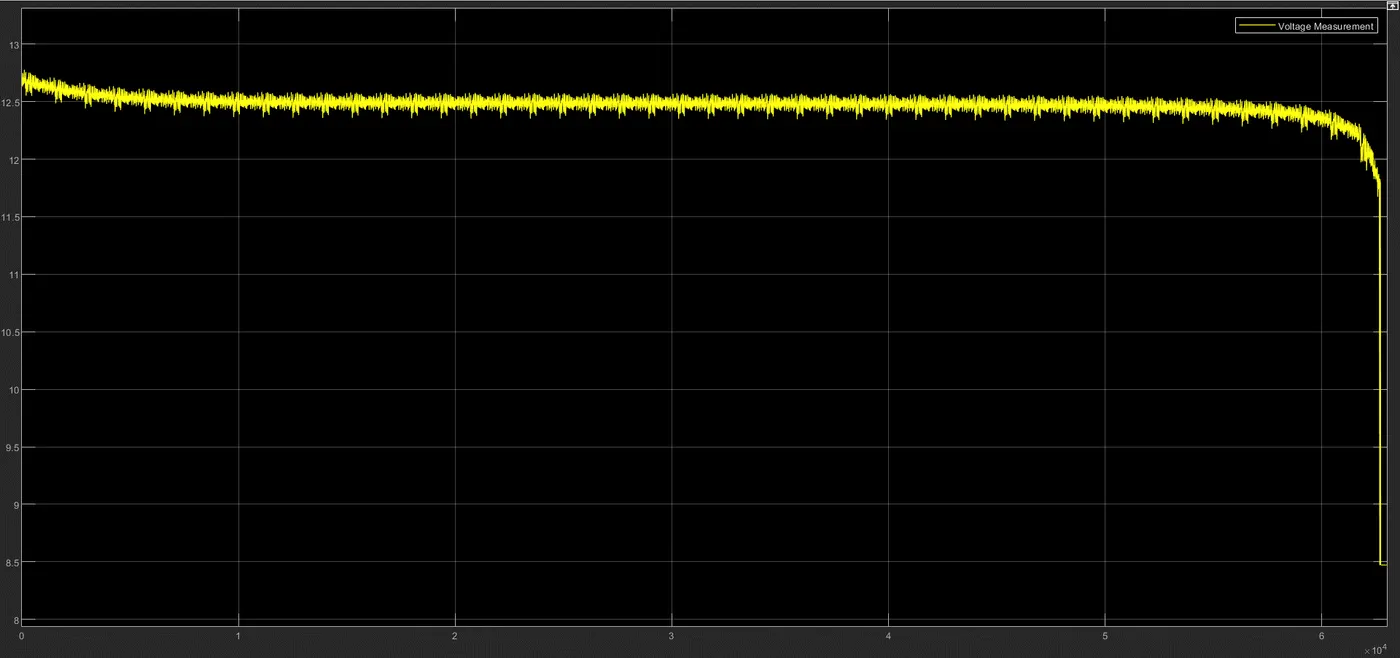
- While the battery completely depletes from 100 to 0%, the voltage levels have gone from 12.6V to about 8.5V
- Note how this voltage discharge curve matches exactly with a Li-ion discharge curve; starting off with an exponential zone, into the nominal linear zone, and then the steep zone, where in the final 5% SOC the voltage has drastically reduced from 12.4V to 8.5V
4S3P SIMULINK MODEL:
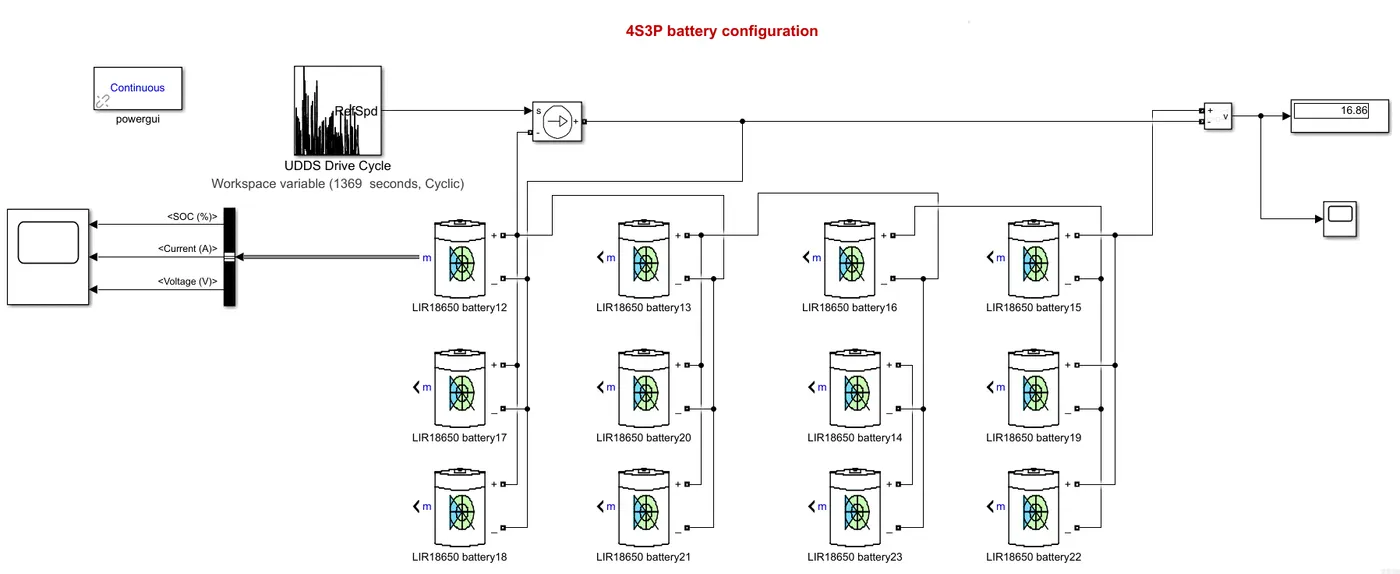
- As opposed to the first model, 4 cells are connected in series and 3 in parallel. Same total number of cells, but arranged differently, giving different voltages and capacities
- The fully charged voltage of one cell is 4.2V, hence 4 cells connected in series would mean a total voltage of around 16.8V, which is evident from the voltage measurement
- The maximum capacity of each cell is 2.6Ah so 3 cells connected in parallel means a total capacity of 2.6*3 = 7.8Ah
Error check:
- To make sure this modeled battery pack is providing a capacity of 7.8Ah, the same procedure was repeated, where this time the UDDS drive cycle was run for 7.8Ah/0.52A = 15 hours to see the change in SOC. Approximation for when SOC would deplete to 0% was around 13 hours.
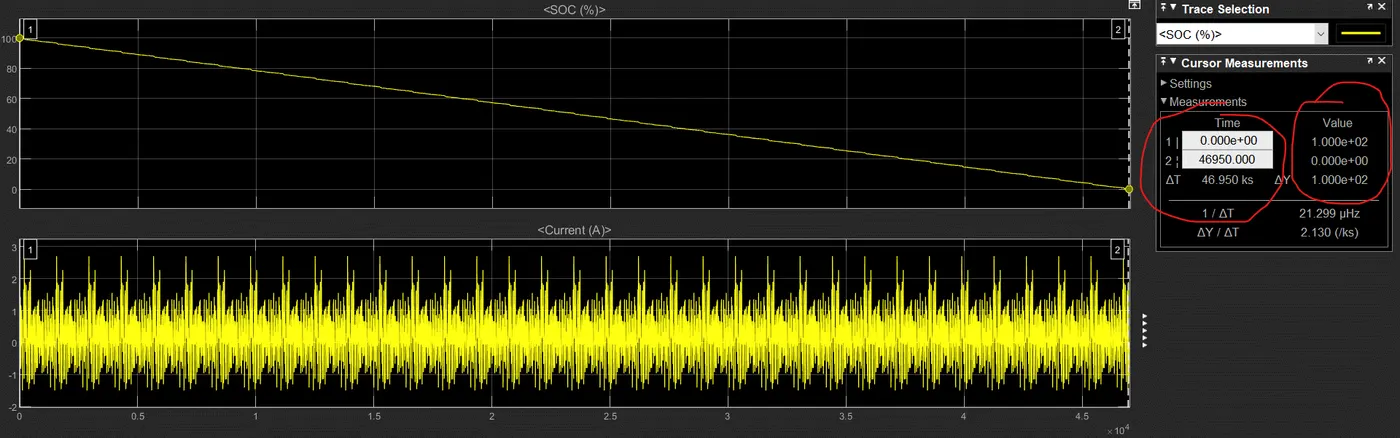
- Evidently, SOC depleted to 0% before 47000 seconds, which is about 13 hours. Hence, it can be concluded that this pack was indeed constructed in the correct way to provide a capacity of 7.8Ah
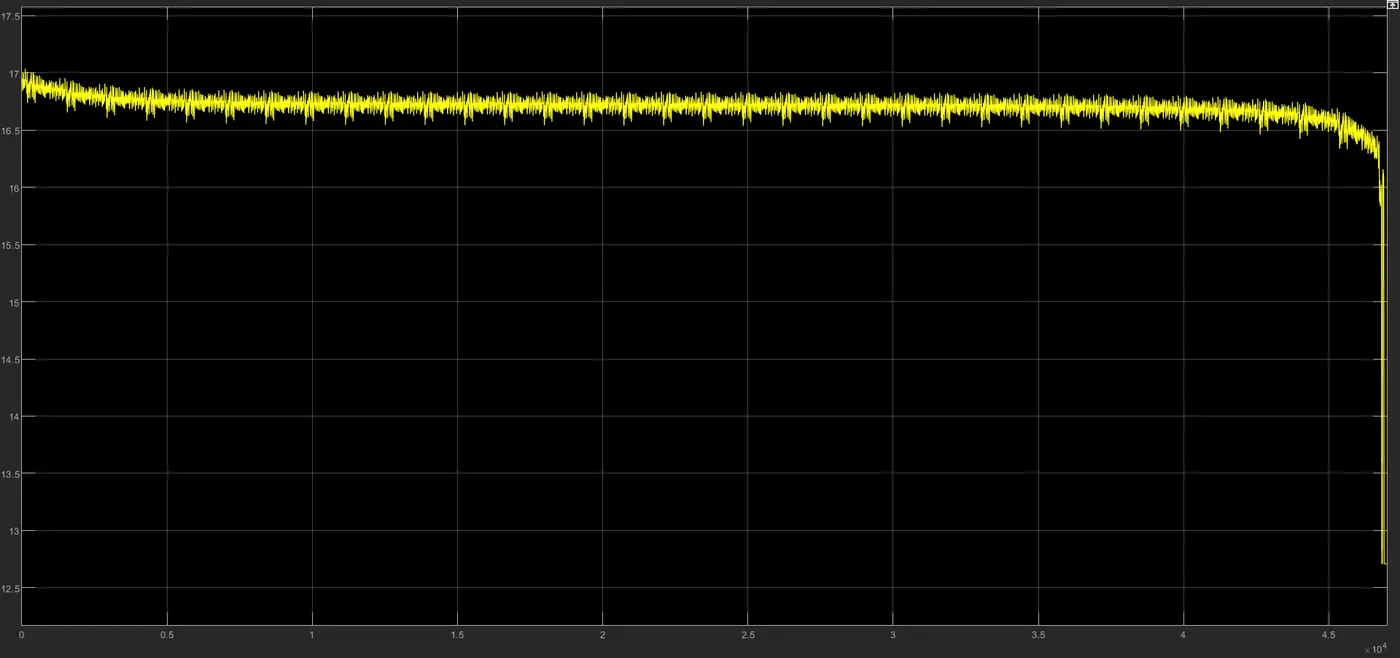
- While the battery completely depletes from 100 to 0%, the voltage levels have gone from 16.8V to about 12.7V
COMPARISON OF BOTH MODELS: 3S4P vs 4S3P
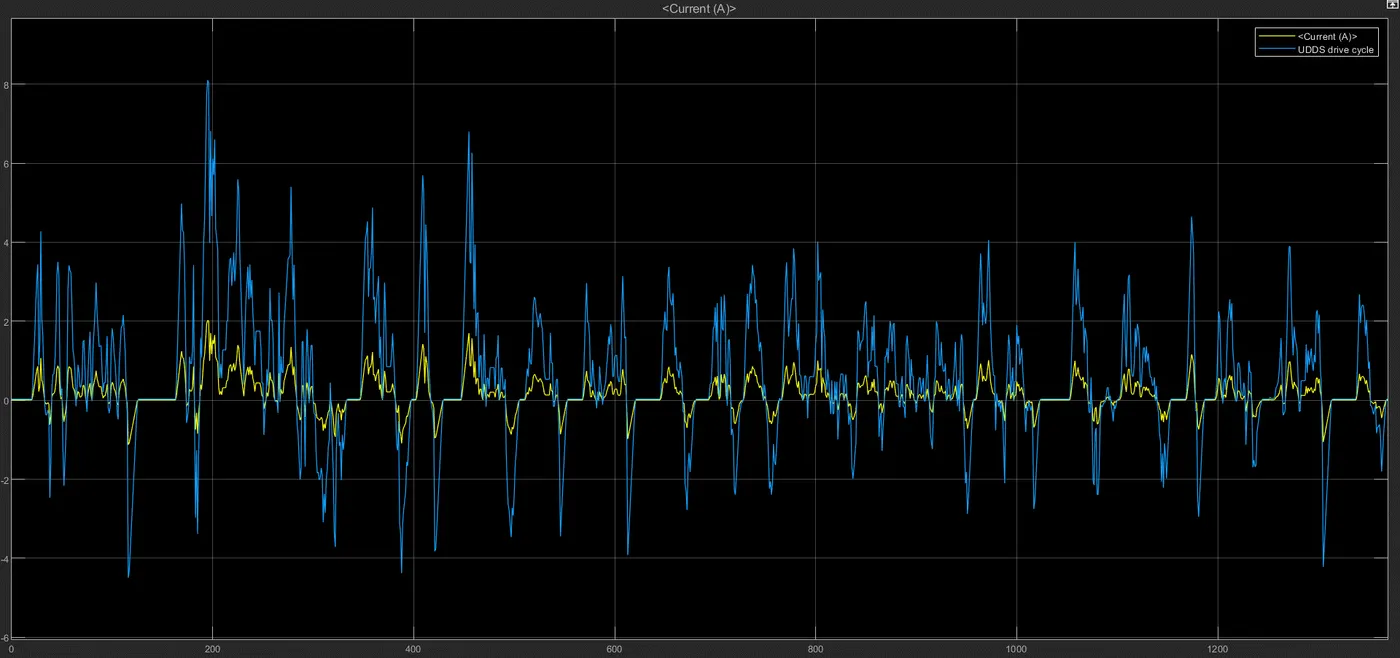
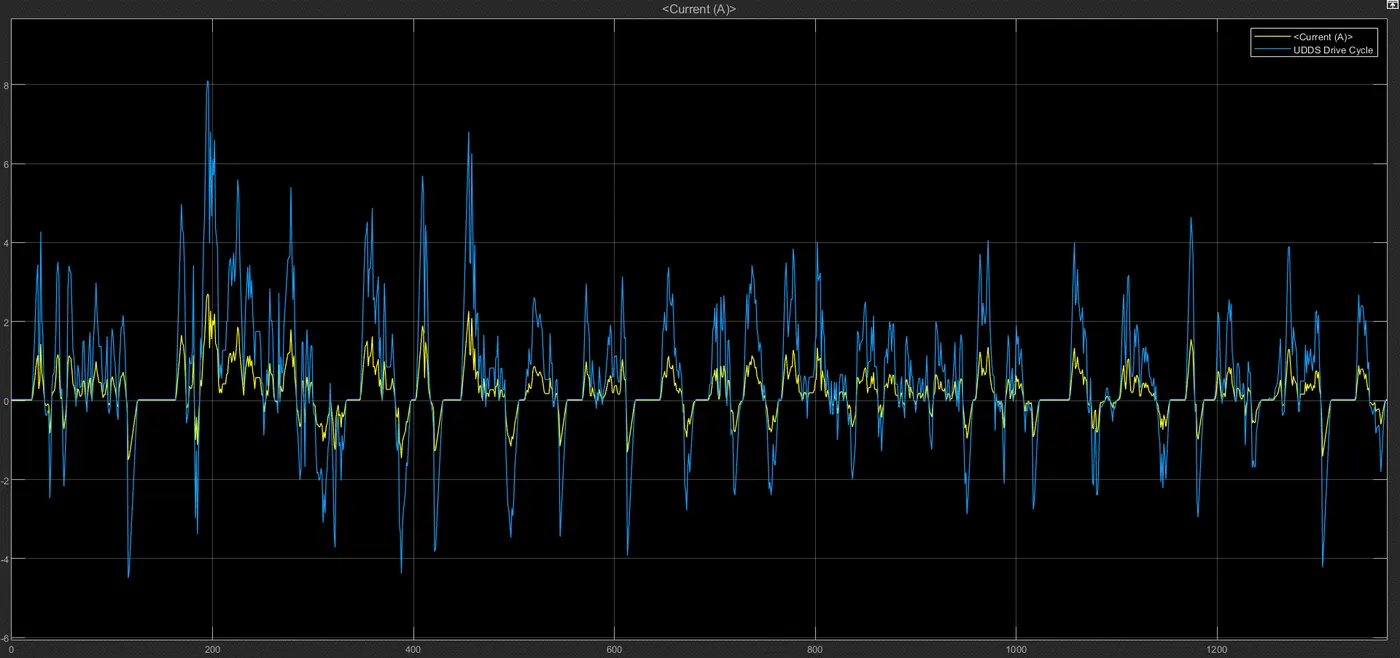
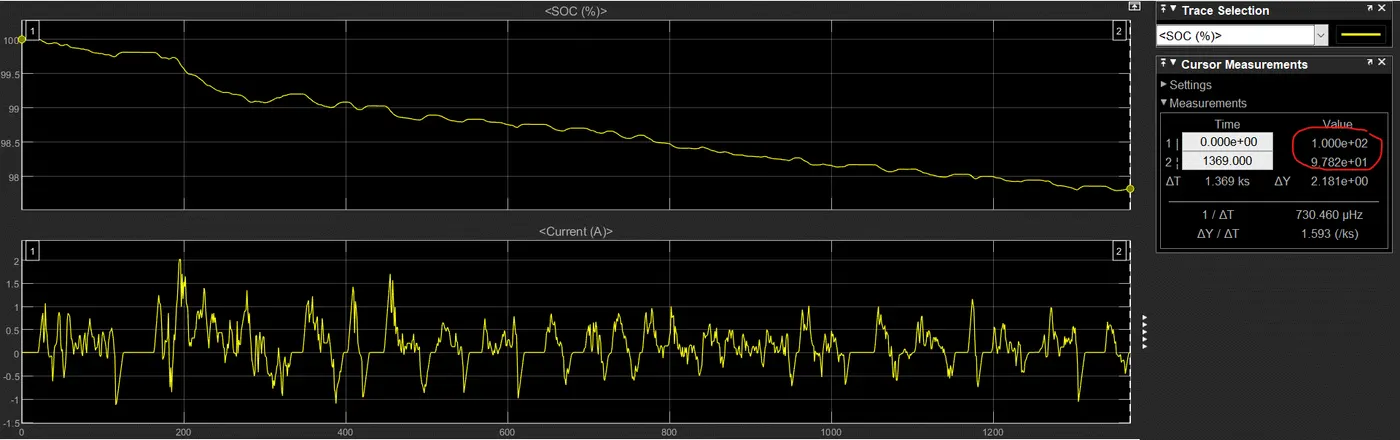
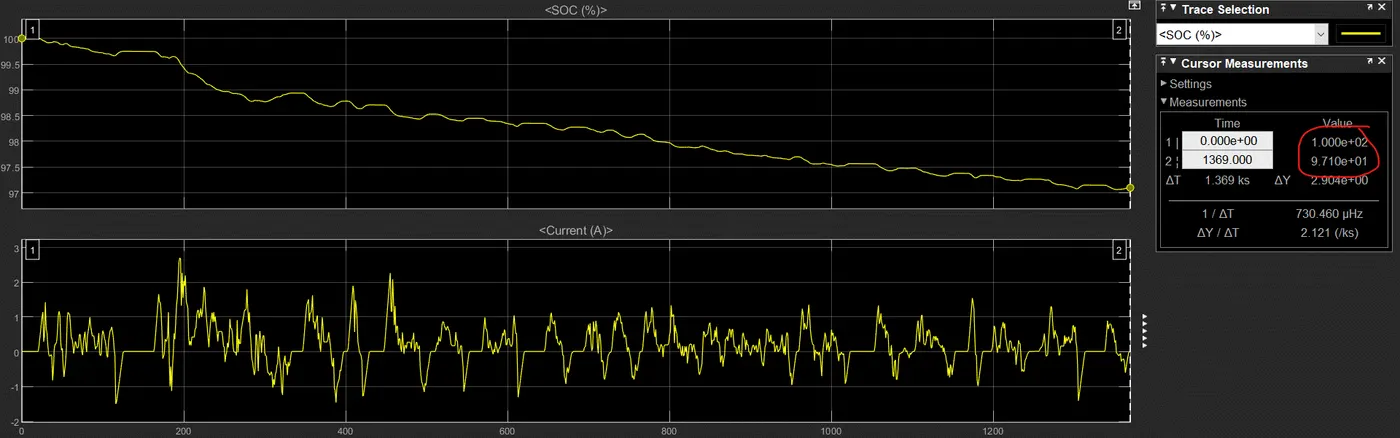
The UDDS drive cycle (current vs time) was run (1369 seconds) for both battery packs:
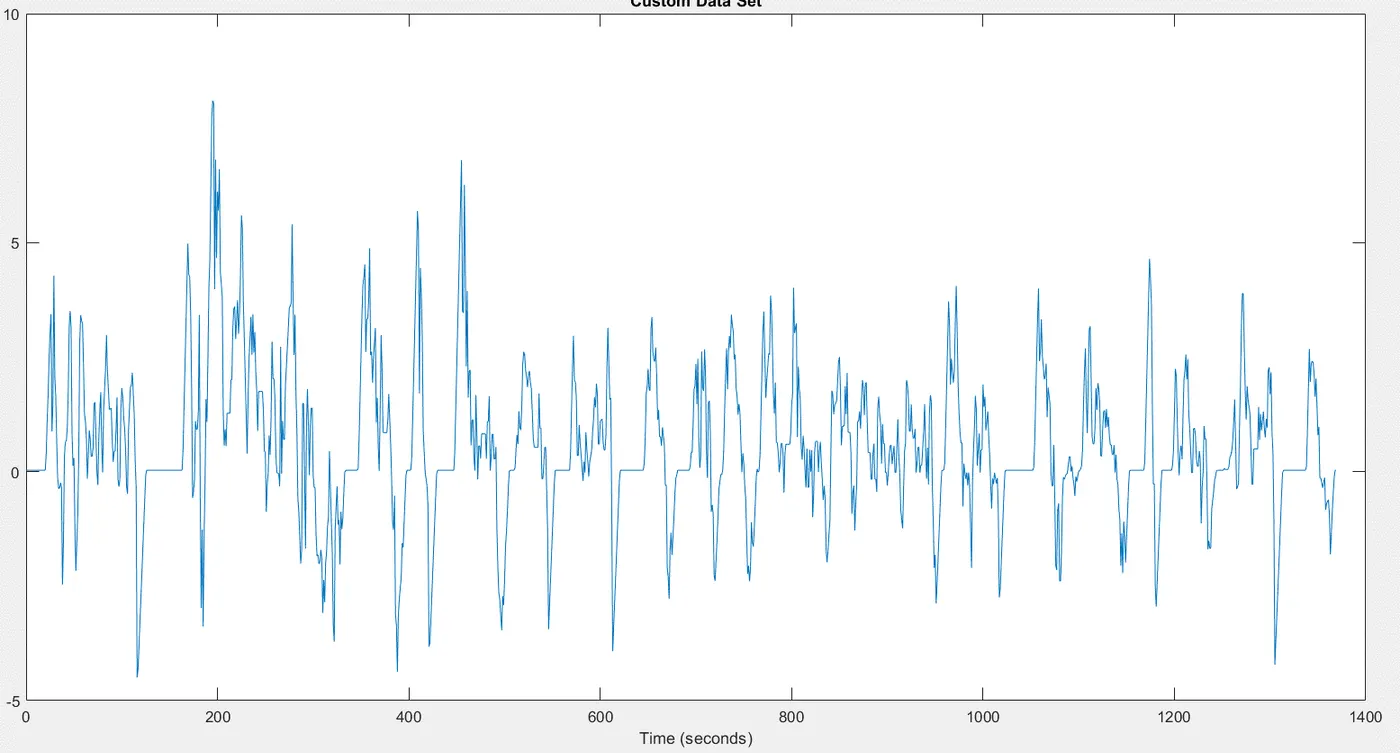
3S4P BATTERY PACK:

4S3P BATTERY PACK:

|
3S4P |
4S3P |
|
|
SOC |
|
|
|
Current |
|
|
|
Voltage |
|
|