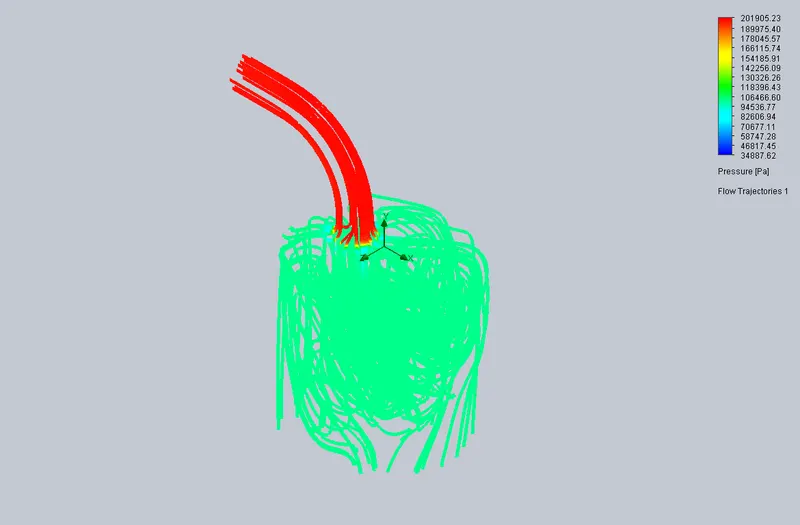
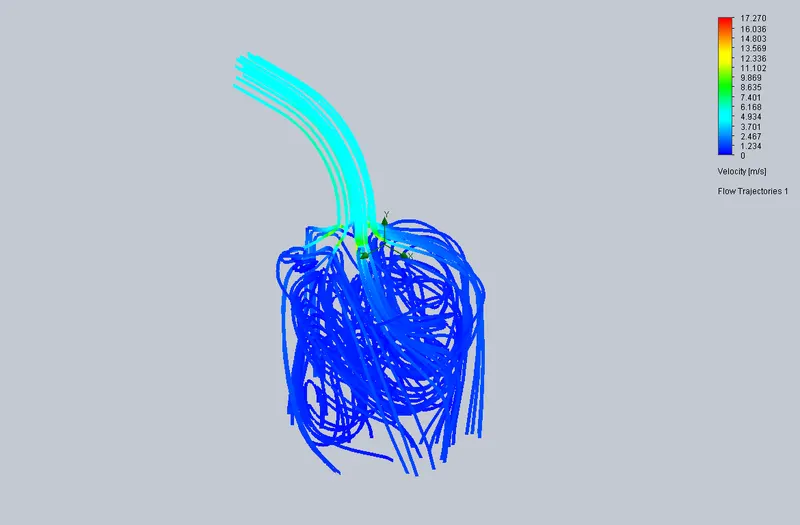
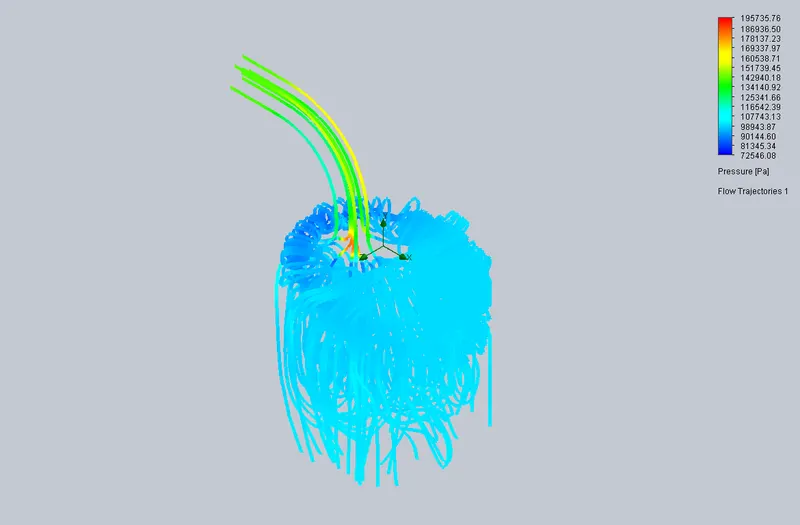
Modelling and simulation of flow through a flowbench
SIMULATION OF FLOW USING A FLOW BENCH - INLET VALVE
Using Solidowrks
AIM: To run and display Flow Analysis(CFD Analysis) and obtain a plot of Valve lift vs Mass Flow Rate using Flow Simulation in Solidworks.
OBJECTIVE:
- To Model an Air Flow Bench using Solidworks
- To run a Baseline Simulation
- To perform Grid Dependency Test using 3 levels of Refinement
- To Run simulation on valve lift parametric study and plot Valve Lift vs Mass Flow Rate
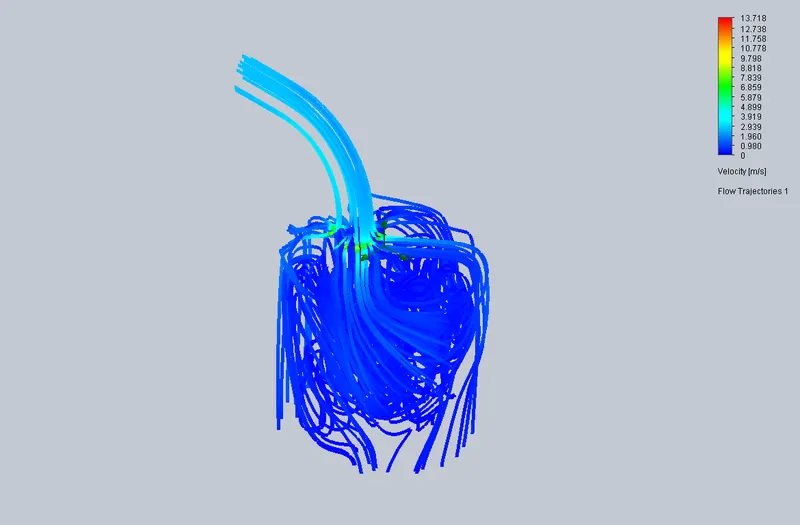
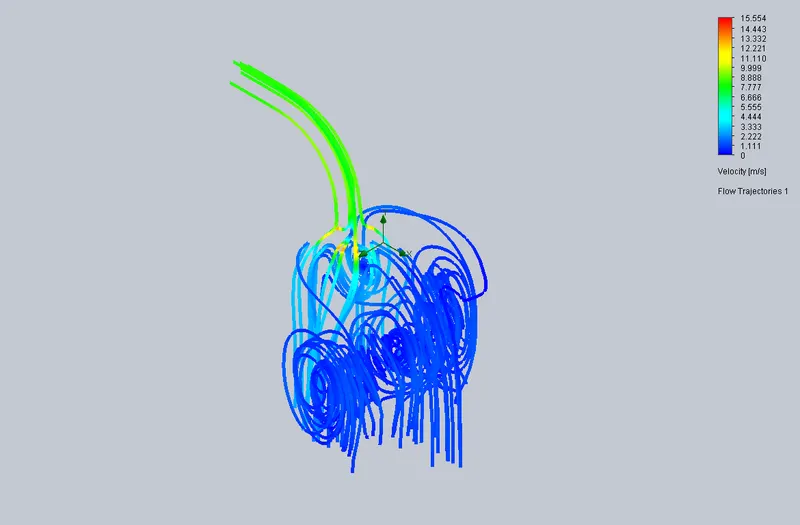
- To display all the simulations of air flow during valve lifts
OVERVIEW:
Air Flow Bench:
An air flow bench is a device used for testing the internal aerodynamic qualities of an engine component and is related to the more familiar wind tunnel. A flow bench consists of an air pump of some sort, a metering element, pressure and temperature measuring instruments such as manometers, and various controls.
It is used primarily for testing the intake and exhaust ports of cylinder heads of IC engines . It is also used to test the flow capabilities of any component such as air filters, carburetors, manifolds or any other part that is required to flow gas. A flow bench is one of the primary tools of high performance engine builders, and porting cylinder heads would be strictly hit or miss without it.
It is a small-scale wind tunnel with an electric fan and adjustable air flow control. It is the essential base unit for eight different experiment modules that demonstrate key principles and phenomena of air flow.
Inlet Valve
The inlet valve is given a lead in opening before the piston reaches top dead center on the exhaust stroke so that least resistance is offered to the incoming flow of air and petrol mixture as the piston begins its induction stroke.
MODEL GEOMETRY:
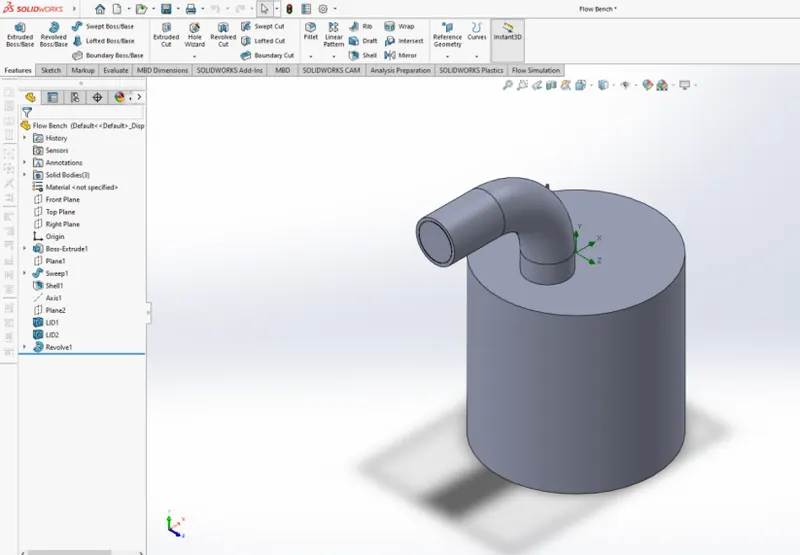
Flow Bench Isometric View (Lids Included)
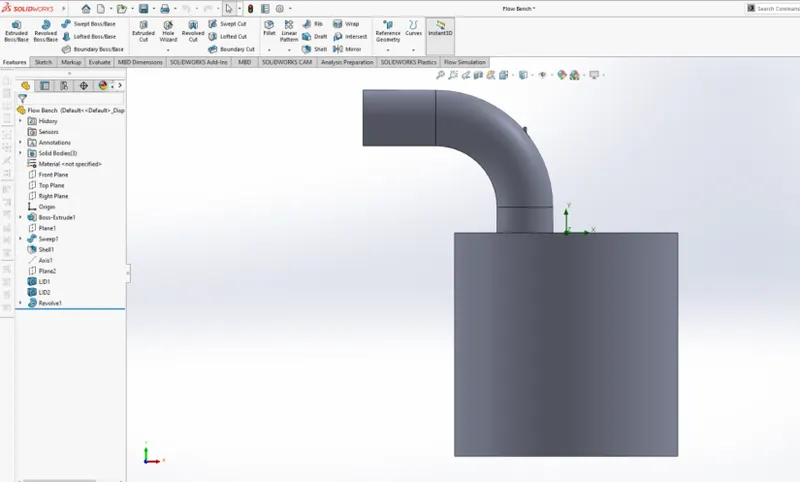
Flow Bench Side View (Lids Included)
------------------------------------------------------------------------------------------------
Flow Bench Geometry (Lids Included)
Cylinder Diameter = 100 mm
Length of Cylinder = 100 mm
Diameter of Valve Inlet = 25 mm
Wall Thickness = 2 mm
-------------------------------------------------------------------------------------------------
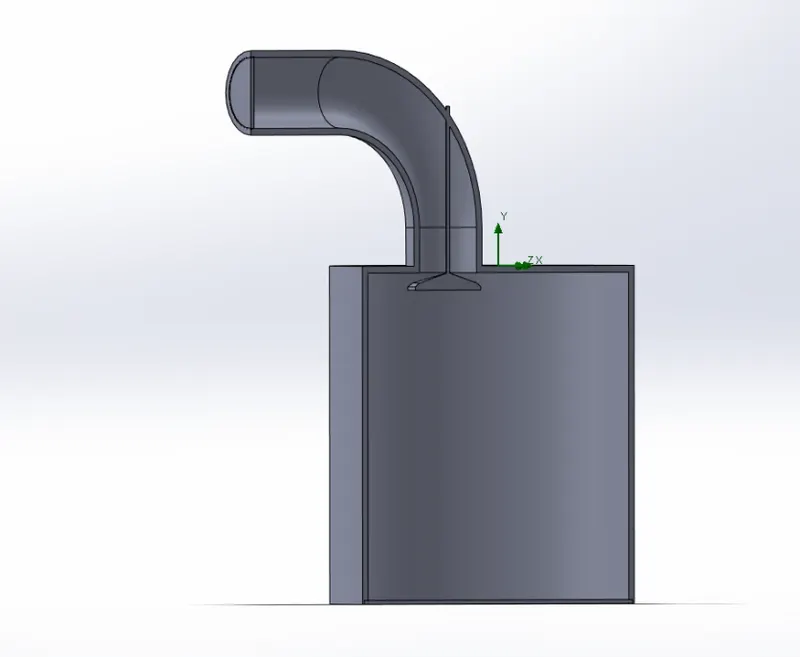
Flow Bench Sectional View - Inlet Valve (Lids Included)
--------------------------------------------------------------------------------------------------------------------------------------
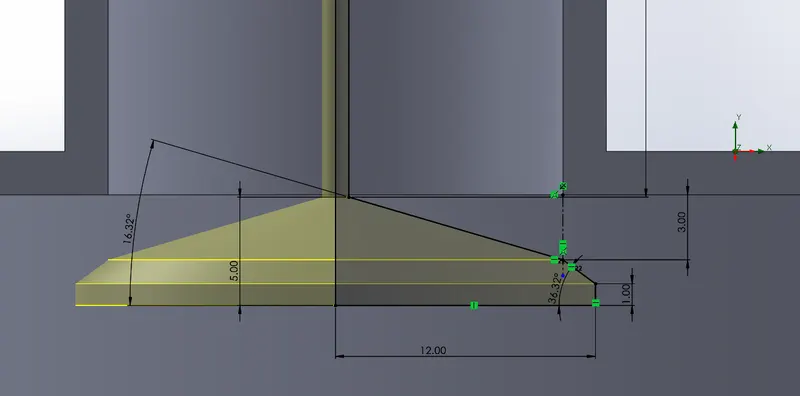
Inlet Valve Geometry
--------------------------------------------------------------------------------------------------------------------------------
PROCEDURE:
1. To Run A Baseline Simulation
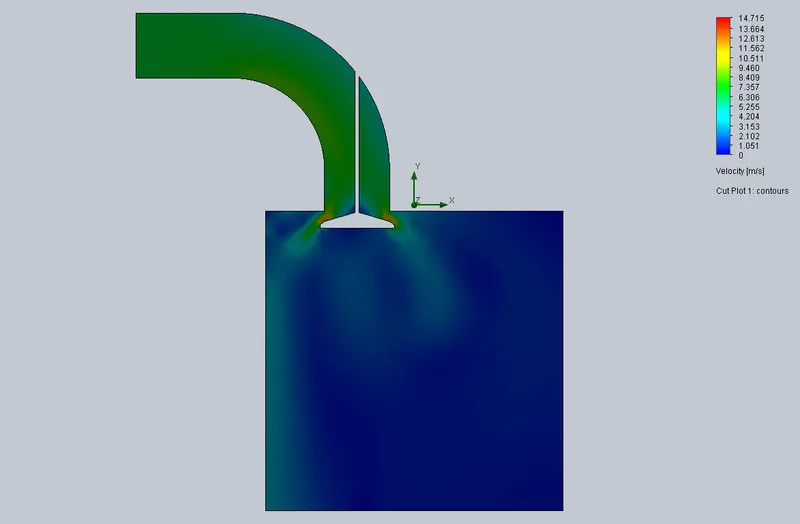
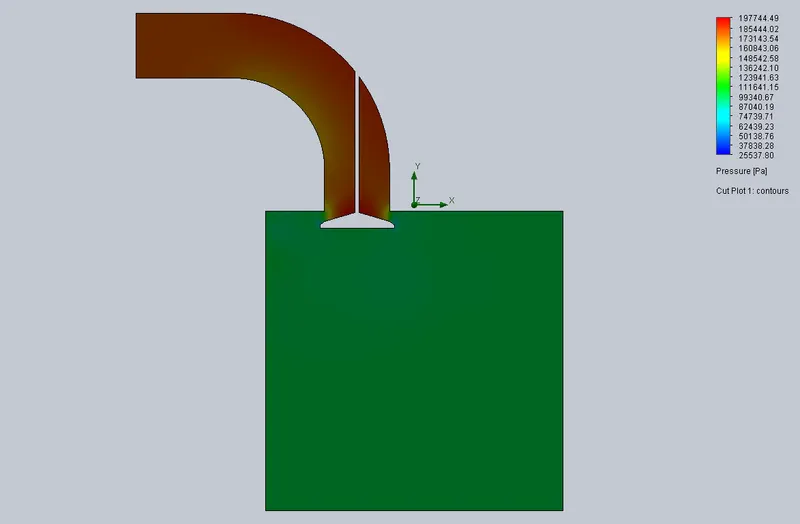
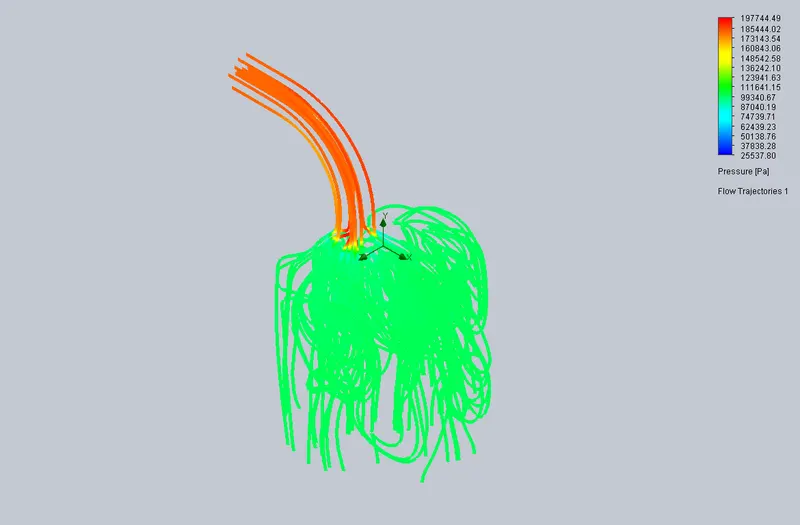
Boundary Conditions:
- Total Pressure (Inlet) = 202650 Pa
- Static Pressure (Outlet) = 101325 Pa
- Global Mesh Variable = 5
- Valve Lift = 3mm
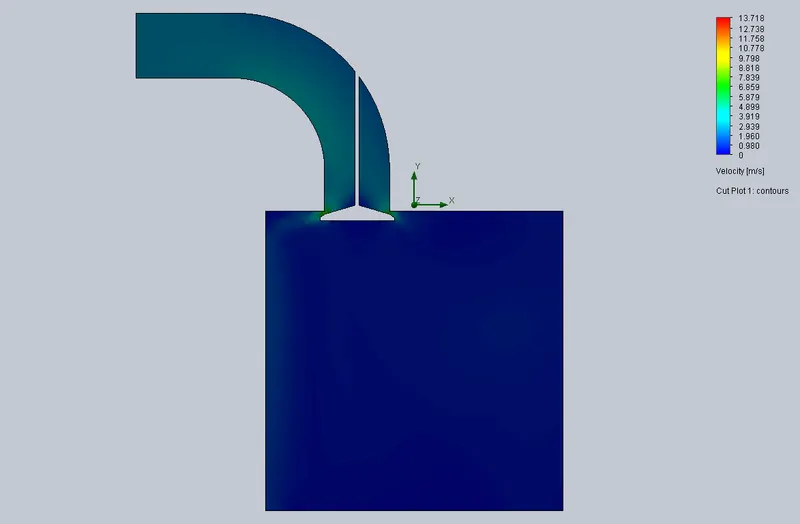
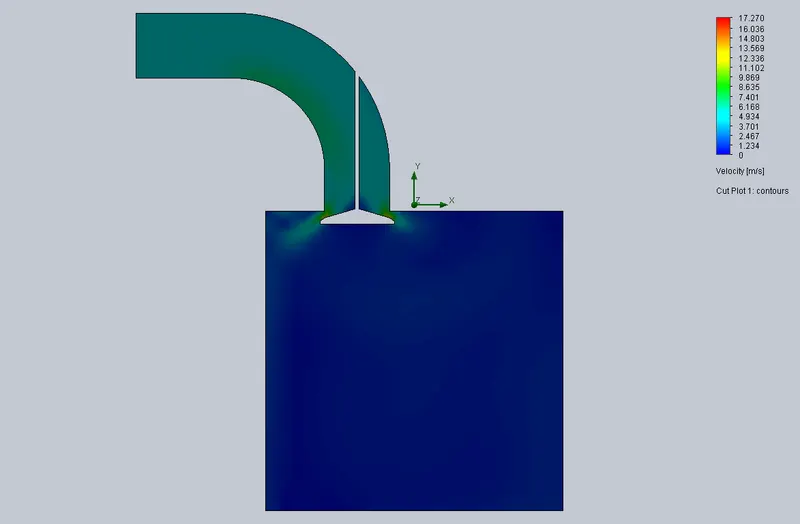
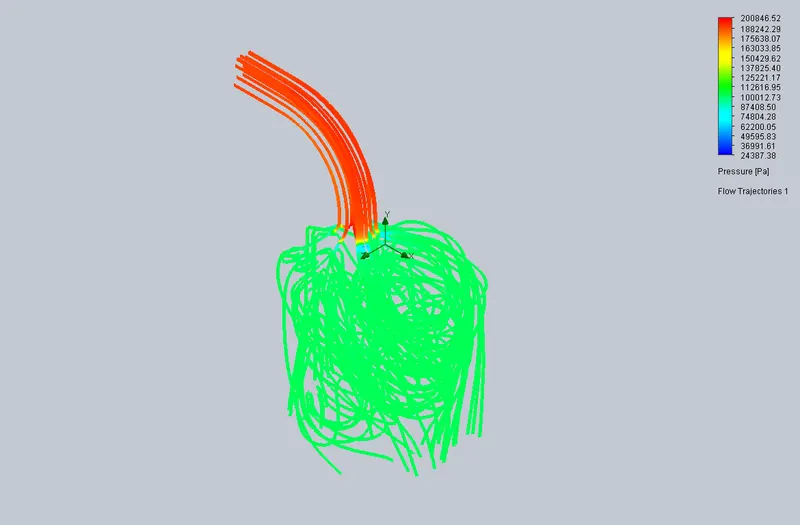
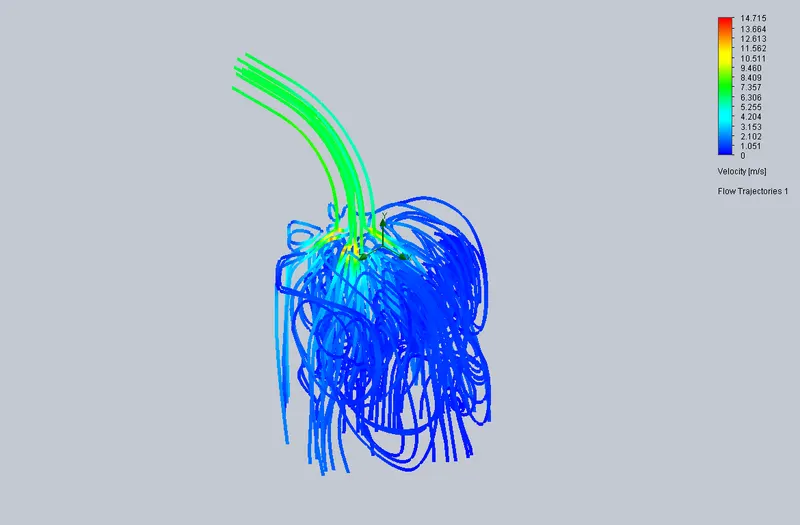
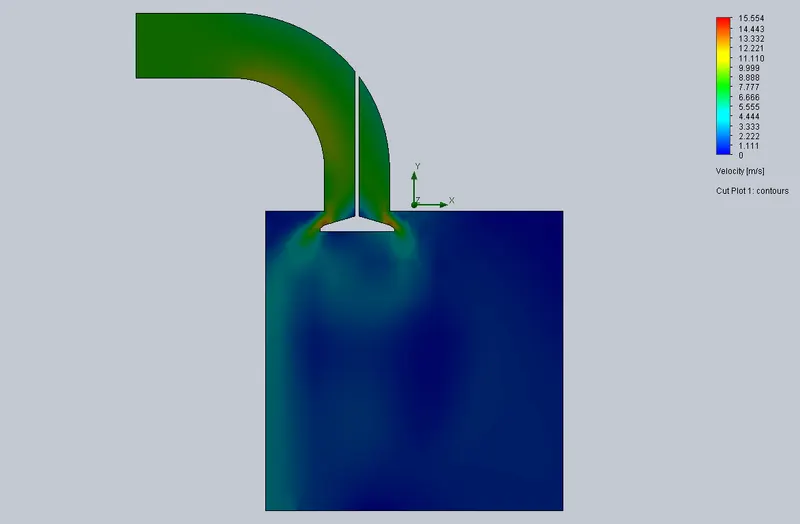
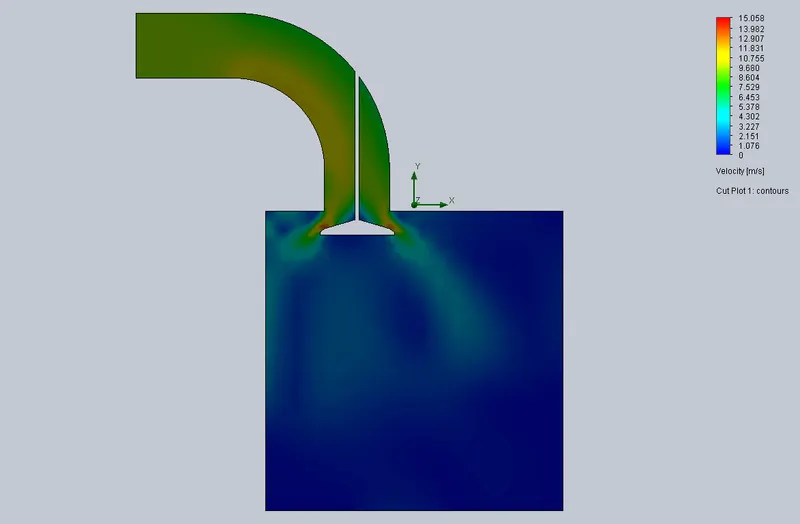
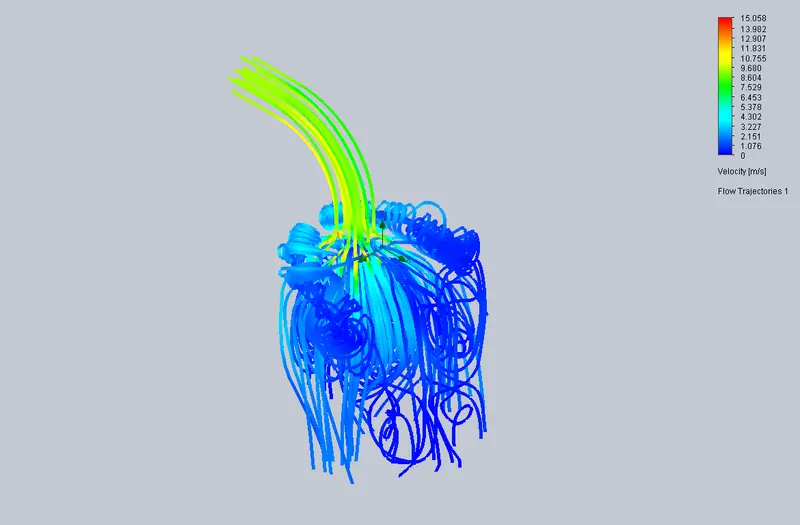
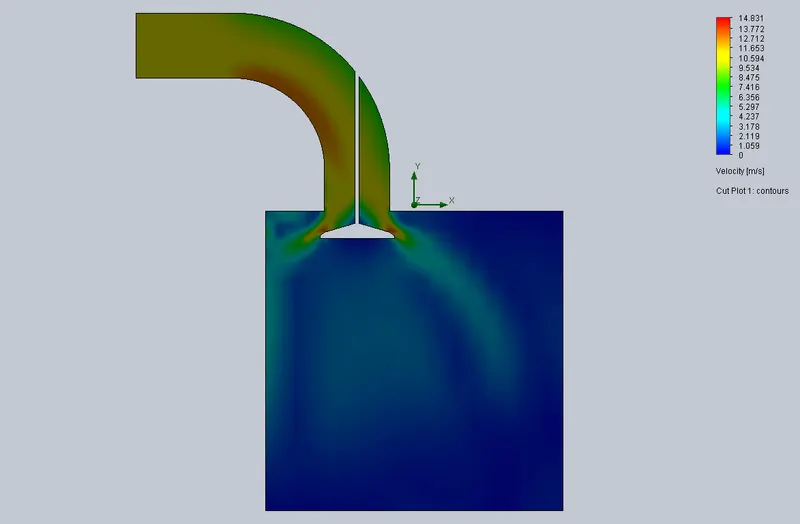
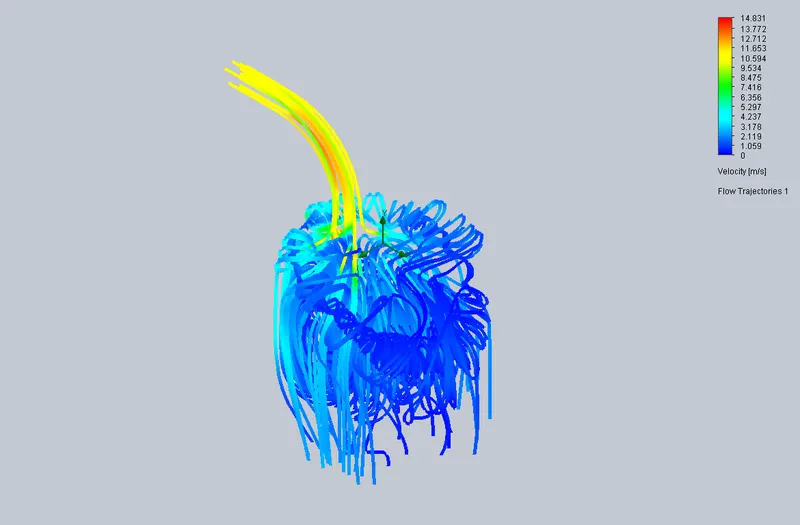
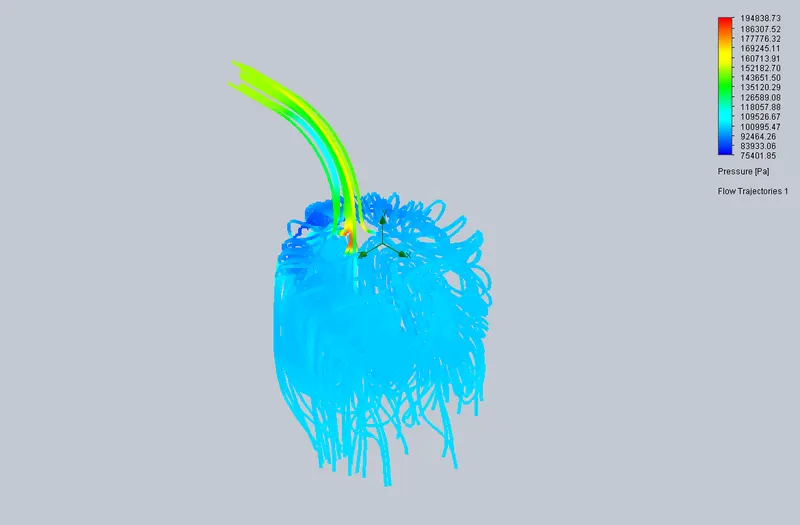
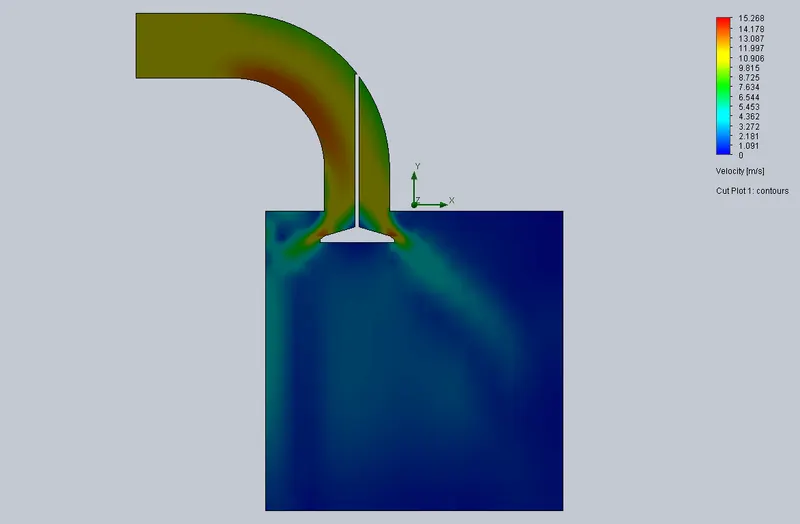
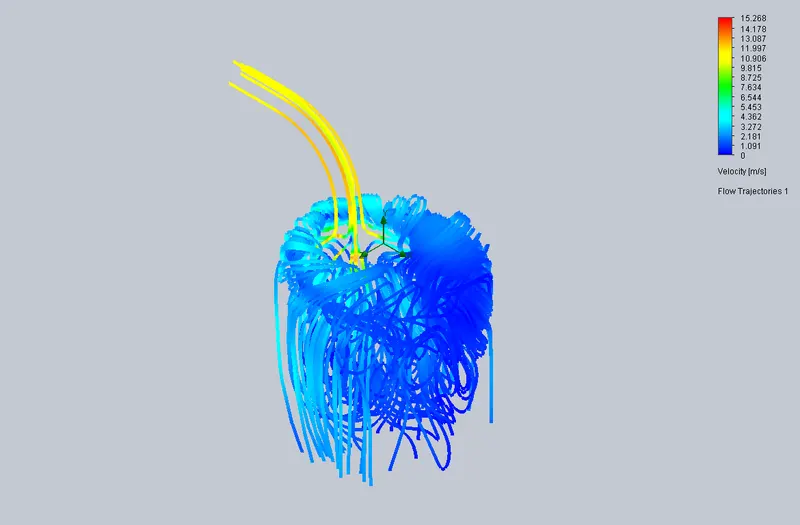
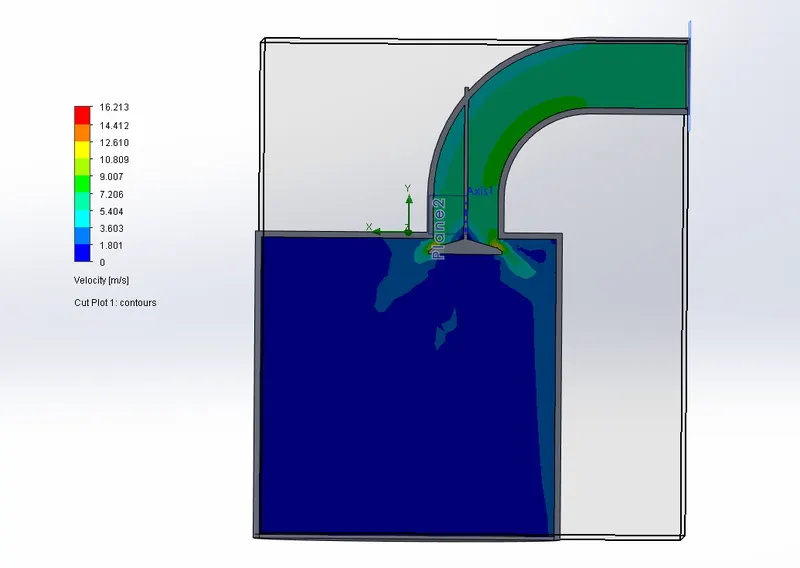
Baseline Cut Plot for Velocity (Front Plane Sectional View)
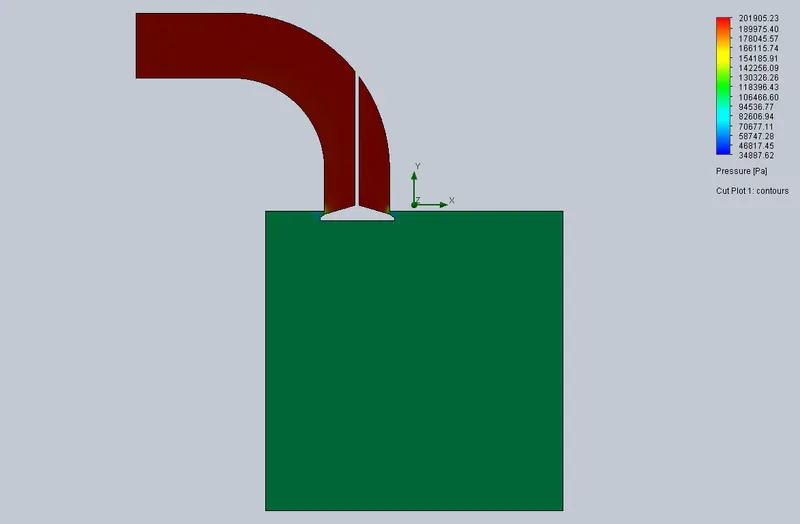
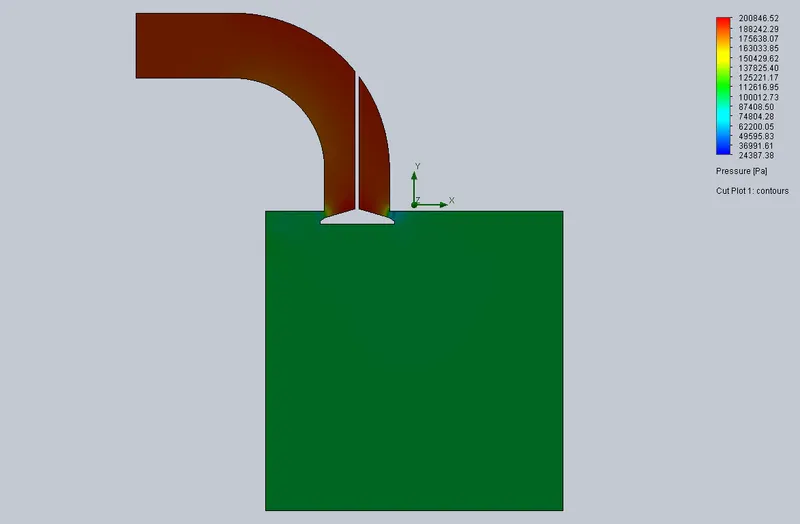
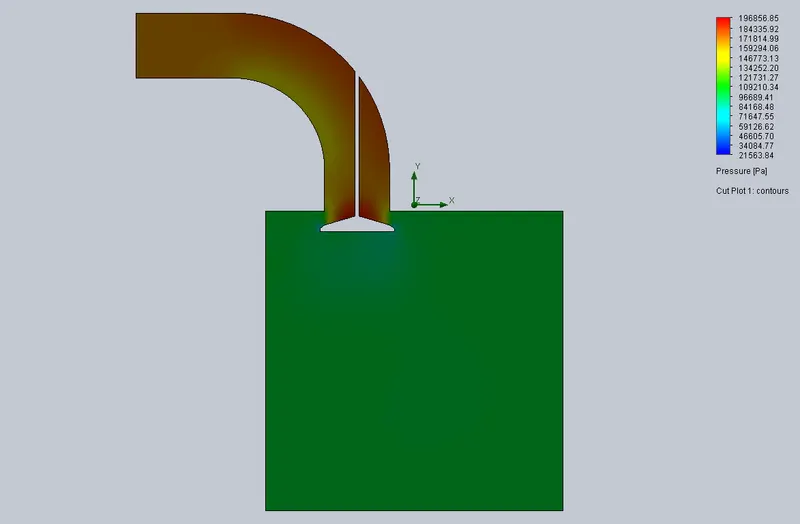
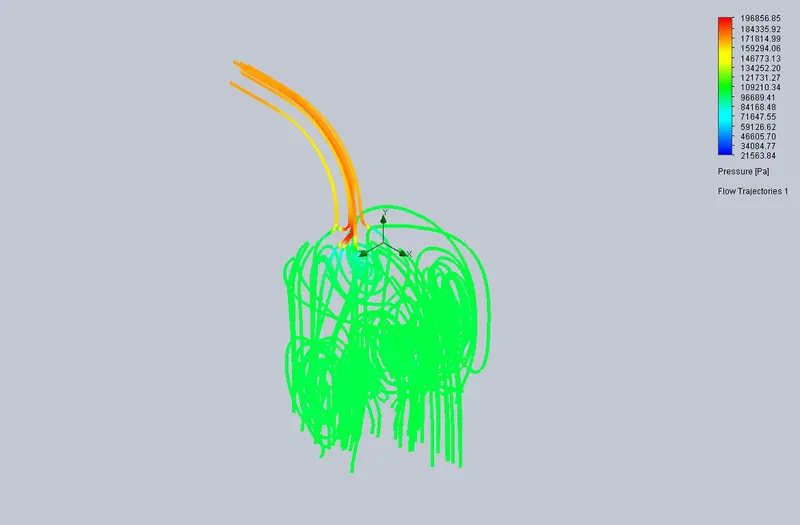
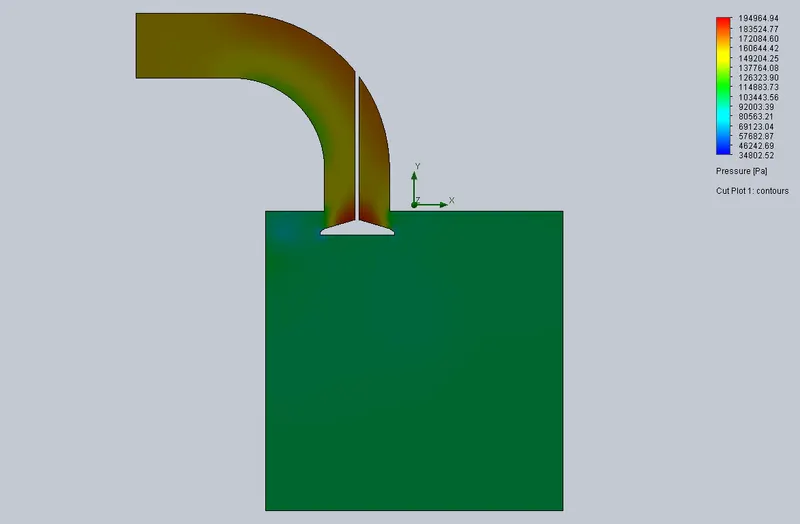
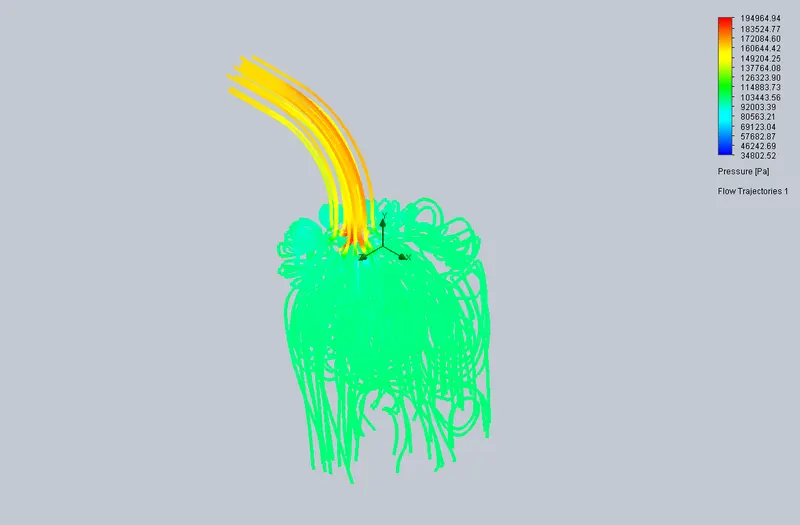
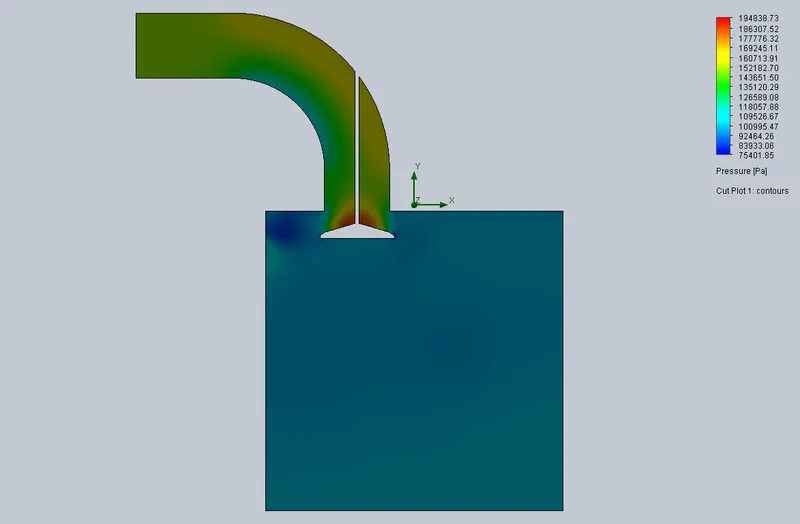
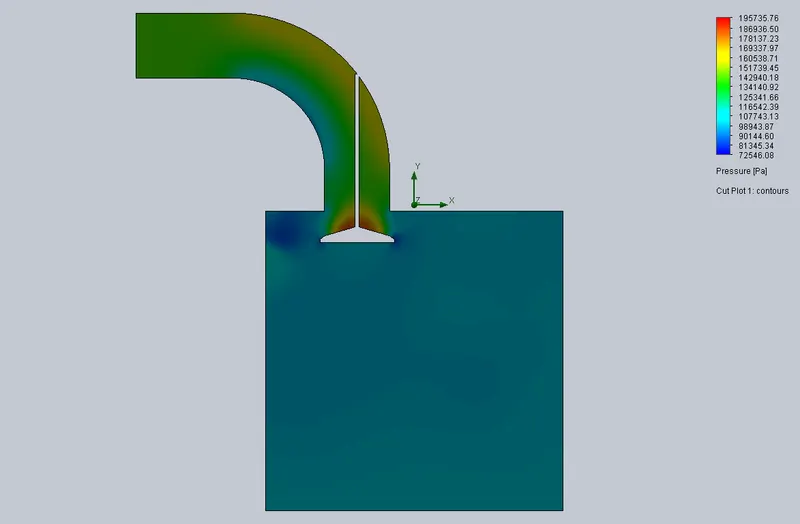
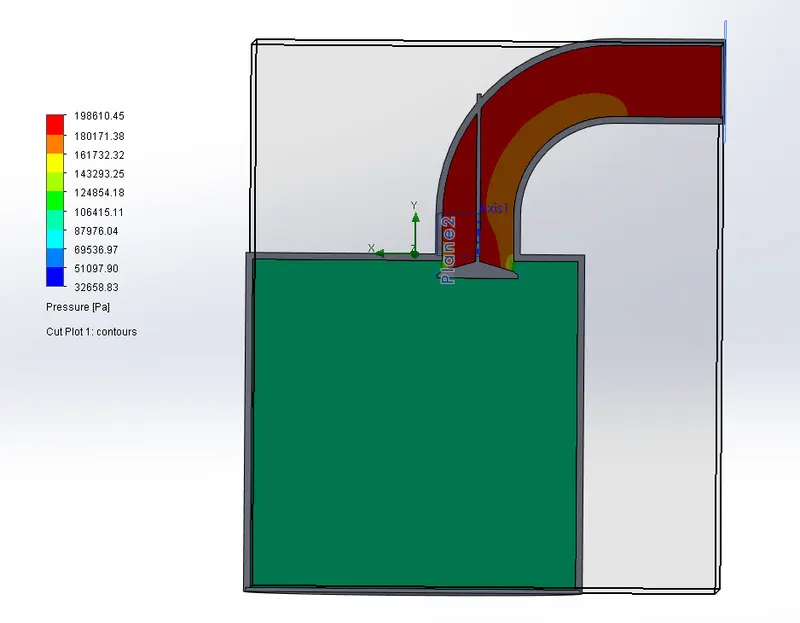
Baseline Cut Plot for Pressure (Front Plane Sectional View)
2. To perform Grid Dependency Test
Same Variables as the Baseline setup
Output Vaiables:
- Goals - Surface Mass Flow Rate
- Results -Velocity Cut Plot
Scenarios:
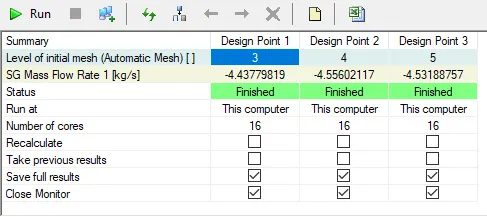
- Intial Levels Of Mesh = 3,4,5
- Run the Parametric Study
- Grid Dependency Result
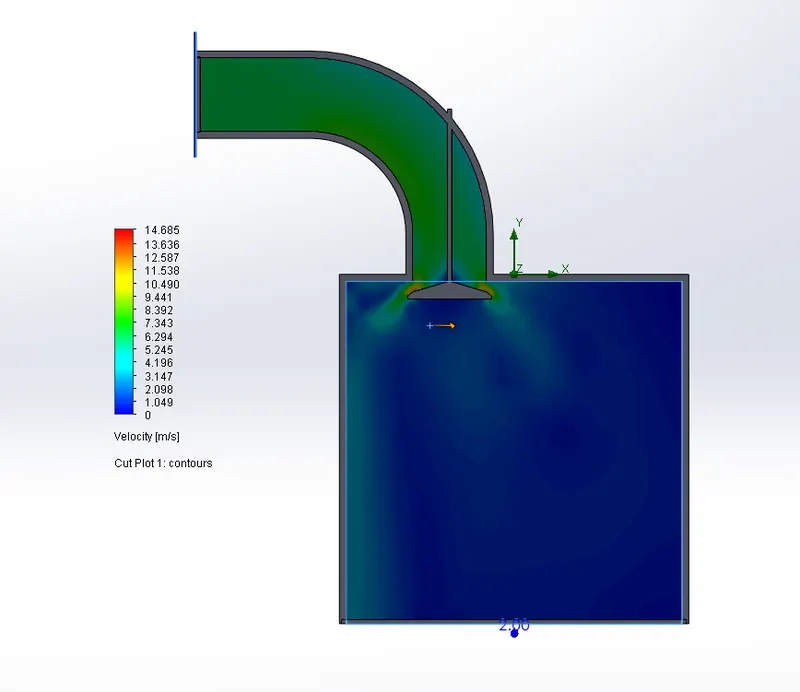
Velocity Cut Plot Mesh Level 3 Refinement
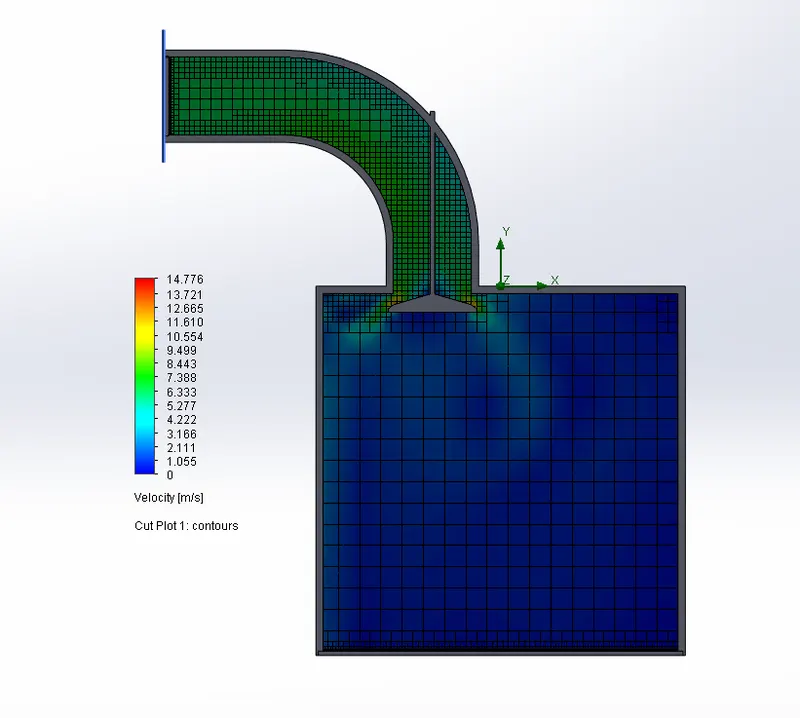
Velocity Cut Plot Mesh Level 4 Refinement
Velocity Cut Plot Mesh Level 5 Refinement
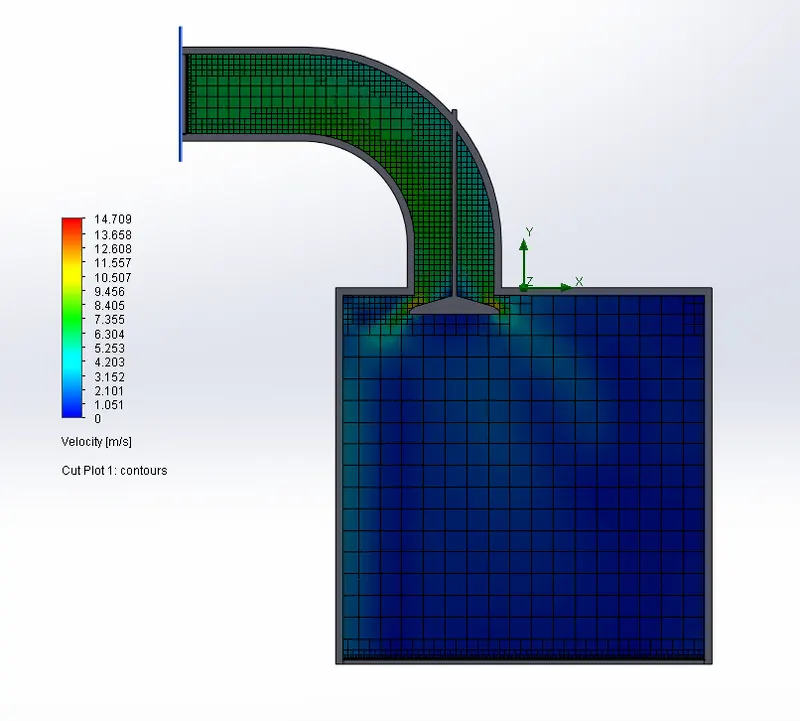
Higher the Grid Refinement ,The better will be the results , hence we shall choose Grid Refinement level 5 as it gives an accurate representation.
---------------------------------------------------------------------
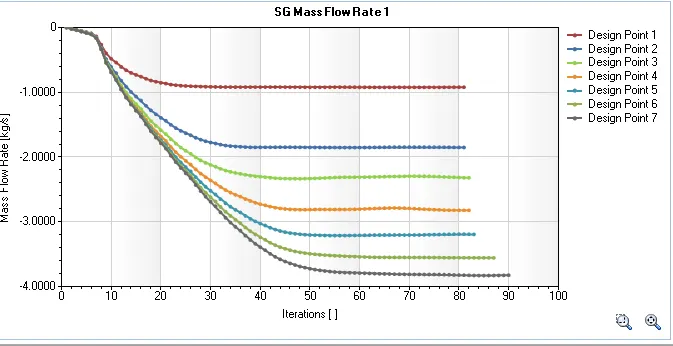
2.Valve Lift Parametric Study
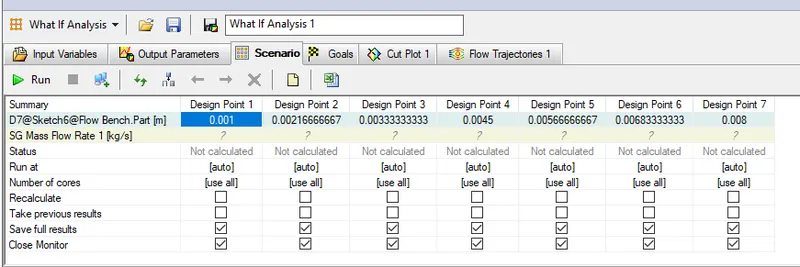
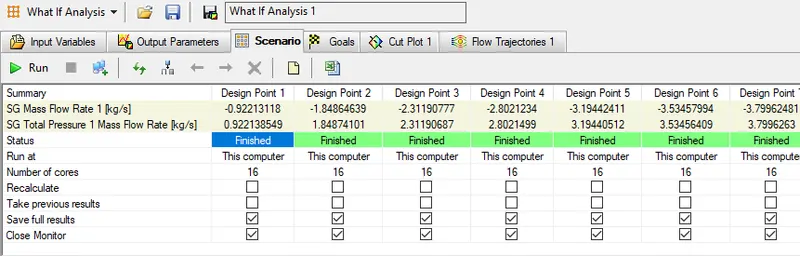
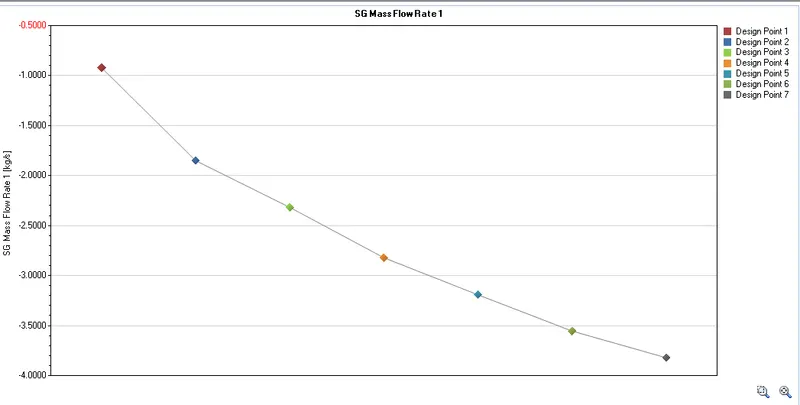
- For this study we compare and plot Valve Lift vs Mass Flow Rate.
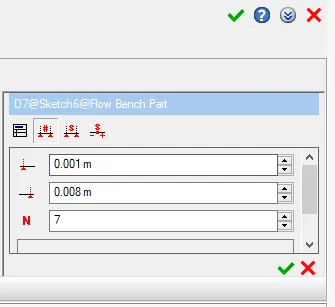
- The Valve Lift will occur from 0.001m -0.008mm with 7 output results in tota
- Level of Initial Mesh = Set discrete value to 5
- Add Dimension = Select Lift Dimension
- Range with numbers= (0.001-0.008), 7 values
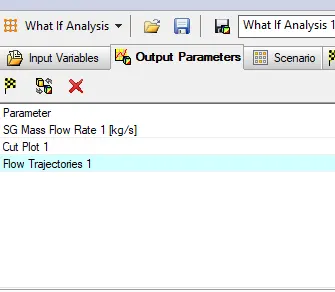
- Add Goals =SG Mass Flow Rate
- Add Results