Centrifugal pump design and analysis
SIMULATION OF FLOW THROUGH CENTRIFUGAL PUMP
Using Solidworks
AIM: To run a flow simulation through a centrifugal pump and plot the relationship between Pressure ratio and Mass Flow Rate
OBJECTIVE:
- To model a Centrifugal Pump using solidworks
- To run Simulation flow of Water from inlet to outlet
- To plot pressure and show the trajectory flow of Velocity through the Centrifugal Pump
- To calculate pressure ratio and compare the relationship between Pressure ratio and Mass Flow Rate
OVERVIEW:
Centrifugal Pump
A centrifugal pump is a mechanical device designed to move a fluid by means of the transfer of rotational energy from one or more driven rotors, called impellers.
Fluid enters the rapidly rotating impeller along its axis and is cast out by centrifugal force along its circumference through the impeller’s vane tips. The action of the impeller increases the fluid’s velocity and pressure and also directs it towards the pump outlet.
The pump casing is specially designed to constrict the fluid from the pump inlet, direct it into the impeller and then slow and control the fluid before discharge.
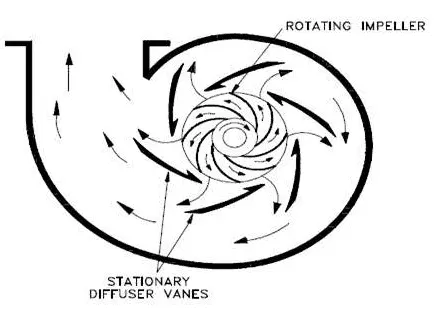
Parts of Centrifugal Pump Include
Impeller
An impeller is a rotor used to increase the kinetic energy of the flow.
Impeller design is the most significant factor for determining the performance of a centrifugal pump. A properly designed impeller optimizes flow while minimizing turbulence and maximizing efficiency.
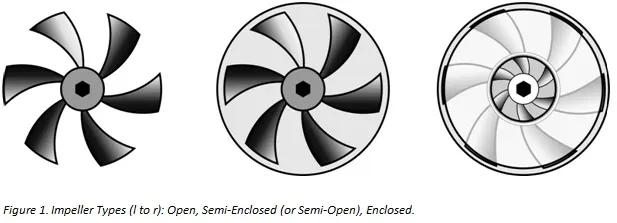
There are 3 types of Impellers
1.Open Impeller: Open impellers have the vanes free on both sides. Open impellers are structurally weak.
2.Semi Open Impeller: The vanes are free on one side and enclosed on the other. The shroud adds mechanical strength. They also offer higher efficiencies than open impellers.
3.Closed Impeller: The vanes are located between the two discs, all in a single casting.
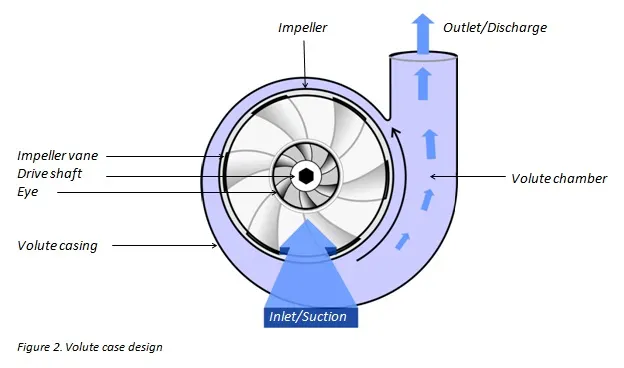
Volute or Casing
The casing contains the liquid and acts as a pressure containment vessel that directs the liquid flow in and out of the centrifugal pump. The volute is a curved funnel that increases in area as it approaches the discharge port.
Shaft (Rotor)
The impeller is mounted on a shaft. A shaft is a mechanical component for transmitting torque from the motor to the impeller.
Shaft sealing
Centrifugal pumps are provided with packing rings or mechanical seal, which helps prevent the leakage of the pumped liquid.
Bearings
Bearings constrain the relative motion of the shaft (rotor) and reduce friction between the rotating shaft and the stator.
Applications
- Water supply for residential areas.
- Fire protection systems.
- Sewage/slurry disposal.
- Food and beverage manufacturing.
- Chemical manufacturing.
- Oil and gas industrial operations.
-------------------------------------------------------------------------------------------------------------------------------
MODEL GEOMETRY:
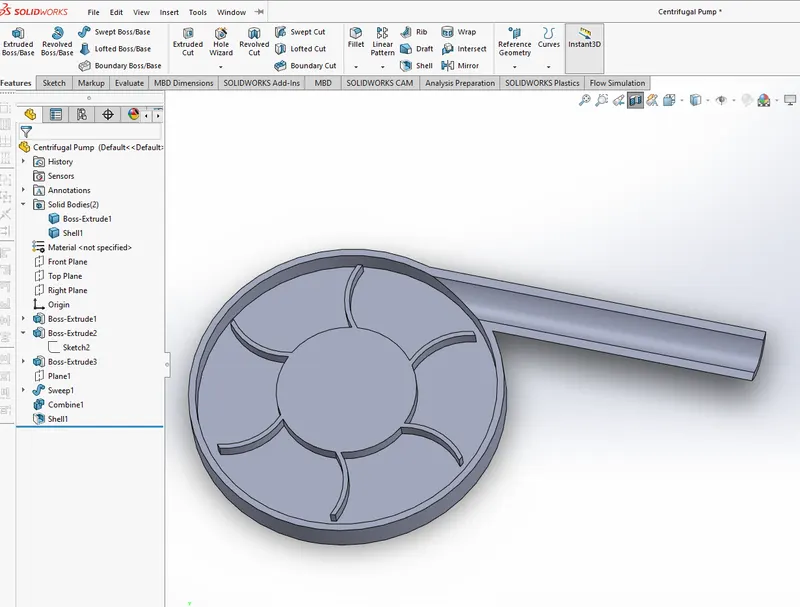
Isometric View
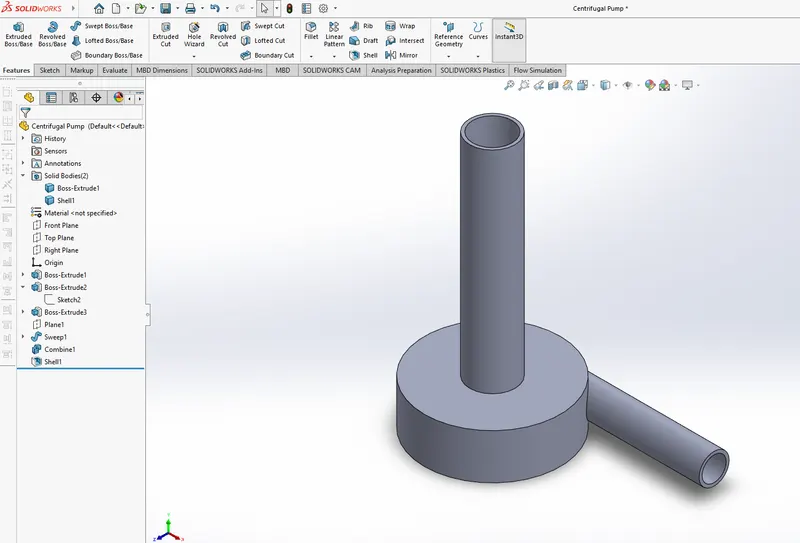
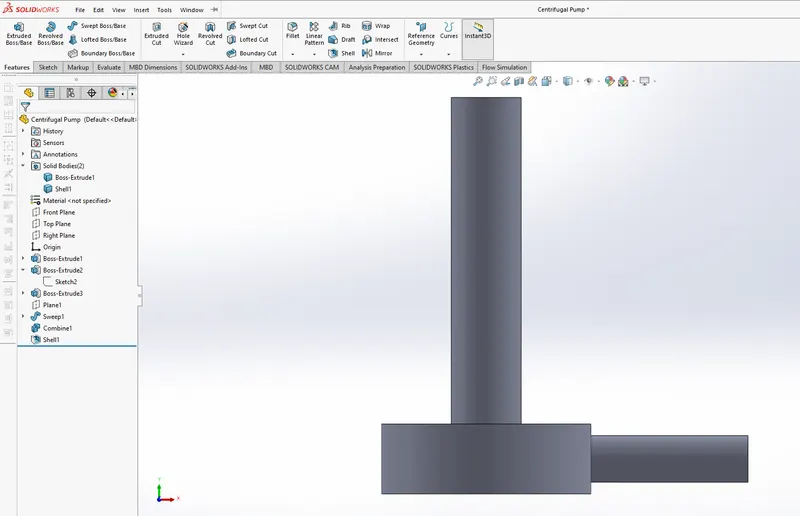
Side View
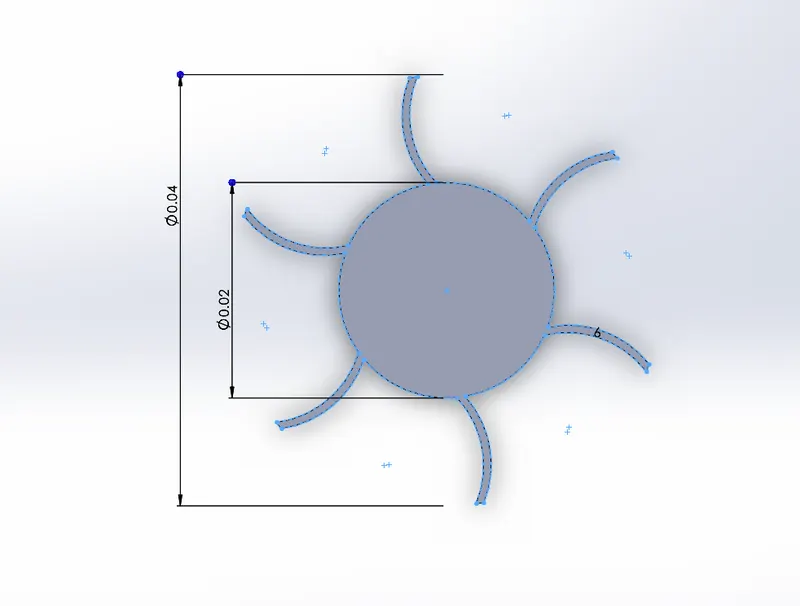
View of Impeller
------------------------------------------------------------------------------------------------------------------------------
Pump Geometry
Casing Diameter = 0.045m
Inlet Diameter = 0.015m
Outlet Diameter= 0.005m
Shell Thickness = 0.001m
------------------------------------------------------------------------------------------------------------------------------
Impeller Geometry
Cylinder Diameter = 0.02m
Cylinder and Blade Height = 0.02m
--------------------------------------------------------------------------------------------------------------------------------------
PROCEDURE:
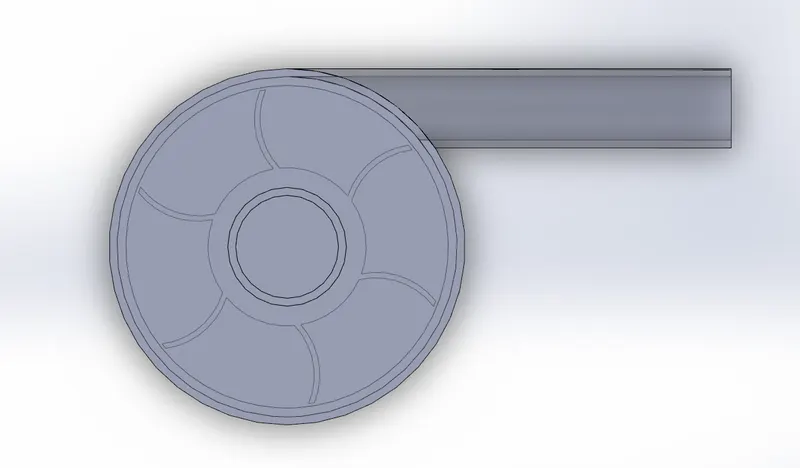
1. To create a zone across the Impeller This is basically the control Volume. This can be done by sketching a circle that covers the impellers inside the casing and extruding it from mid plane just above the impellers.
Side View
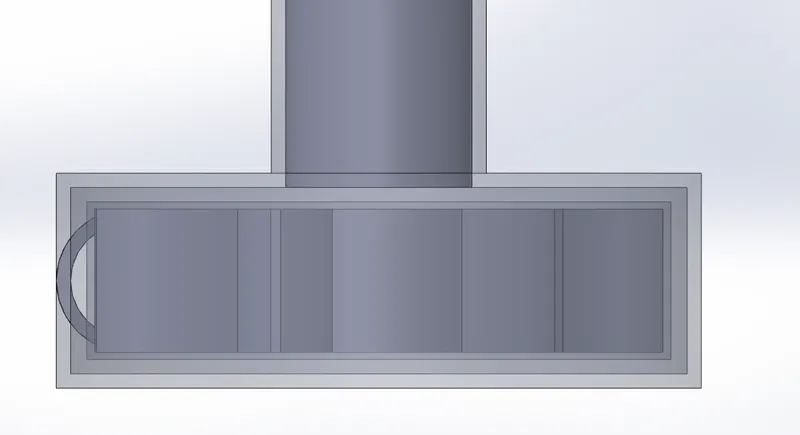
Top View
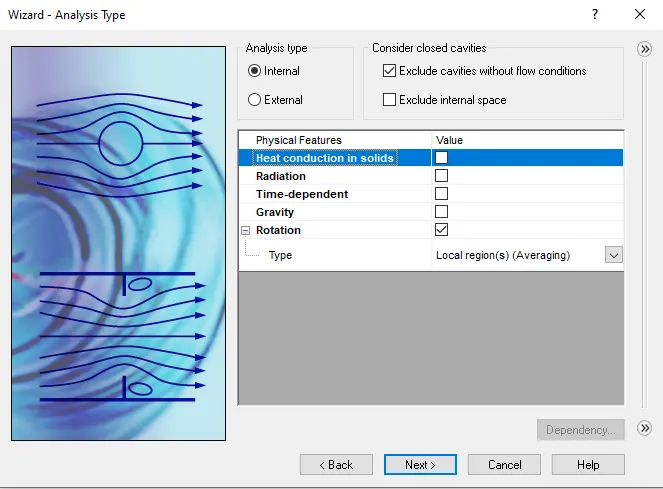
2. Setup Flow Simulation Parameters using Wizard
Analysis Type
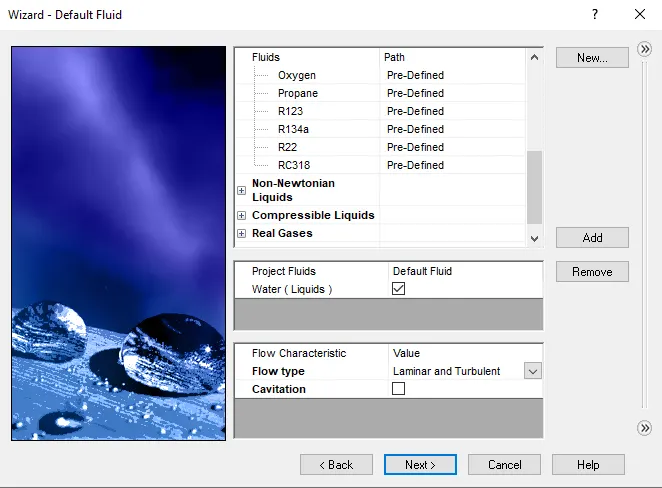
Fluid Type
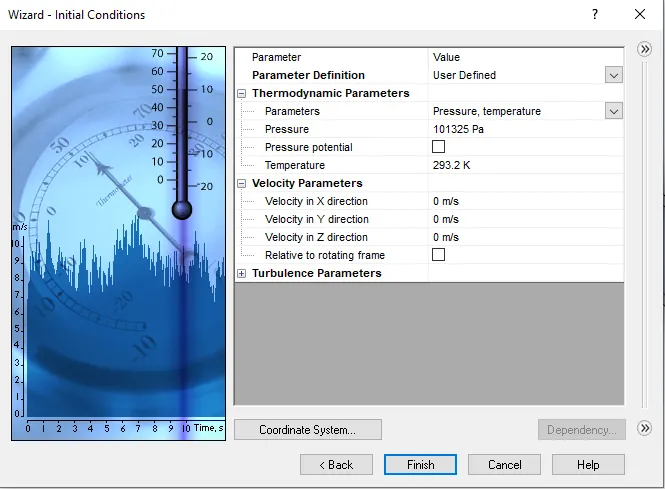
Intial Conditions
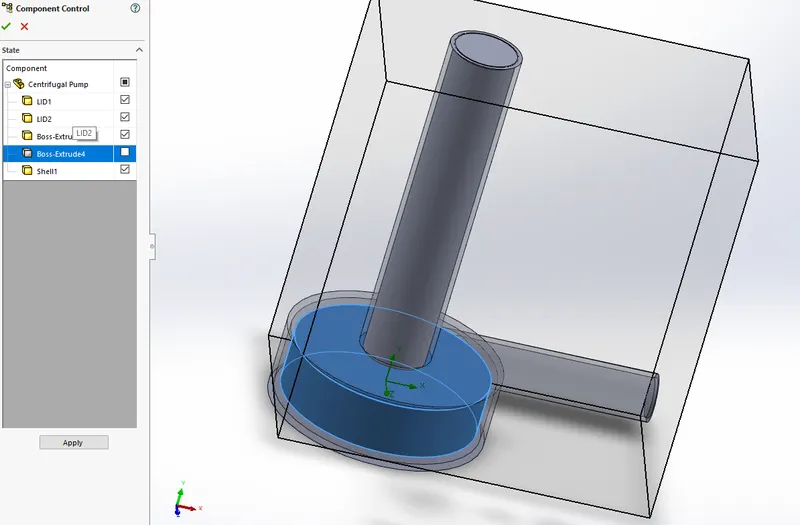
3. Once the Wizard is setup. It is important to let solidworks know that the zone or control volume is not a wall , it is just a Rotation zone.For this , right click on input data option and in component control uncheck the wall or control volume.
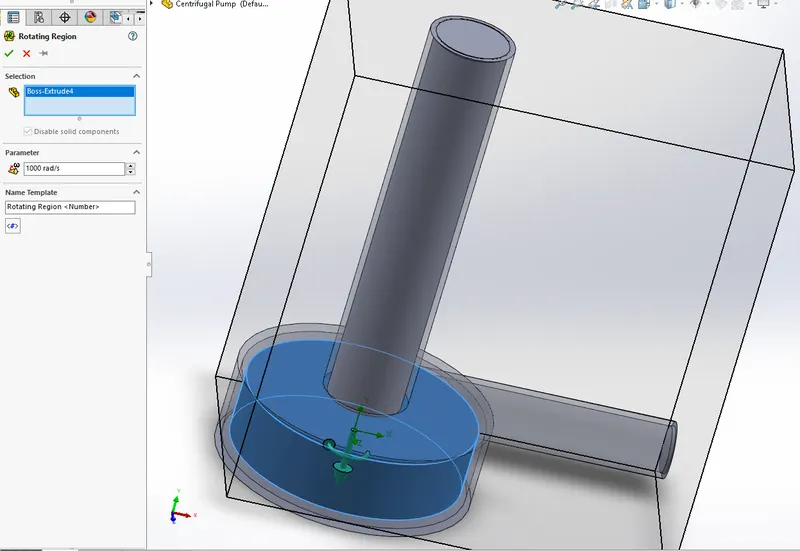
4. To Setup the Rotating Region click on the Rotating Regions option in input data and select the wall that was unchecked in the previous step.Then make sure The Parameter or the rotor spins at 1000 rads/sec.
5. Assign the Boundary Conditions and Goals For Baseline Simulation
Inlet Lid Pressure => Environmental Pressure
Outlet Lid Velocity => 10m/s
Surface Goals => Total Average Pressure
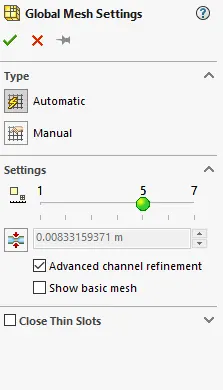
6. Edit Global Mesh level to 5 and click on Advanced Channel Refinement.
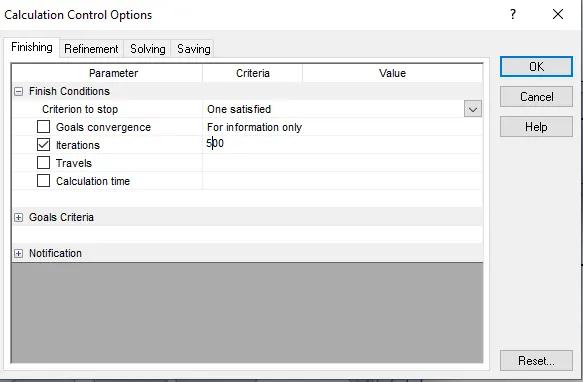
7. Run the Baseline Simulation for 500 iterations. Right Click on Input Data and go to Calculation Control option to do so
Solver Image
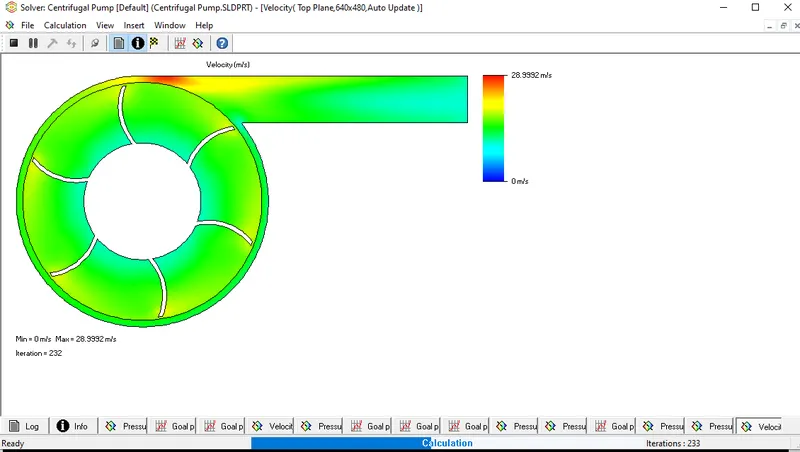
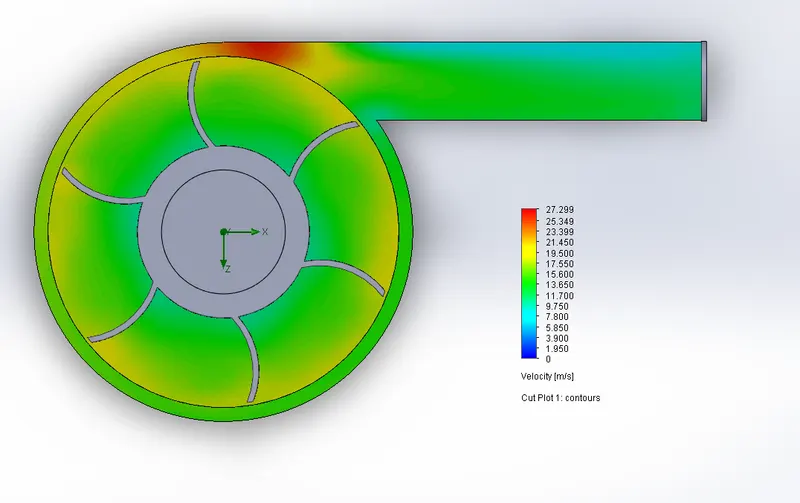
Basline Simulation Results
Velocity plot
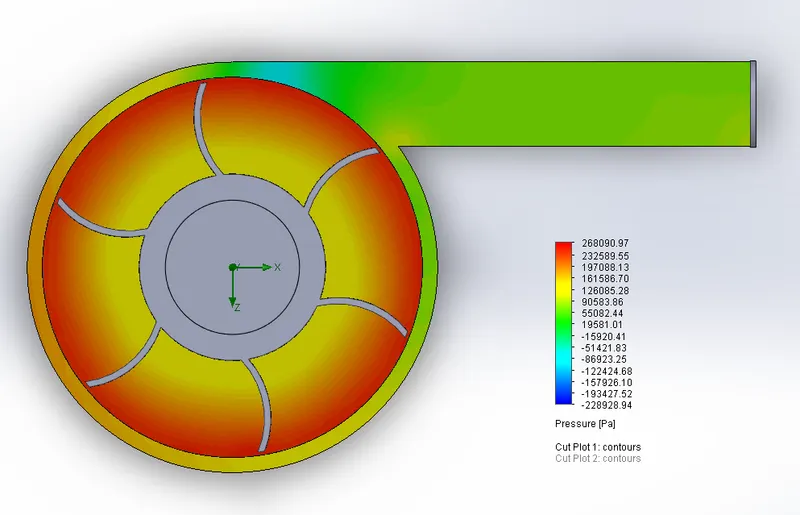
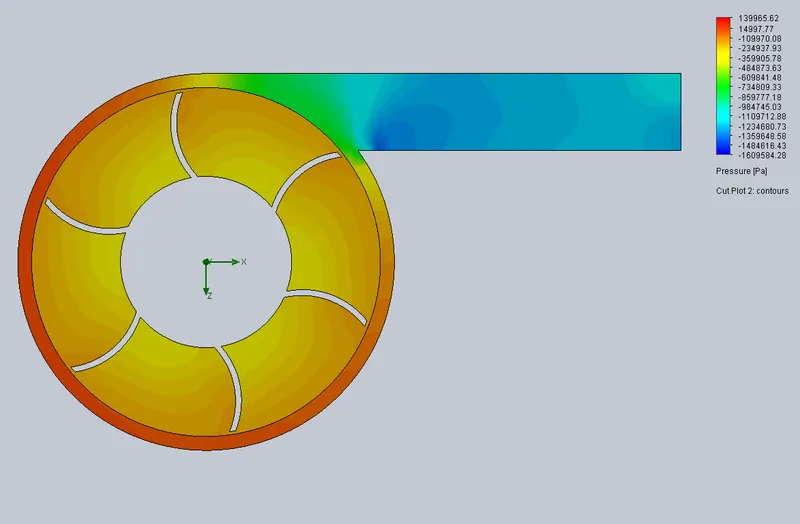
Pressure Plot
-----------------------------------------------------------------------------------------------------------------------
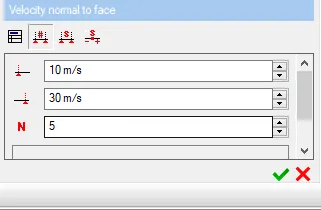
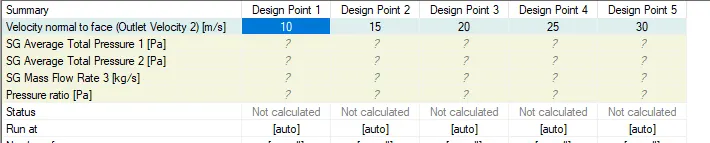
8.Once the Baseline Simulation is done. Create a new Parametric Study with 5 input parameters for outlet velocity 10m/s.
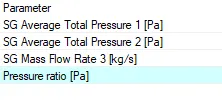
Insert Surface goals for Output Parameters :
- Avg Total Pressure Inlet
- Avg Total Pressure Outlet
- Mass Flow rate at the outlet
- Pressure Ratio => Outlet Pressue/ InletPressure
Add Results For Output Parameters
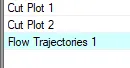
- Cut Plots for Pressure and Velocity
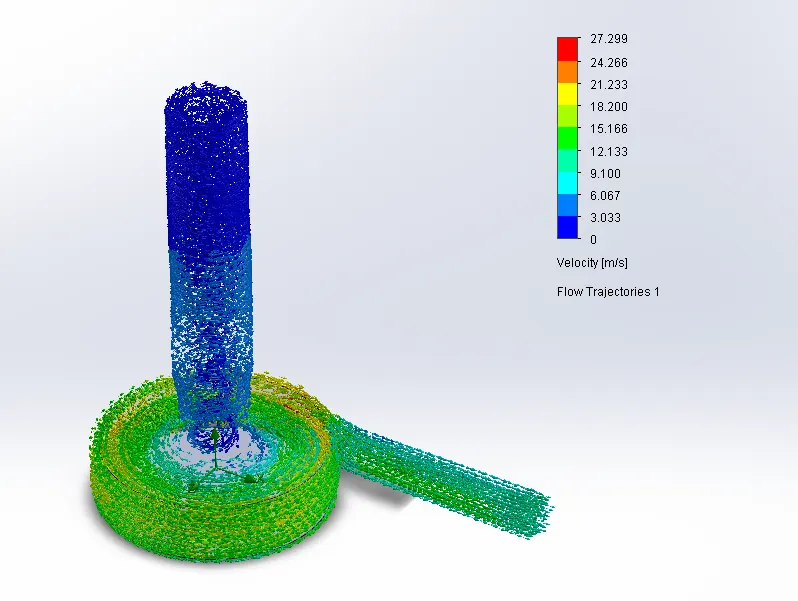
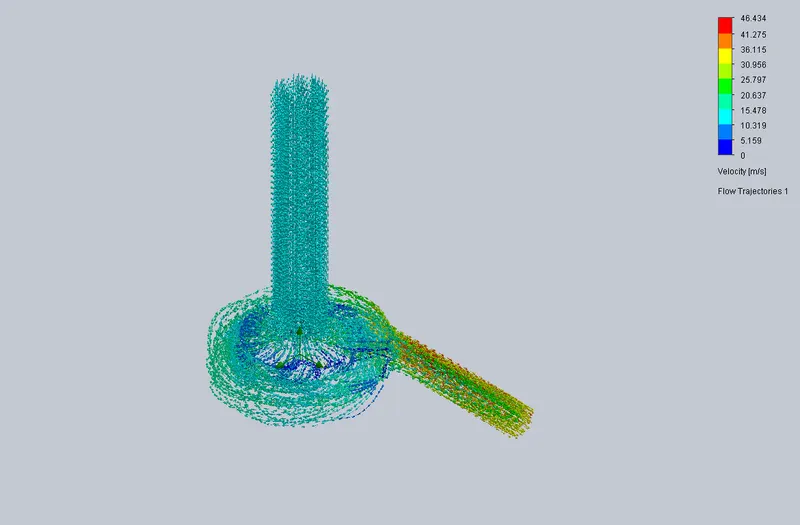
- Flow Trajectory of Velocity
Scenario Page
--------------------------------------------------------------------------------------------------------------
9. Once this is done, Run The Parametric Study and Compare Pressure Ratio to the Mass Flow Rate.Also look into the Cut Plots and Flow Trajectories
---------------------------------------------------------------------------------------------------------------------
RESULT
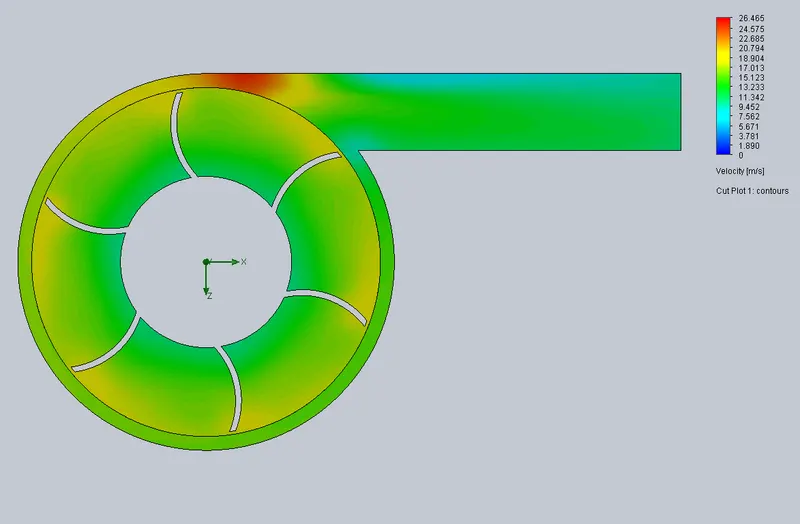
1. For Outlet Velocity 10m/s
Velocity Plot
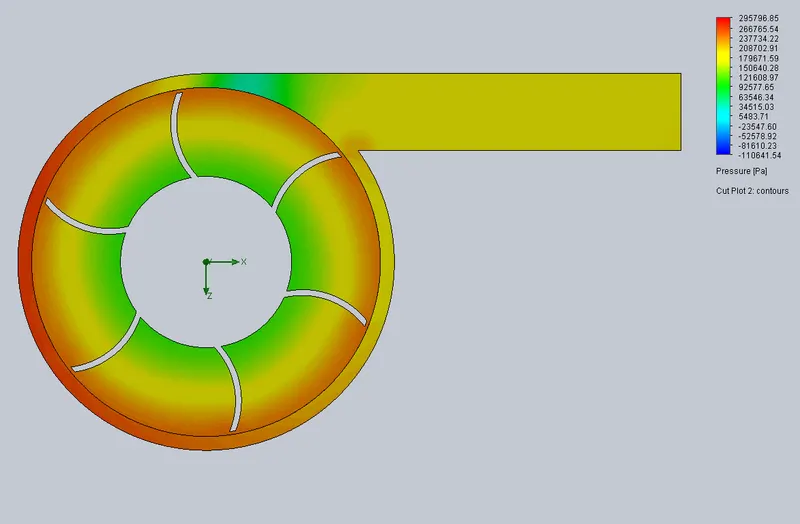
Pressure Plot
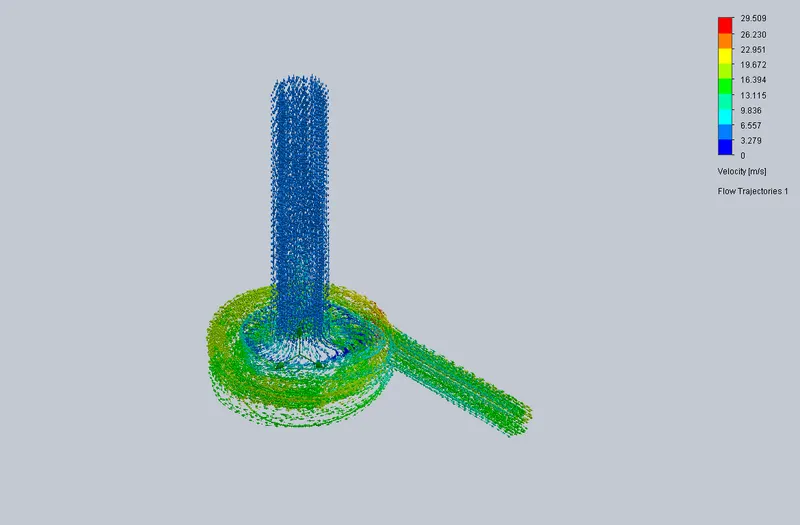
Velocity Trajectory
--------------------------------------------
2. For Outlet Velocity 15m/s
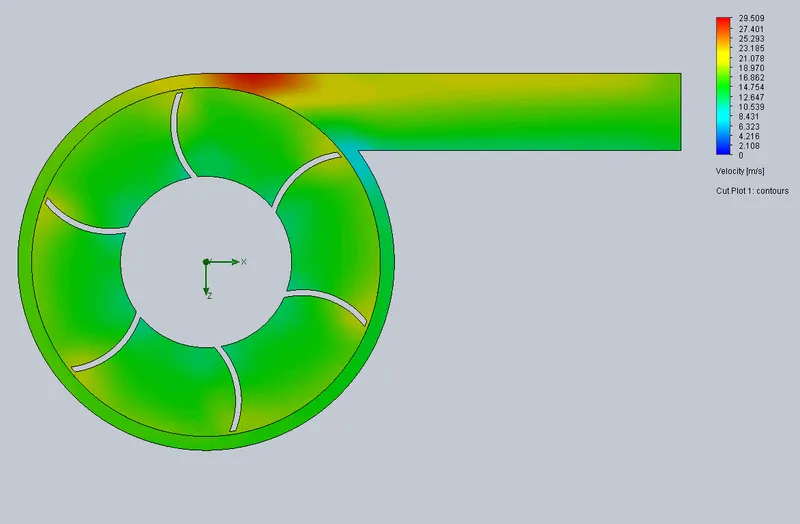
Velocity Plot
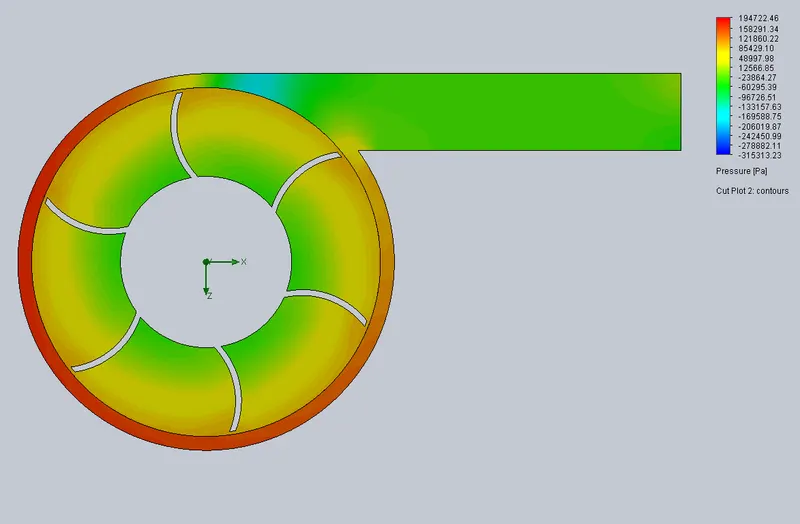
Pressure Plot
Velocity Trajectory
--------------------------------------------
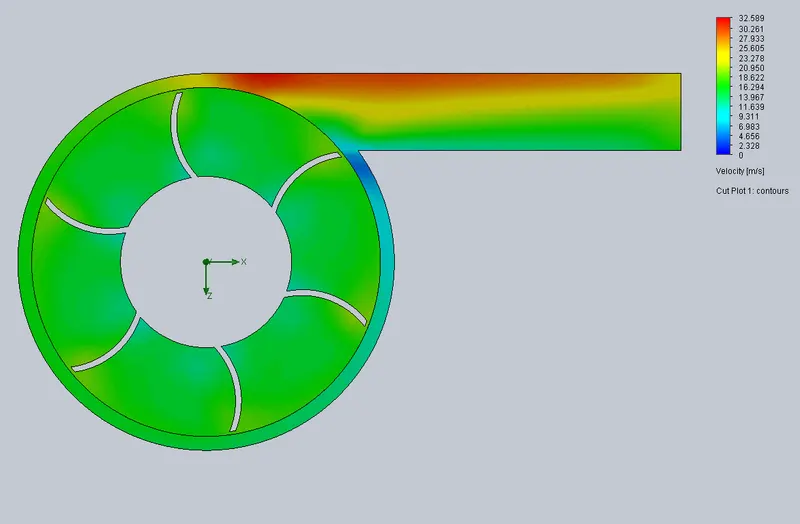
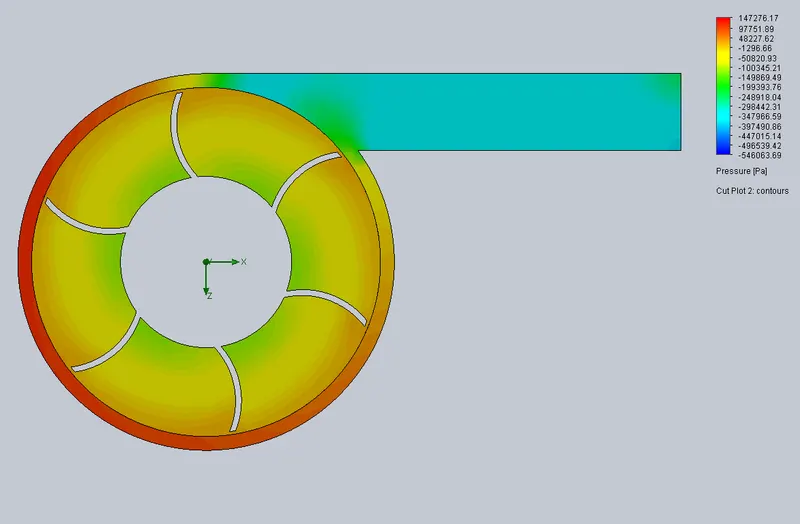
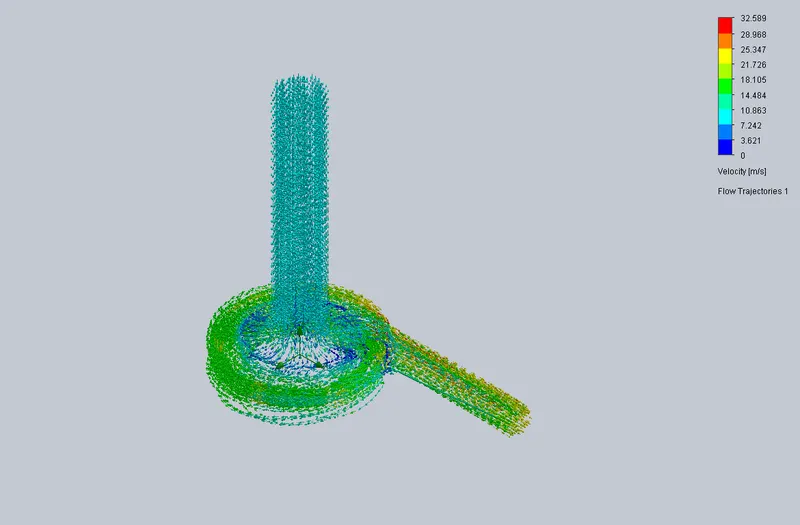
3. For Outlet Velocity 20m/s
Velocity Plot
Pressure Plot
Velocity Trajectory
------------------------------------------------------------------------------------
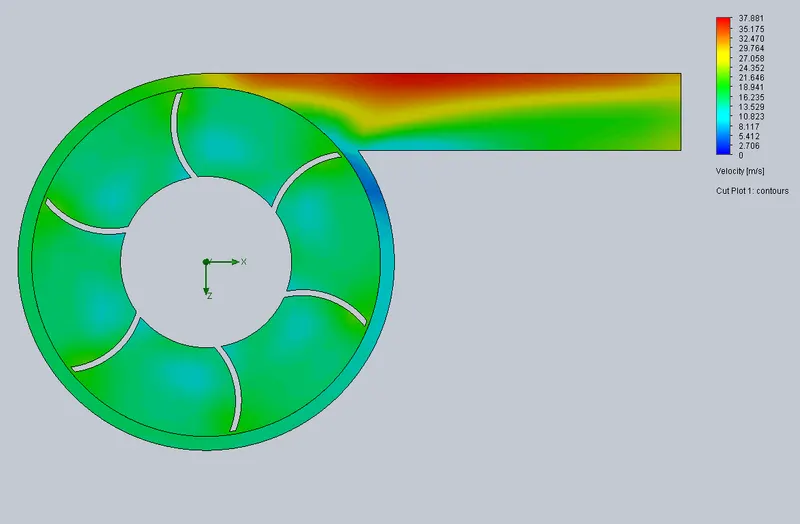
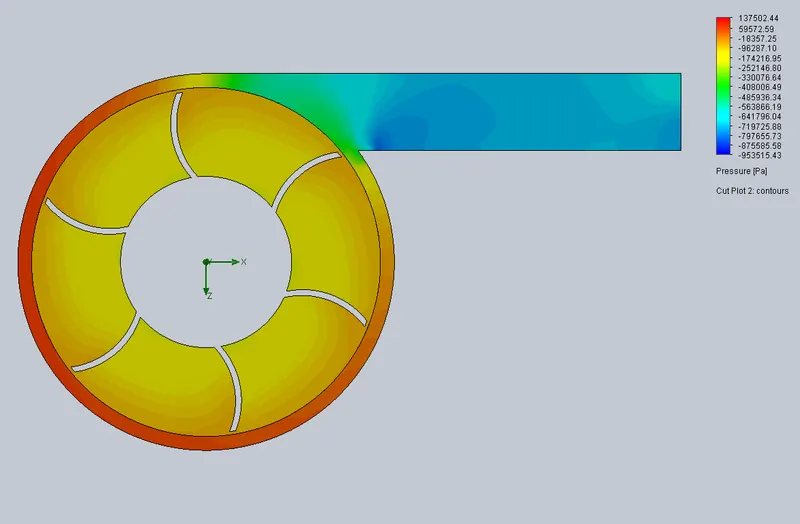
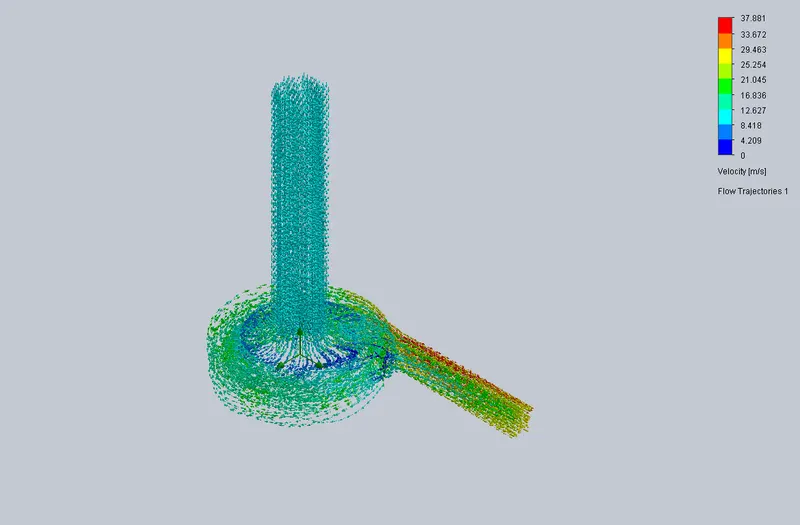
4. For Outlet Velocity 25m/s
Velocity Plot
Pressure Plot
Velocity Trajectory
--------------------------------------------
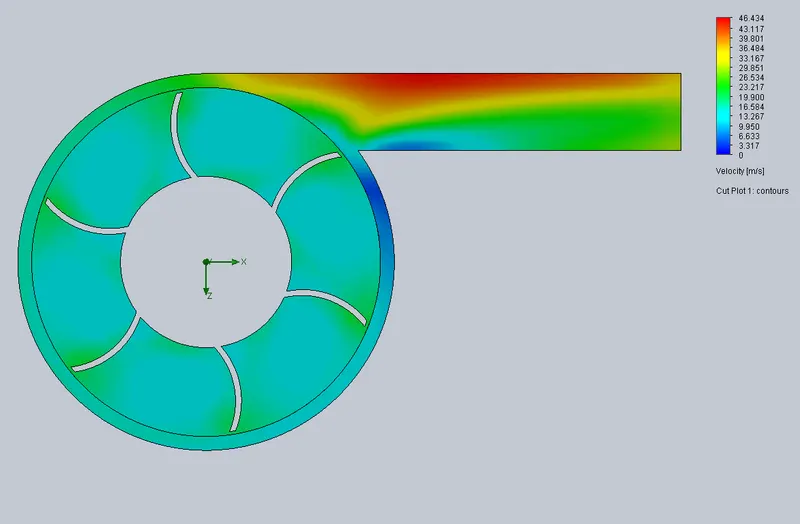
5. For Outlet Velocity 30m/s
Velocity Plot
Pressure Plot
Velocity Trajectory
---------------------------------------------------------------------------------------------------------------------------
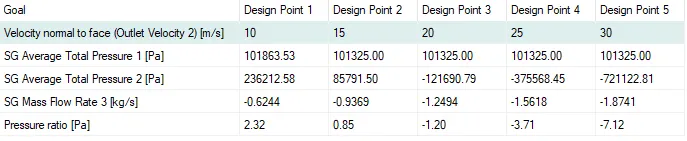
Results in Scenarios
Graph
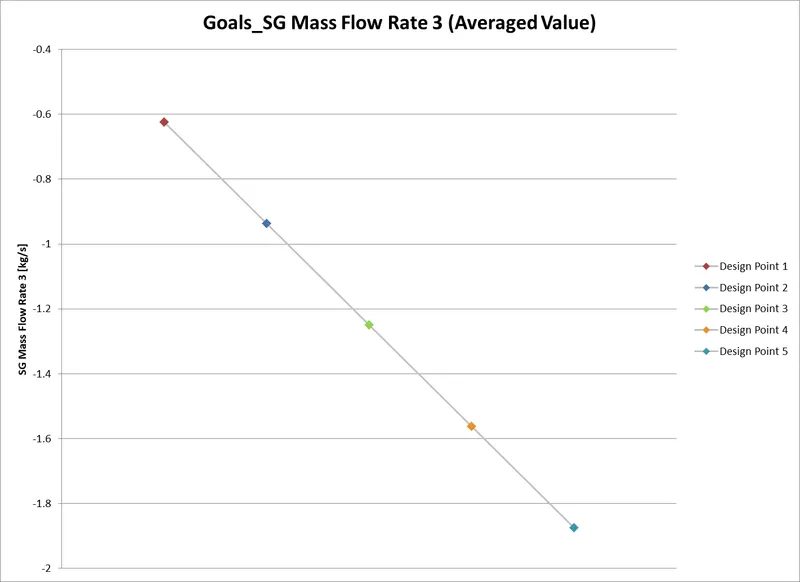
Mass Flow Rate
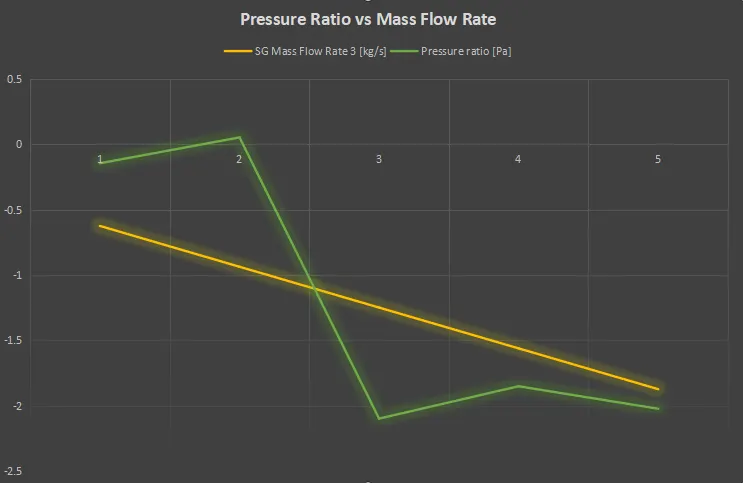
Pressure Ratio vs Mass Flow Rate
----------------------------------------------------------------------------------------------------------------------------
Observation/Conclusion
- The Plots show that the pressure decreases with increase in velocity.
- The massflow rate increases as velocity increases. The negative sign is due to outlet region.
- This satisfies the working of an centrifuagal pump where we get maximum pressure at the outlet.
- The graph between Pressure Ratio and Mass Flow Rate, shows that mass flow rate is inversely proportional to Pressure Ratio.
THANK YOU