Modeling and Simulation of flow around an Ahmed Body
OBJECTIVES
*set up the simulation of flow around an Ahmed Body using Converge CFD and Comparing the simulation result with the experimental data provided.
* To determine the Aerodynamic forces on the Ahmed body such as Drag and Lift coefficients.
Ahmed Body
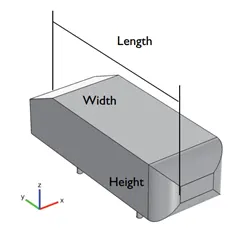
The Ahmed body is a bluff model body with basic aerodynamic properties of a vehicle, which was developed for investigating the influence of the slant angle at the back on the flow field and on the resulting aerodynamic forces, with suppressed interactions between the front and the rear parts.
GEOMETRY
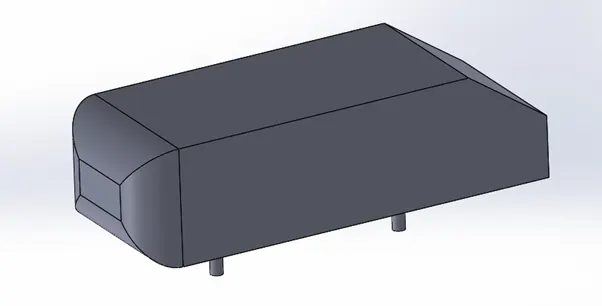
The Ahmed Geometry was prepared using CATIA. The exact dimensions were used in order to get a good result.
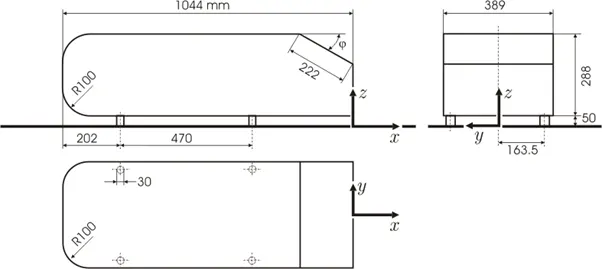
*The slant angle used 35°

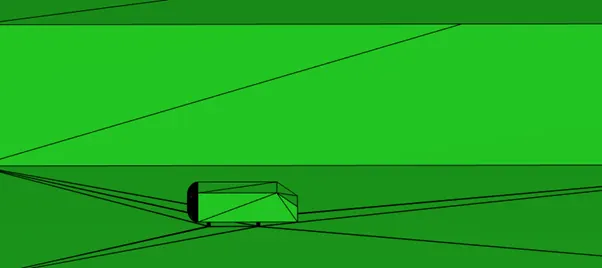
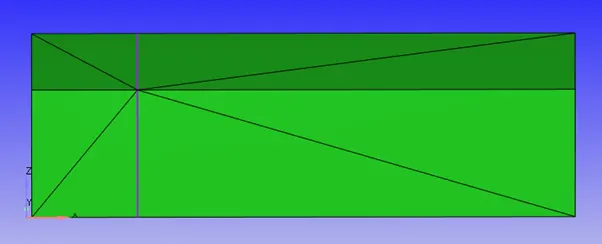
Virtual wind tunnel is created using following measurements
let length of the ahmed body is considered as L.
Then Height of wind tunnel=2*L
Width=2*L
Length=10*L.
Calculation
Given,
Boundary layer thickness is 30mm at 400mm in front of Ahmed body,
inlet velocity=40m/s
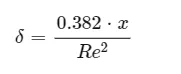
δ=Boundary layer thickness in mm=30mm
‘x’=Length of the plate in m
Re=Reynolds number
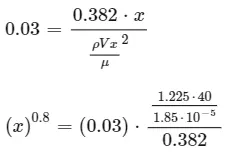
X=1.67m
This means that 1.67m in front as the Ahmed body there will be boundary layer which is of 30mm thick. So the Actual no-slip region in front of Ahmed body should be 1.67+0.4=2.07m.
the slip region is takeas 2 meters.
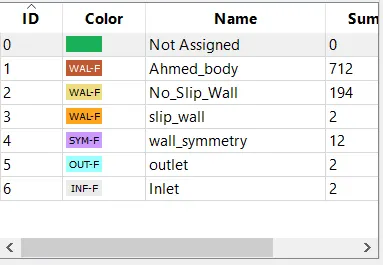
Boundary naming
CASE SETUP
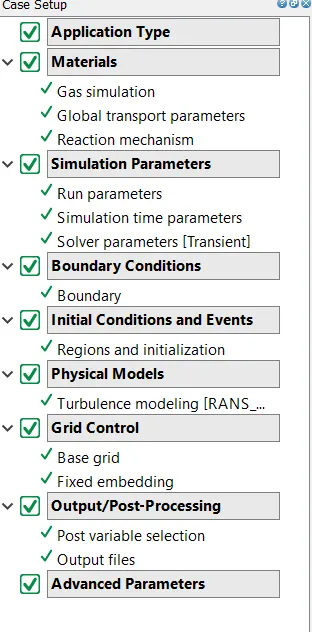
1.Application type
Time based
2.Materials
Air
3. Run parameters:
Solver= transient
Simulation mode= full hydrodynamic
Gas flow solver= compressible
4.Simulation time parameters:
Start time= 0s
End time= 1s
Initial time-step= 0.0001
Minimum time-step= 0.0001
Maximum time-step= 1s
Maximum convection CFL limit= 1
5. Solver parameters:
Navier-Stokes solver scheme= PISO
Navier-Stokes solver type= Density-based
6. Regions and initialization:
Region0:
Velocity(x, y, z)= (40, 0, 0)m/s
Temperature= 300K
Pressure= 101325Pa
Species= air
7. Boundary:
7.1 Inlet
Inflow boundary condition
Velocity(x, y, z)= (40, 0, 0)m/s
Pressure= Zero normal gradient(Neumann BC)
Temperature= 300K
Species= air
7.2 Outlet
Outflow boundary condition
Pressure= 101325Pa
Velocity= Zero normal gradient (Neumann BC)
Species backflow= air
Temperature backflow= 300K
7.3 wall_Symmetry
Symmetry boundary condition
7.4 No_slip_wall
Stationary wall boundary condition(law of wall)
7.5 Slip_wall
Stationary wall boundary condition (slip wall)
The slip wall boundary condition does not produce any boundary layer effects. This boundary condition is used since it is the requirement to get a boundary layer thickness of 30mm at a distance of 400mm in front of the front face of the Ahmed body. The plate length is calculated, and the excess length is provided as a slip wall boundary condition.
7.6 Ahmed body
Stationary wall boundary condition(law of wall)
8. Turbulence modeling
K-omega SST turbulence model
9. Grid control:
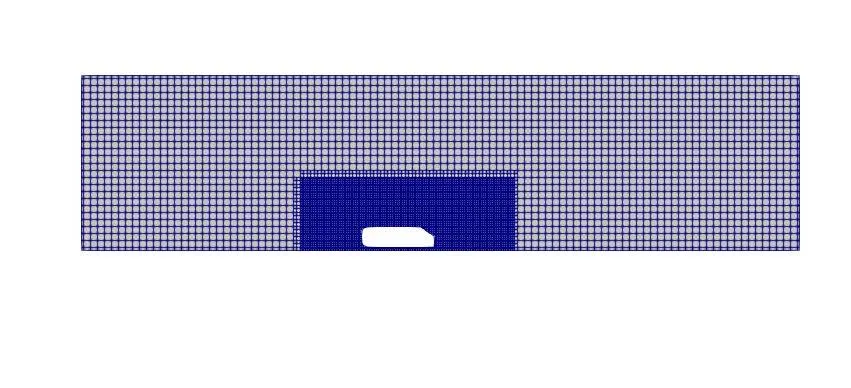
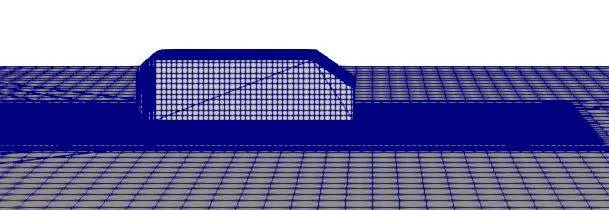
Base grid size(x, y, z)= (0.1 0.1, 0.1)m
Fixed embedding:
9.1 Embedding1
Entity type= box enclosing the Ahmed body
Dimensions(x, y, z)= (3, 0.6, 1)m
Mode= permanent
Scale= 2
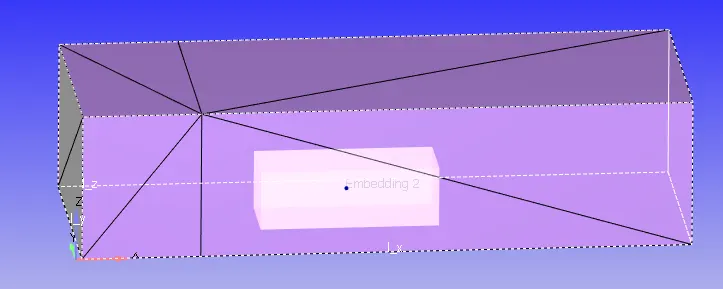
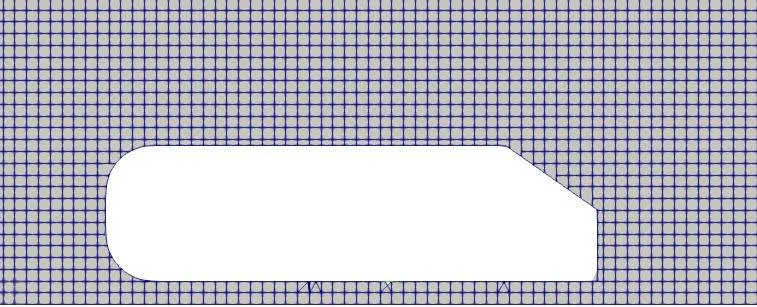
9.2 Embedding2
Entity type= boundary
Boundary ID= Ahmed body
Mode= permanent
Scale= 3
Embed layers= 5
10.Output files:
Wall output= boundaries only
Time interval for writing 3D output data files= 0.01s
Time interval for writing text output= 0.001
Time interval for writing restarting output= 0.01s
The simulation was done in CYGWIN and the post processing done using PARAVIEW.
RESULT
Meshing
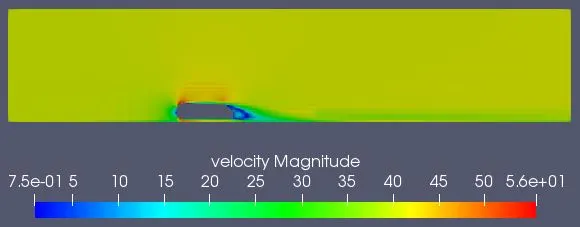
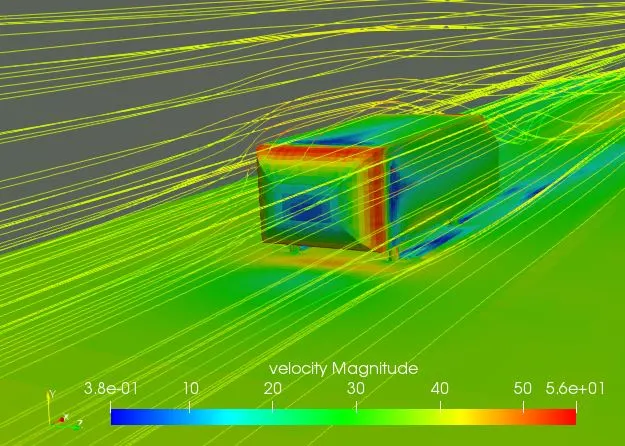
Velocity Contour
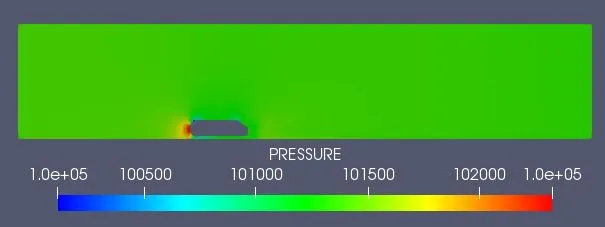
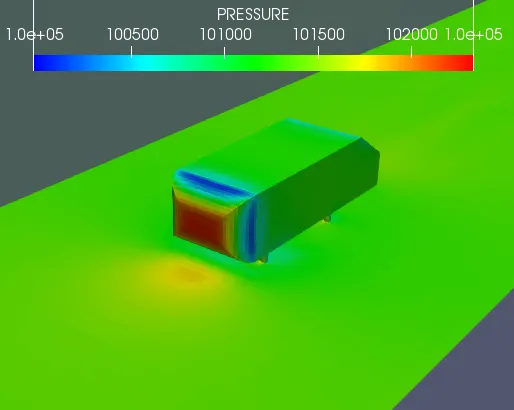
Pressure Contour
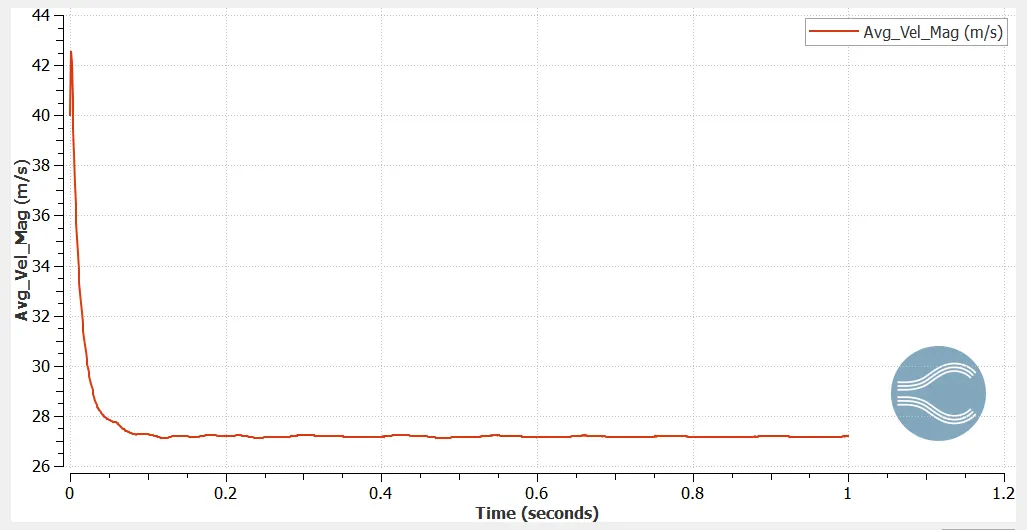
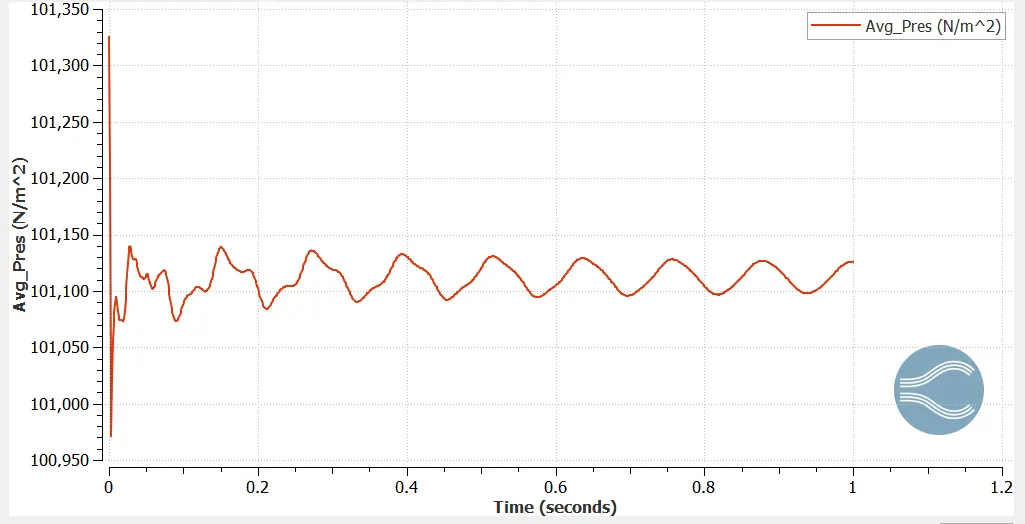
Converge Plots
Plot 1:Velocity plot
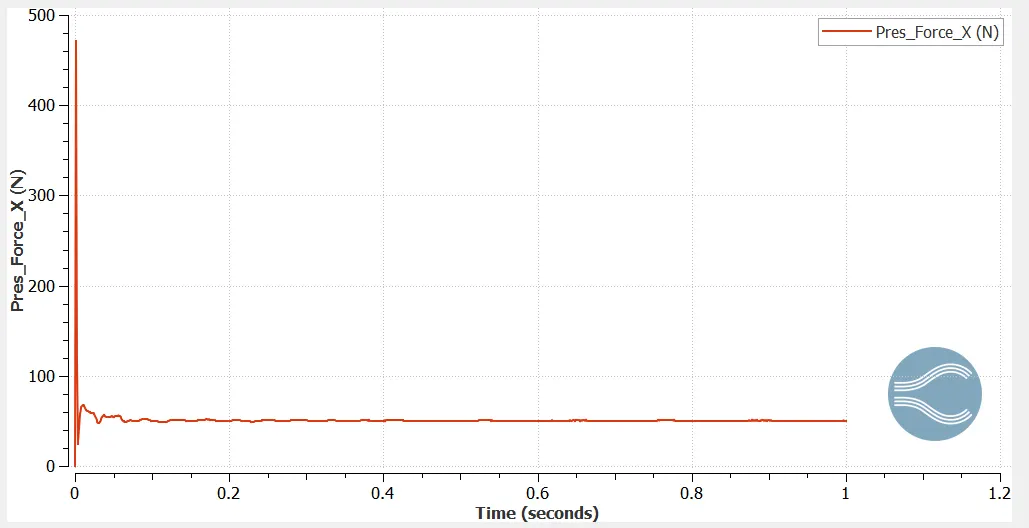
Plot 2:Pressure plot
Calculation of Drag,Lift ,Drag coefficient and lift coefficient
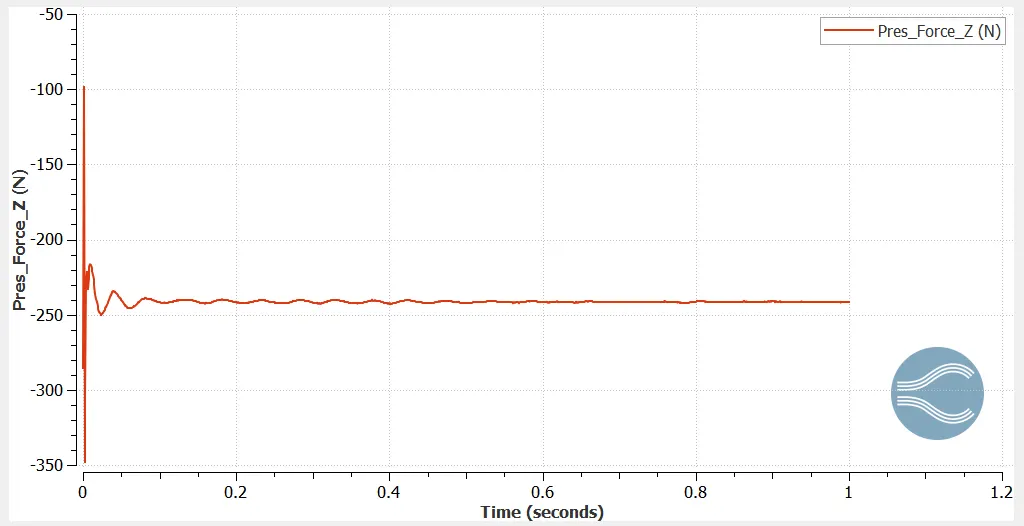
Pressure force along Z-axis isn considered as Lift force
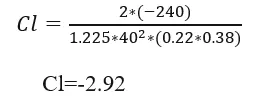
from above graph L=-240N
Coefficient of lift,
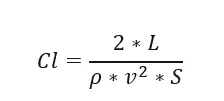
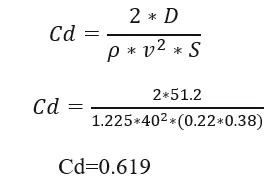
Pressure force along Z-axis isn considered as Drag force
from above graph D=51.2N
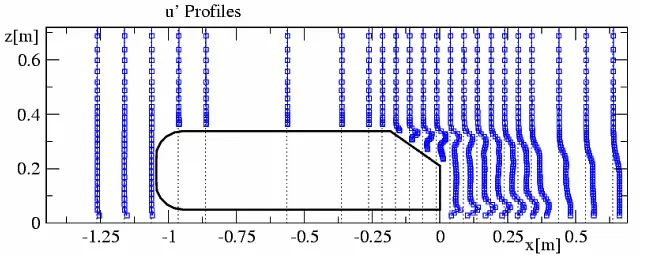
Velocity in X-axis along with different Z location
The Values of experimental data was provided and we need to compare those result with the simulation data obtained.
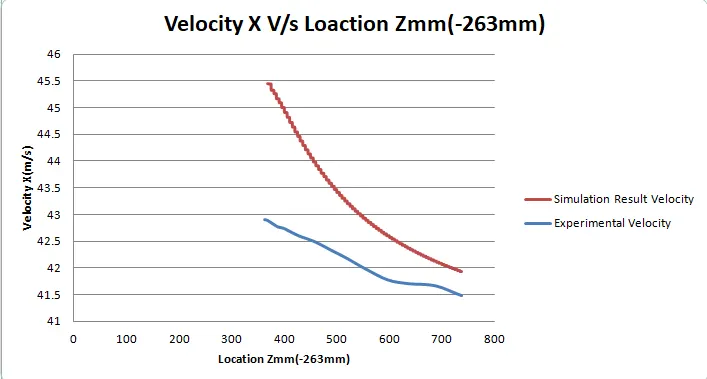
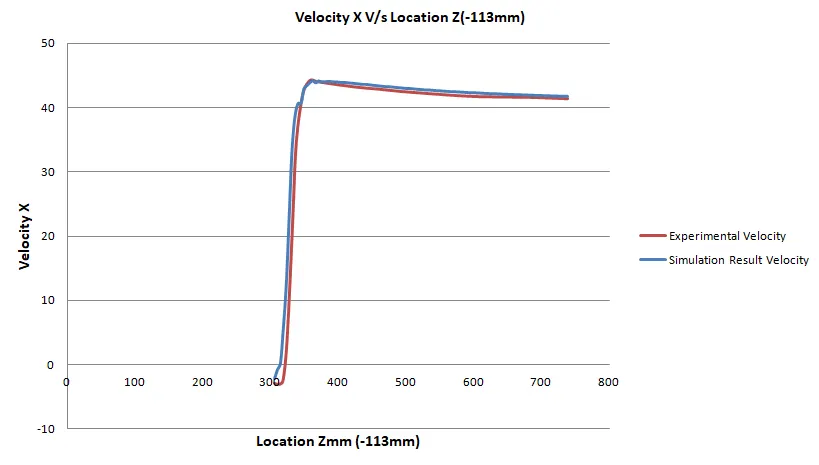
As the probe is near to Top surface of Ahmed Body the velocity is more but less than that of the front surface the kinetic energy of the wind is reduced. The high-pressure layer is formed on the top surface that has high velocity and it reduces means the air disturbance reduces as the probe point up along z-axis.
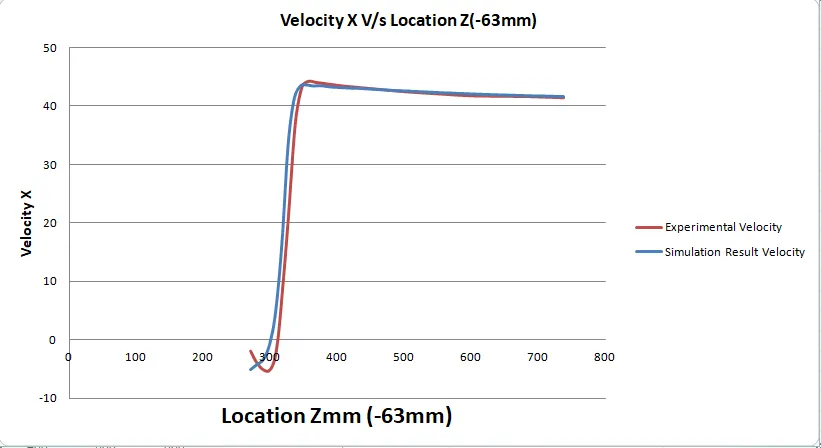
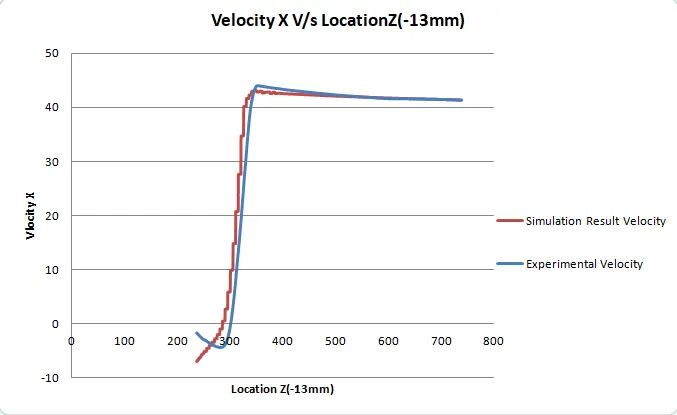
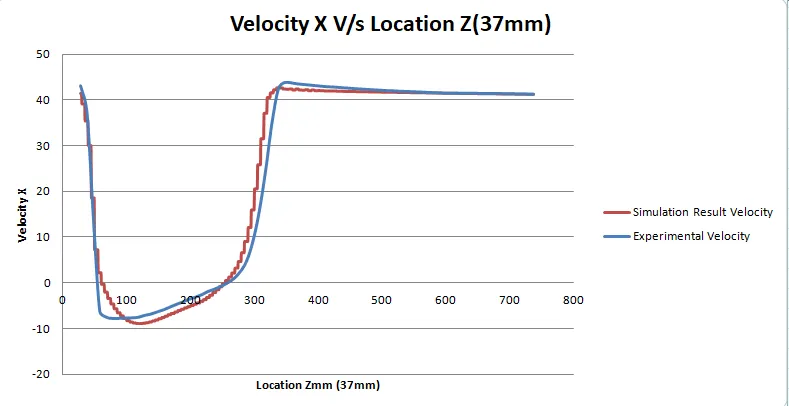
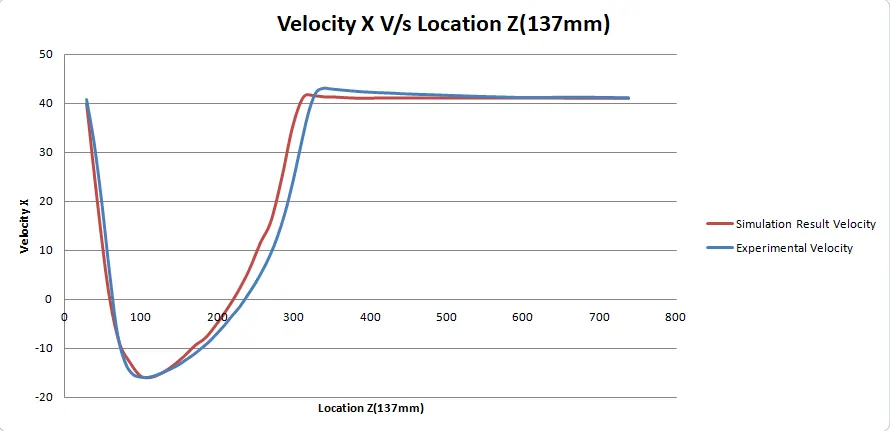
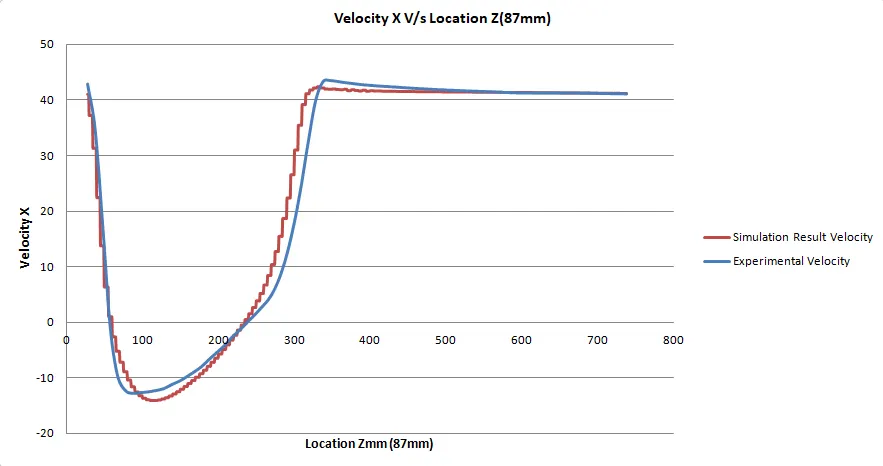
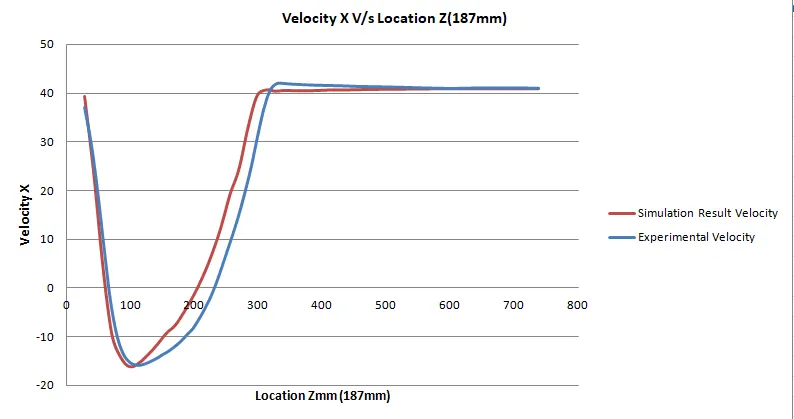
The last 4 Plots represent the region just behind the Ahmed body where there is the formation of the recirculation zone that has low pressure and low velocity. When the probe is just below the Ahmed body the velocity is high, then slowly it approaches the recirculation zone that has low pressure. suddenly after the wakes region finishes the velocity becomes normal.
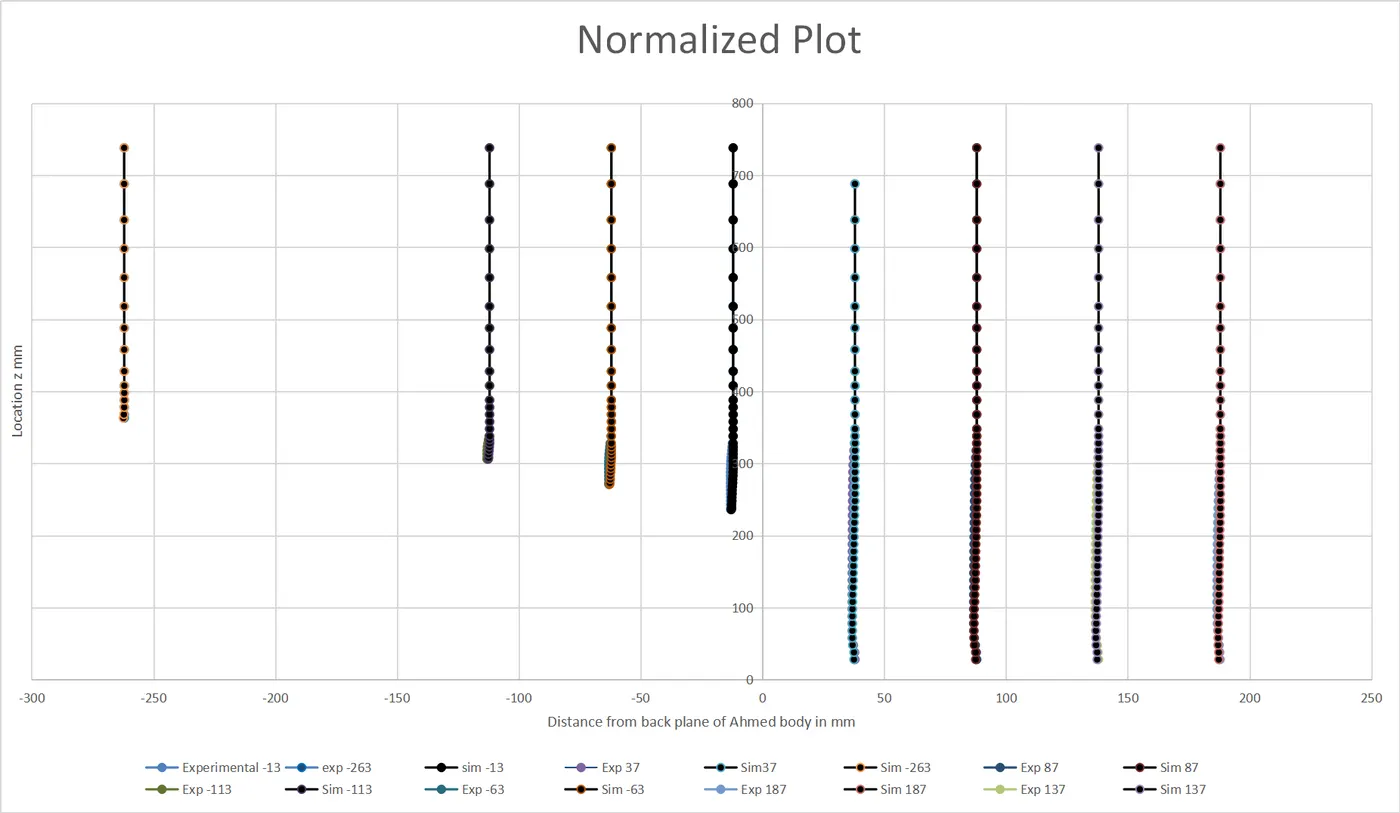
Normalized Plot
Conclusion
*The velocity magnitude can be normalized so as to compare the results obtained by 2 or more lineplots simultaneously on a single plot.
*As the air moves past the Ahmed body, there is a recirculation zone behind the Ahmed body. This is due to a drop in static pressure.
*The surface below to Ahmed's body was kept as the Noslip wall is because we wanted to capture the vicious region. In the Velocity plot, a recirculation plot can be found just behind the Ahmed body where velocity drops and pressure also drops(the region where the slant surface finishes). The Maximum Pressure is found on the front curve surface regions.
*The lift and drag coefficient value calculated using the simulated data was found to be
Cl=-2.92
Cd=0.619