Mathematical Model of a Lead Acid Battery
OBJECTIVES:
- To understand the chemistry and working principle of a lead acid cell/battery
- Examine the charge and discharge curves of a lead acid battery
- Write code to plot those curves
Introduction:
- Lead acid batteries provide the best value for power and energy per kilowatt-hour
- Have the longest life cycle
- Large environmental advantage in that they are recycled at an extraordinarily high rate (97% of the lead is recycled and reused in new batteries).
- Lead acid batteries are commonly used for SLI (starting, lighting, ignition) applications
- In transportation, a billion vehicles worldwide use lead batteries to start their engines and power on-board electronics
- Within the energy sector, lead batteries store renewable energy generated by cleaner, greener sources like wind and solar
- Overall, the dynamic benefits and sustainability of lead batteries make them the smart choice for solving the energy storage needs of today
Working principle of a lead acid cell:
Anode: `Pb + SO_4^(2-) <=> PbSO_4+2e^-`
Cathode: `PbO_2+4H^++2e^(-)+SO_4^(2-)<=>2H_2O+PbSO_4`
Figure (a) demonstrates that electrons flow from the anode to the cathode during discharge, and when a load is connected, those electrons will power it.
Figure (b) demonstrates that when the voltage of the cell has depleted to a point that it needs recharging, electrons flow from the cathode into the anode as an external charger provides that power to force those electrons the other way in order to charge the cell.
Discharge of a lead acid battery:
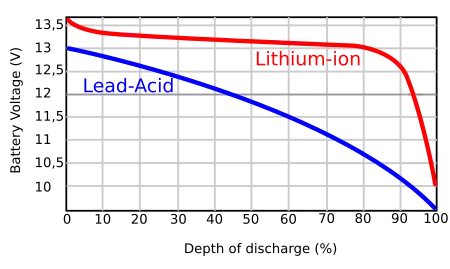
As evident, the relationship between the battery voltage (V) and the depth of discharge (DOD) of a lead acid cell/battery is somewhat a straight line with a negative gradient. Although it is not exactly a straight line, it will be considered a 'y = mx + c' relation for simpler modeling purposes.
Another vital aspect that needs to be considered during the discharge of batteries is the effect of discharge current on total capacity. The figure below demonstrates how the capacity of the battery significantly lowers at a higher discharge rate. This figure is not of a pure lead acid battery but the idea remains the same for all batteries.
Why does this happen?
One thing that needs to be understood is that internal resistance of a battery is not fixed like the resistance of an externally connected resistor would be. The greater the current demand by the load, the more the battery resists that flow of energy. This means more voltage would need to be used to "push" that demanded current out of the battery, which automatically leaves less voltage for the load. If let's say the demanded current is 100A, with every cycle, there will a massive voltage drop within the battery itself, which would just be wasted as heat, hence leaving much lesser voltage over time for the load to use.
CHARGE SUPPLIED `ne` CHARGE REMOVED - and this phenomena is explained by Peukert's law:
Peukert’s law expresses mathematically that as the rate of discharge increases, the available capacity of that battery decreases.
While charge supplied is simply represented as `CS = It`, charge removed is represented as `CR = I^kt`, where k is the Peukert coefficient.
This formula demonstrates that as the discharge current increases, the charge removed increases significantly due to the coefficient 'k'.
It is intuitive to think that the easiest way to rate and understand how long a lead-acid battery would last would be to use the Ah (Amp Hour) rating that is so often designated to them. If a battery was rated at 100Ah, then that was more or less indicative that it would last either 100 hours under a 1 amp load, or 1 hour under a 100 amp load. However, due to the Peukert effect, this is false. If a 100A current was drawn out of a 100Ah battery, it would last for minutes, or even seconds, if the battery is aged or under extreme temperatures. Peukert's law does not account for temperature or age of the battery, so increasing the Peukert coefficient by a small value would be a better approximation of reality.
CODE:
clear all; close all; clc

T = (0:50:500000); %time step of 50 sec - total 10001 values taken
CR = zeros(1,10001); %charge removed
DoD = zeros(1,10001); %depth of discharge
V = zeros(1,10001); %voltage
CS = zeros(1,10001); %charge supplied

I = [2.5,10,20,50,100,200]; %in A
nc = 5; %number of cells - assumed to be connected in series
Cap = 50; %in Ah
H = 20; %rated discharge time in hours
k = 1.045; %peukert's coeff
dT = 50;
R_in = (0.06/Cap)*nc; %internal resistance
E(1) = nc*2.15; %open circuit voltage


for i = 1:length(I)
    V(i) = (E(1) - I(i)*R_in);
    discharge_time(i) = H*(Cap/(I(i)*H))^(k);
    for n = 2:length(T)
        dT(n) = T(n)-T(1);
        Cp(n) = (I(i)^k)*dT(n); %peukert's capacity discharge
        CR(n) = CR(n-1) + Cp(n)/3600;
        DOD(n) = CR(n)/Cp(n);

        E(n) = (E(1) - DOD(n)*(E(1)-1.75));
        V(n) = E(n) - I(i)*R_in;

        if DOD(n) > 0.99
            E(n) = 0;
            V(n) = 0;
        end

        if DOD(n) > 1
            DOD(n) = 1;
        end

        if E(n) > 0
            CS(n) = CS(n-1) + (I(i)*dT(n))/3600;
        else
            CS(n) = CS(n-1);
        end
    end
figure(1); hold on
plot(DOD,V,'--','linew',1.5)
xlabel('Depth of Discharge (DOD)')
ylabel('Voltage (V)')
end

plot(DOD,E,'g--','linew',1)
title('V vs DOD of Lead Acid Battery')
legend('2.5A','10A','20A','50A','100A','200A', 'Open Circuit Voltage')
set(gca,'fontsize',8)

figure(2)
plot(DOD,V,'k--','linew',1.5)
hold on
plot(DOD,E,'r--','linew',1.5)
xlabel('Depth of Discharge (DOD)')
ylabel('Voltage (V)')
title('V vs DOD of Lead Acid Battery')
legend('Voltage at 200A', 'Open Circuit Voltage')
set(gca,'fontsize',8)

figure(3)
line([0 discharge_time(1)],[E(12) 0],'linewidth',1.5,'color','m')
hold on
line([0 discharge_time(2)],[E(48) 0],'linewidth',1.5,'color','k')
hold on
line([0 discharge_time(3)],[E(96) 0],'linewidth',1.5,'color','g')
hold on
line([0 discharge_time(4)],[E(240) 0],'linewidth',1.5,'color','r')
hold on
line([0 discharge_time(5)],[E(480) 0],'linewidth',1.5,'color','b')
hold on
line([0 discharge_time(6)],[E(960) 0],'linewidth',1.5,'color','[0.5 0 0]')

xlabel('Discharge time (hours)')
ylabel('Voltage (V)')
title('Effect of discharge current on capacity')
legend('2.5A (1C)','10A (4C)','20A (8C)','50A (20C)','100A (40C)','200A (80C)')
grid on
set(gca,'fontsize',9)
OUTPUTS:
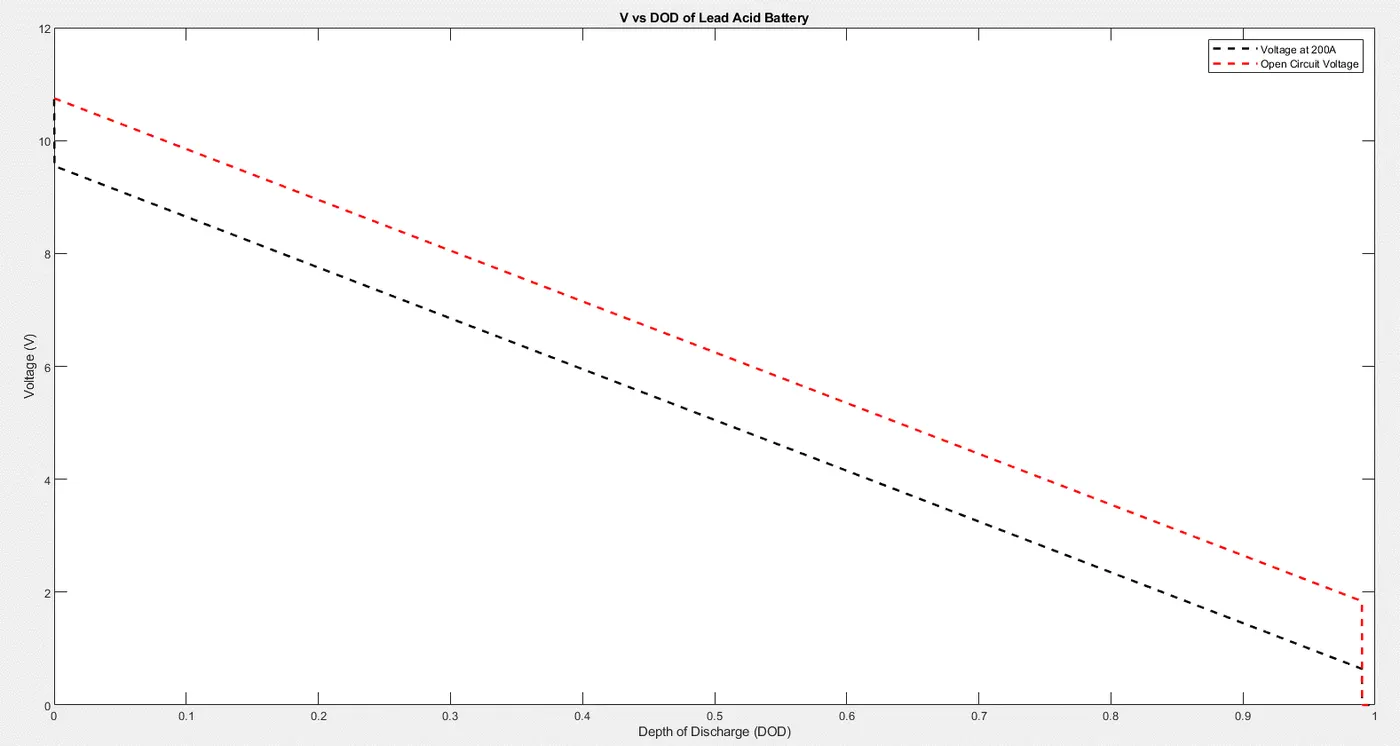
- 5 cells have been assumed to make up this lead acid battery, and they are assumed to be connected in series as to multiply the voltage. A single cell provides an EMF of 2.15V
- The voltage at 200A is reduced from open circuit voltage of 10.75V (2.15 x 5) to 9.55V due to the Peukert's effect
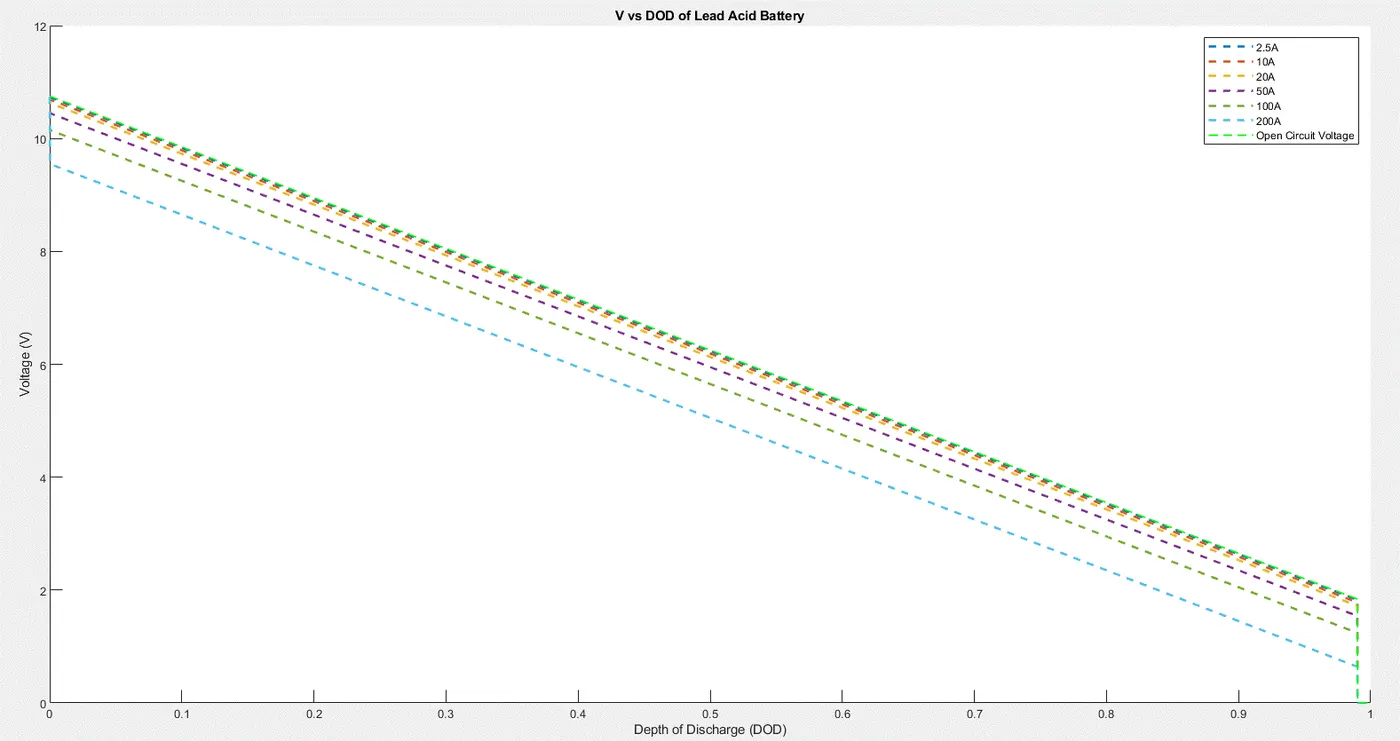
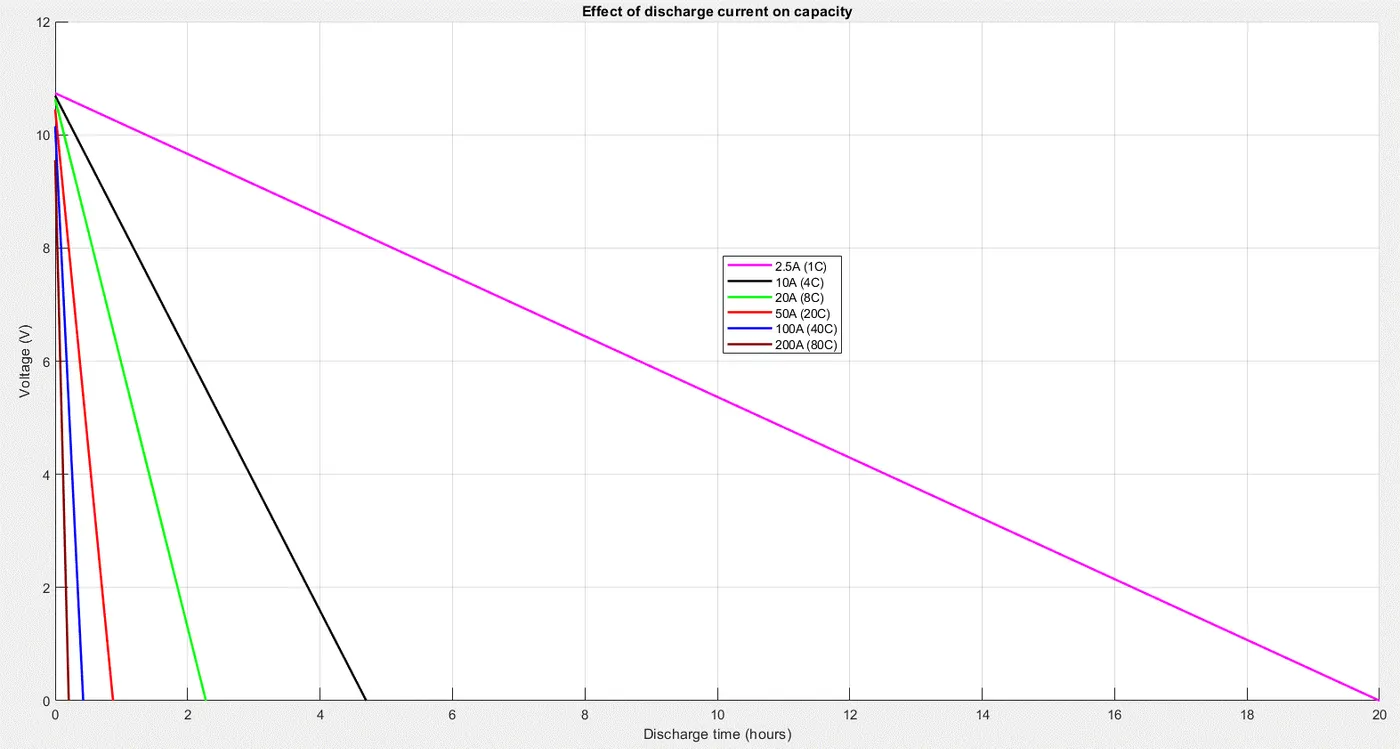
- The above two figures show the effect of discharge current on total capacity. As the discharge current increases, the starting voltage available reduces, as is seen in the V vs DOD figure with multiple current discharges.
- The V vs Discharge time figure shows the same effect with respect to lasting duration of the battery. If discharged at a higher rate than 1C, which will give a rated discharge time of 20 hours typically, the battery will last for a very short while relatively.