Independent Research Project
2D Cavitation simulation
Objective :
To simulate the case for Winkl Hoffer Nozzle to study Cavitation. And compare the result for different pressure differences
- Case 1: Set up the case for a Pressure difference of 30 bars
- Case 2: Set up the case for a Pressure difference of 70 bars
- Case 3: Set up the case for a Pressure difference of 100 bars
Theory:
Cavitation is a phenomenon in which rapid changes in pressure in a liquid lead to the formation of small vapour-filled cavities, in places where the pressure is relatively low.
layman's terms:
Basically, Fluids behave differently under different pressures. Its state is given by the phase diagram as.
Experienced example: so when we hear a rattling noise from the pipes when the fluid is flowing through them at high speeds its because of cavitation that these bubbles are formed and when they explode they create pressure waves and a rattling noise is created.
The science behind it:
When the high velocity flowing fluid encounters a sudden change in the area which gives to pressure difference,so when this pressure reduces below the static pressure of the fluid, the phase and bubbles of the fluid change are formed. These bubbles occupy almost 5000 times the space needed for a fluid. So in this condition, they even collide with each other creating noise. so when the flow of these bubbles goes further again into the high-pressure region a microjet due to high-pressure surrounding impinges into these bubbles exploding them, furthermore, these microjets even collide with the walls of our system damaging them.
The effect of cavitation can be seen over a period of time.
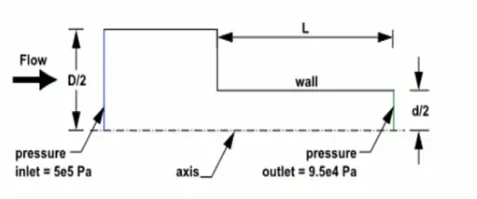
Geometry& boundary flagging :
To save up the computation time the sidewalls were set as 2d walls
As the geometry was symmetry only half of it was simulated to save computation time.
Meshing:
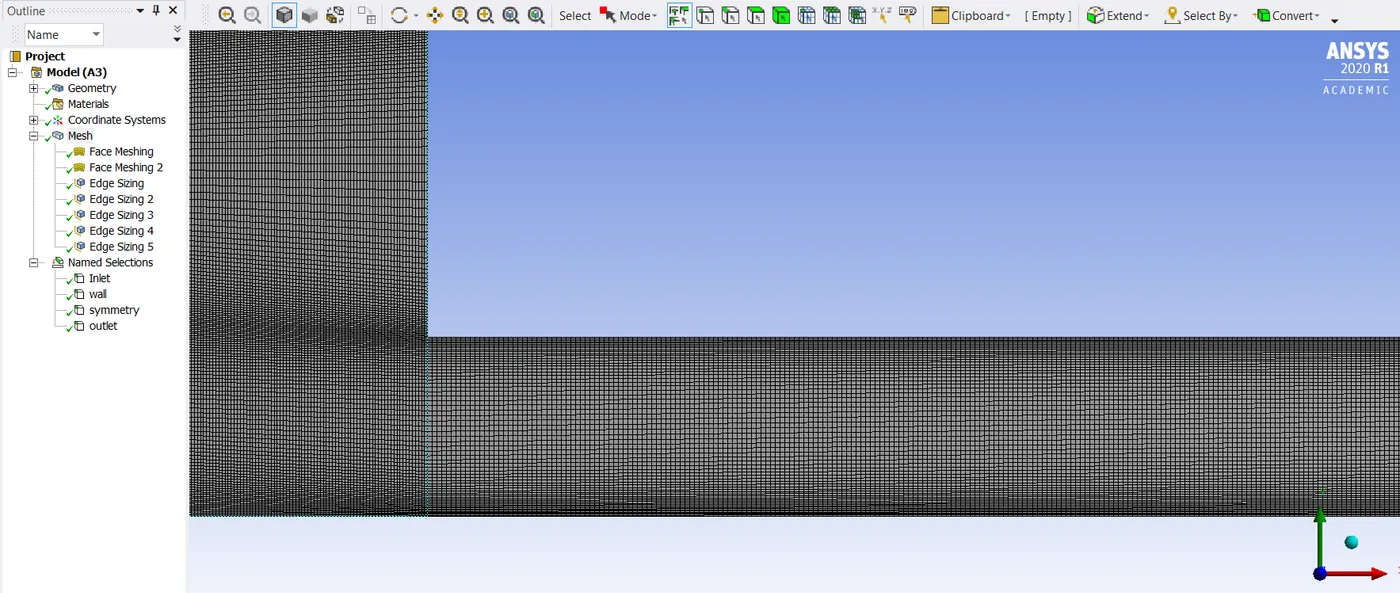
The structured mesh was created using face meshing and giving edge sizing for getting accuracy and capturing cavitation effectively mesh sizing at boundaries was kept fine
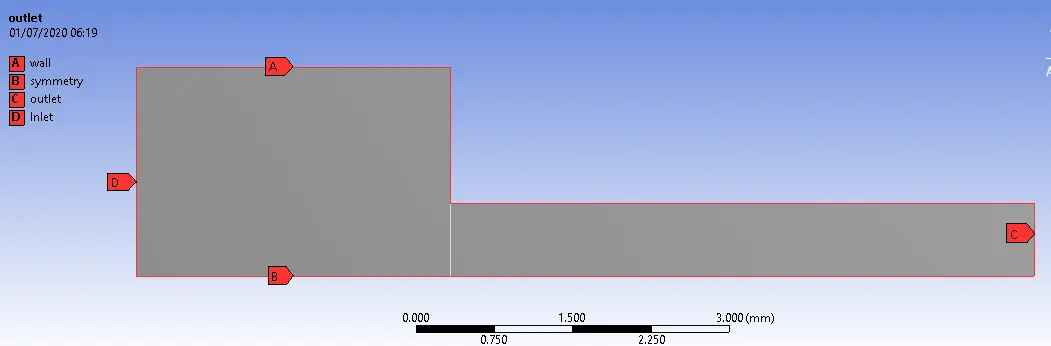
Boundary name assigned:
Case setup:
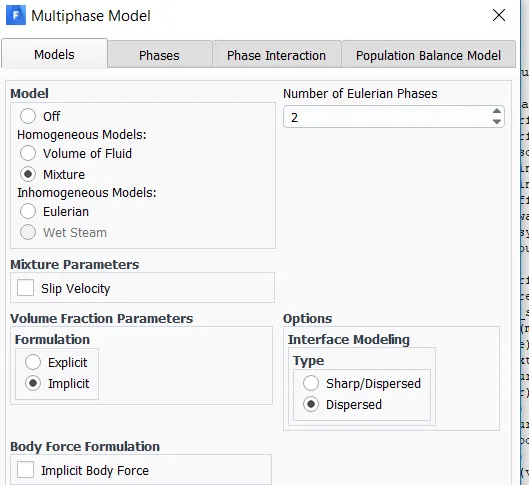
- Setting the multiphase model to mixture & setting participating phases to 2
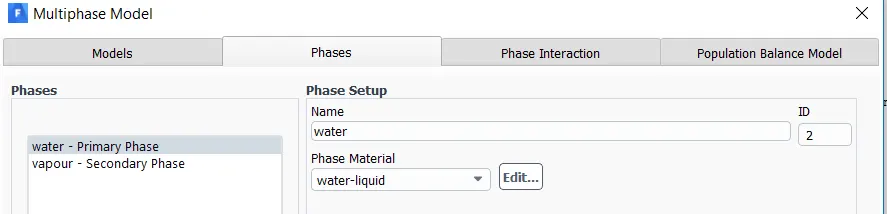
2. setting the primary and secondary phases to water liquid and water vapour.
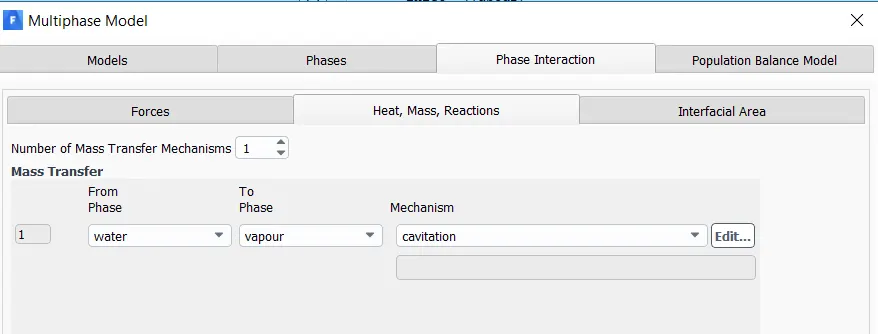
3. specifying phase interaction and selecting mass transfer mechanism as cavitation.
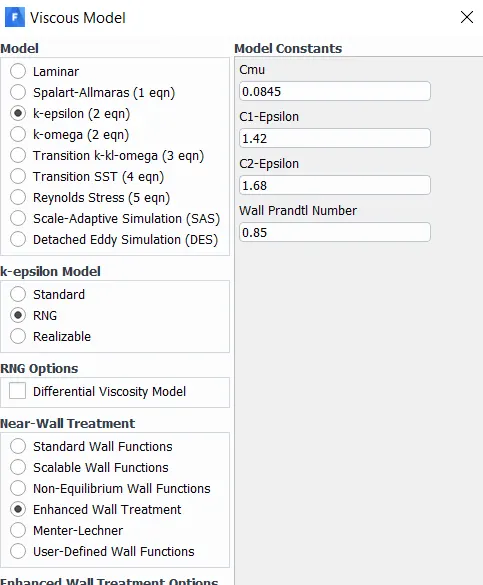
4 . Select the viscous model.
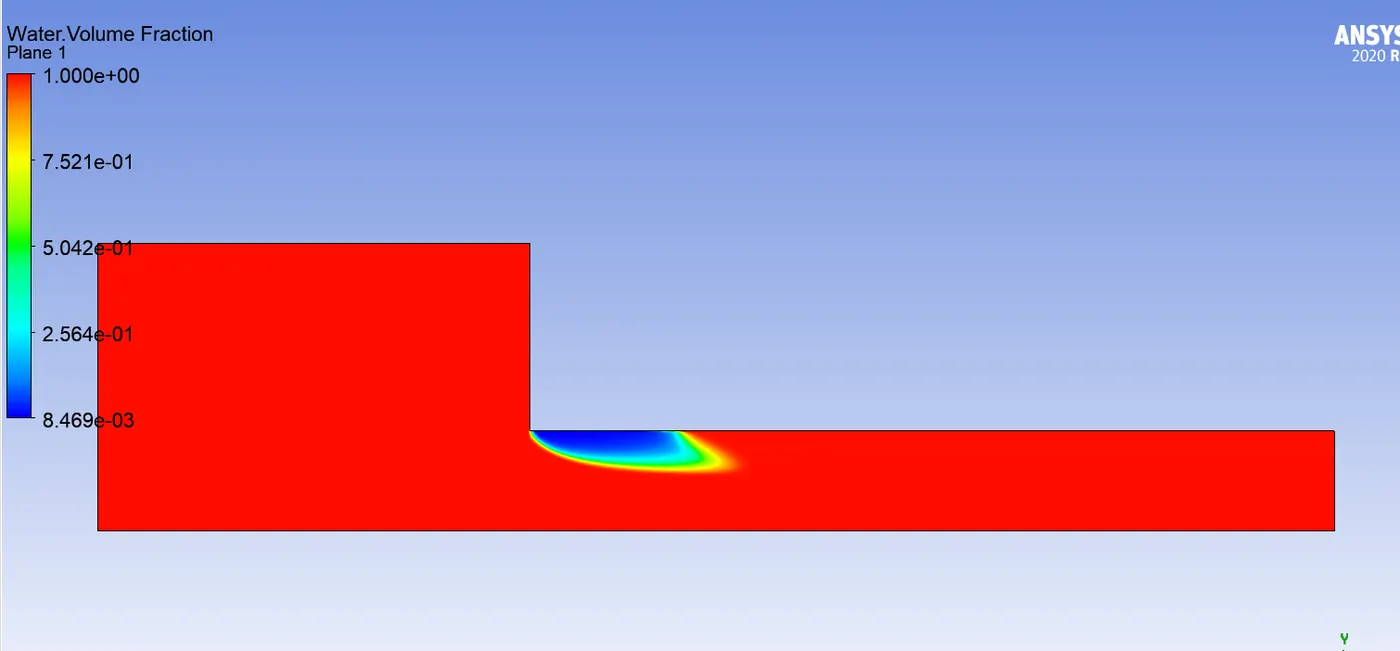
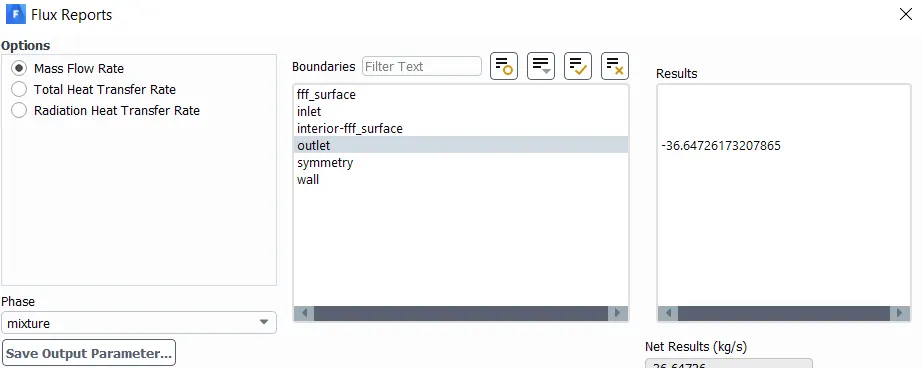
- Case 1: Set up the case for a Pressure difference of 30 bars
Velocity contour :
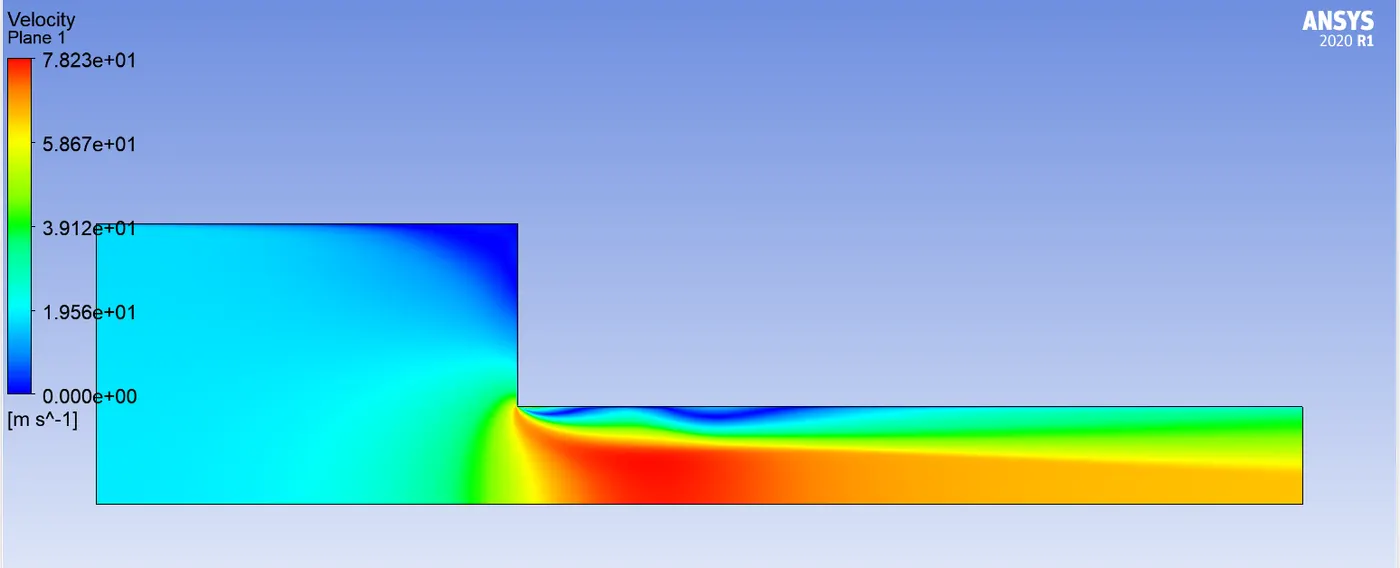
Water volume fraction:
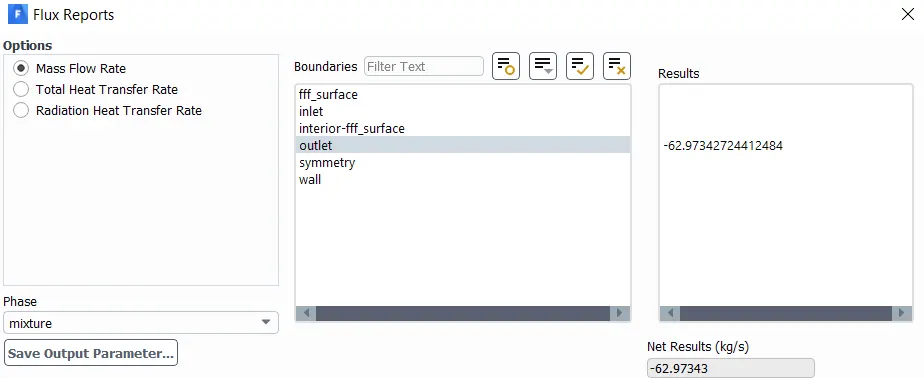
mass flow rate at outlet:
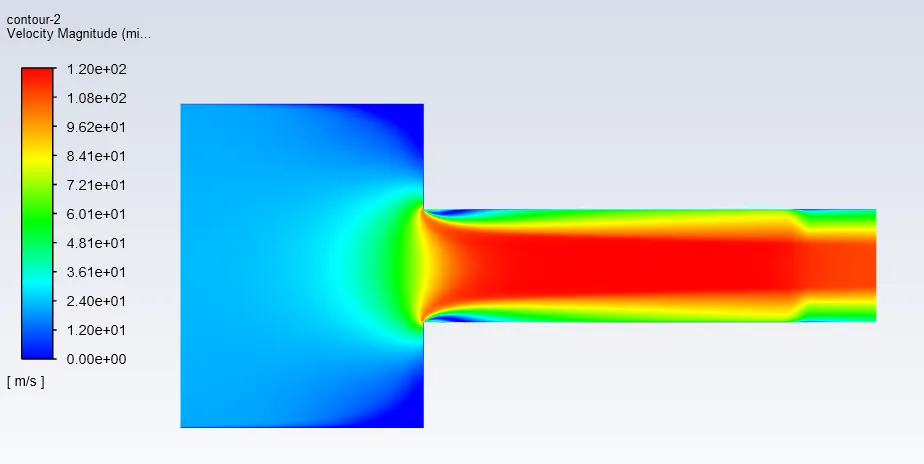
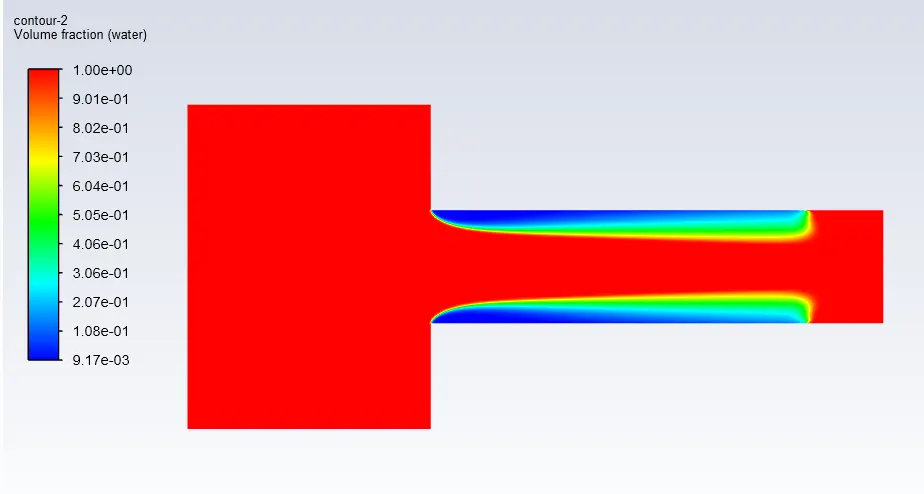
- Case 2: Set up the case for a Pressure difference of 70 bars
Velocity contour :
Water volume fraction:
mass flow rate at outlet:
Case 3: Set up the case for a Pressure difference of 100 bars
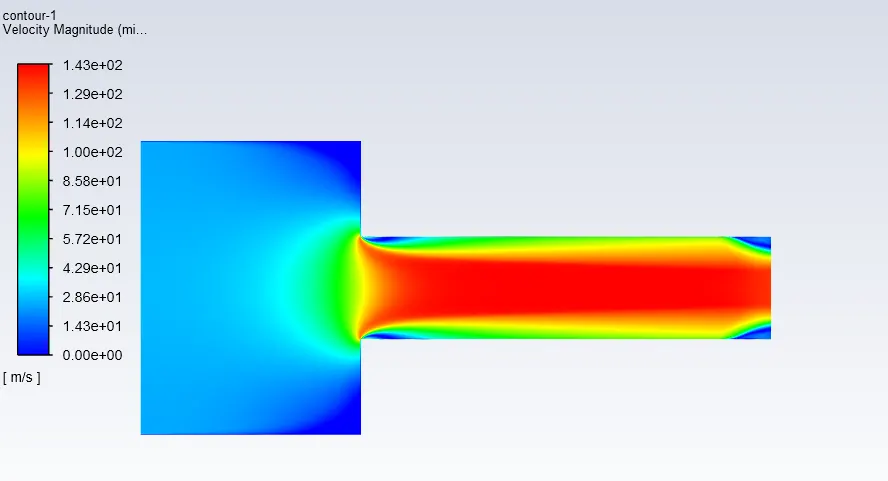
Velocity contour :
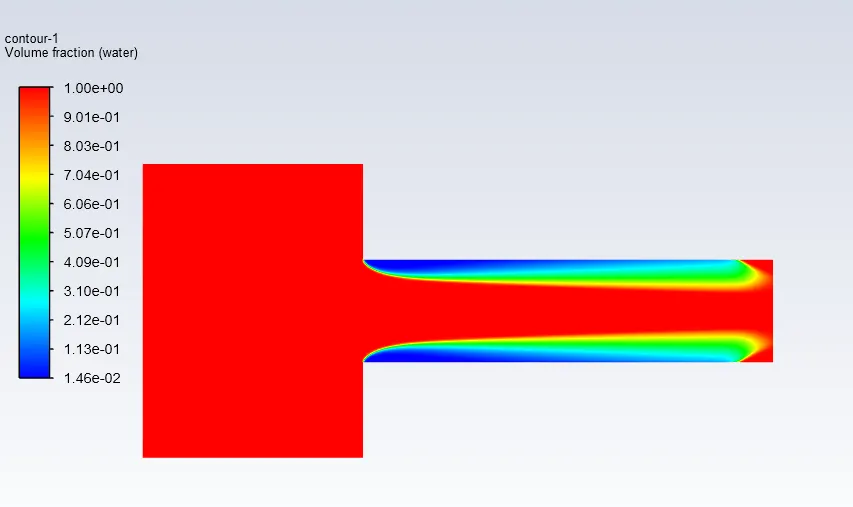
Water volume fraction:
mass flow rate at outlet:
A mass flow rate of around 84 kg/s was observed
(Note: Due to cavitation and re-mixing of bubbles with the flow the outlet mass flow rate has fluctuations, which is a major problem faced with the design of injectors. So every value specified for all the above cases is averaged,we can see the behaviour in the mass flow rate curve & in the animation attached for 100bar difference)
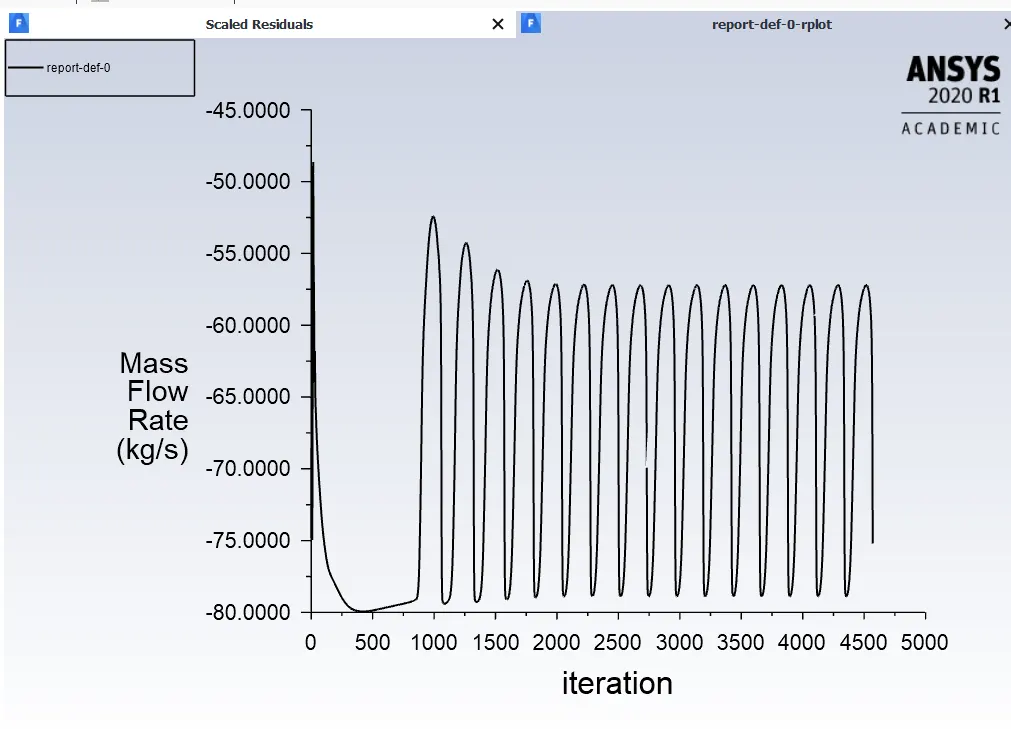
(To capture to varying mass flow effect the 3rd case was run in transient condition with a time step size of 0.0005s)
(In the animation we can see due to cavitation there is a varying velocity effect observed at the end of the injector which is not good for any engine as it alters the desired air-fuel ratio.)
Conclusion:
- As pressure difference increases cavitation zone length increases.
- Due to cavitation, we observe fluctuations in mass flow rate.
- The mass flow rate at the centre is highest and approaching the walls it decreases.
- More cavitation can shorten the life of the injector moreover uneven mass flow rates are not desirable for engine performance.