Fuel cell powered model
OBJECTIVES:
- Explain the working priniciple of a fuel cell model
- Simulate the built-in model '6 kW 45 Vdc Fuel Cell Stack' and explain the results
- Explain the voltage and current characteristics in the resultant graph
What is a fuel cell (FC) and how does it work?
A FC is an electrochemical cell that converts the chemical energy of a fuel (usually hydrogen) and of an oxidizing agent (usually air or oxygen) into electricity through redox reactions.
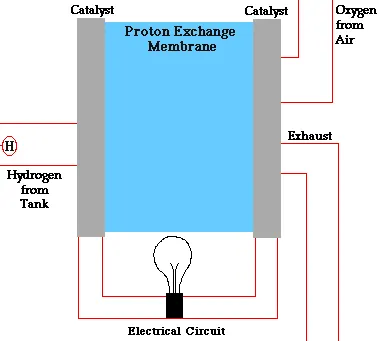
As can be seen in the GIF above, hydrogen comes through the anode side of the fuel cell. As the hydrogen hits the catalyst layer of the anode, it separates into ions and electrons. While the hydrogen ions travel through the electrolyte towards the cathode, the electrons travel through the external circuit, meet the hydrogen ions back at the cathode, combine and are back to a hydrogen molecule. Simultaneously, oxygen flows into the cathode, combines with the hydrogen, and the byproduct of water is released through the exhaust. Those electrons that travel through the external circuit are what generate that electricity.
Anode: `H_2->2H^++2e^(-)`
Cathode: `2H^++2e^(-)+1/2O_2->H_2O`
- FCs are an excellent option to reduce the usage of ICE cars or even EVs, both of which pollute the environment, with the former being a more significant contributer to air and environmental pollution.
- The byproduct of hydrogen FC (currently the most common type) is only water, and they can also operate at higher efficiencies than combustion engines.
- FCs work like batteries, but do not need any recharging. They will produce electricity as long as fuel is supplied, which might give them an edge over batteries in the long run, as the one of the main problems with BEVs among customers is the waiting and recharging time. Hydrogen or other fuels can be supplied to FC vehicles in the same way petrol and diesel are supplied to ICE or HEVs, signigicantly improving customer convenience.
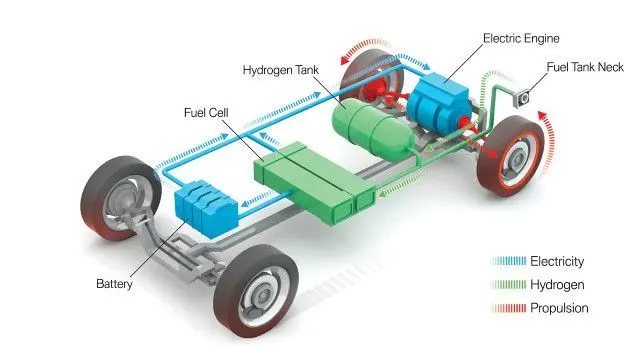
- Since FCs have low power density, they will not be sufficient during high power demand. Therefore, FCs need to be combined with ultracapacitors or batteries to form a complete powertrain (see figure below). The battery pack, however, can be of substantially lower capacity, as it won't need to act as the primary source and only would need to be operated during short power bursts.
6 kW 45 Vdc Fuel Cell Stack Model:
Fuel Cell Stack:
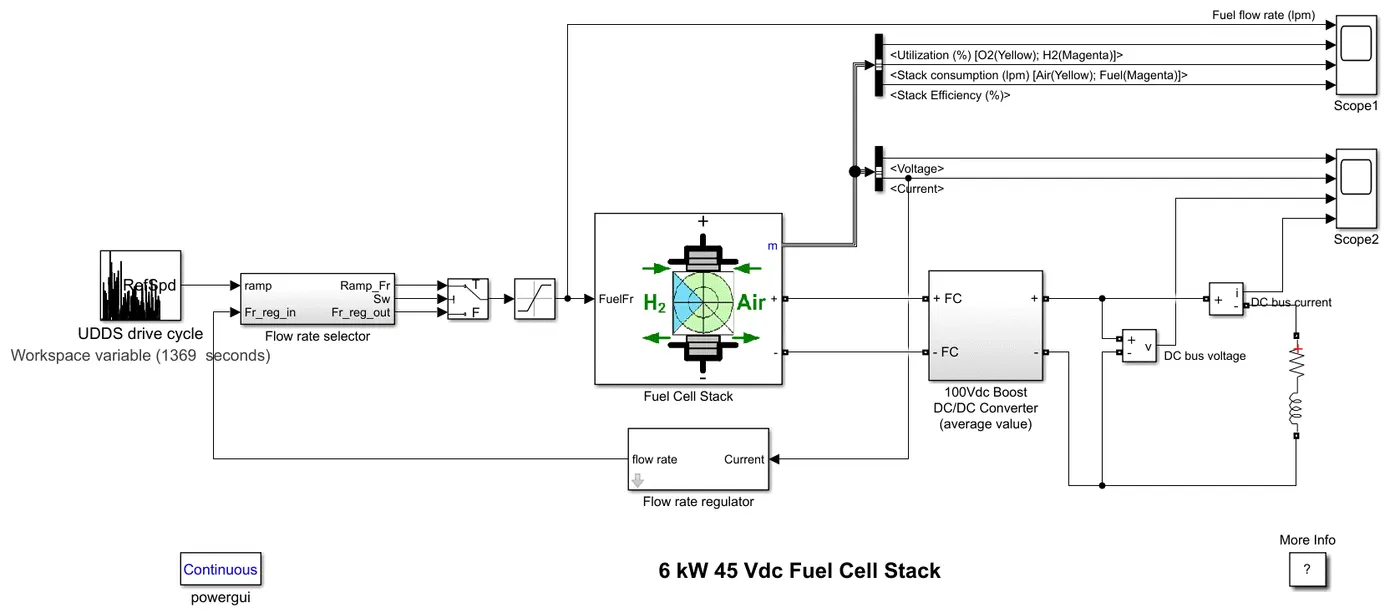
A Proton Exchange Membrane Fuel Cell (PEMFC) stack has been chosen that is capable of providing 6kW of power and 45Vdc. The RL load demands a voltage of 100Vdc, therefore a boost converter needs to be used.
Boost DC/DC converters: how do they work?
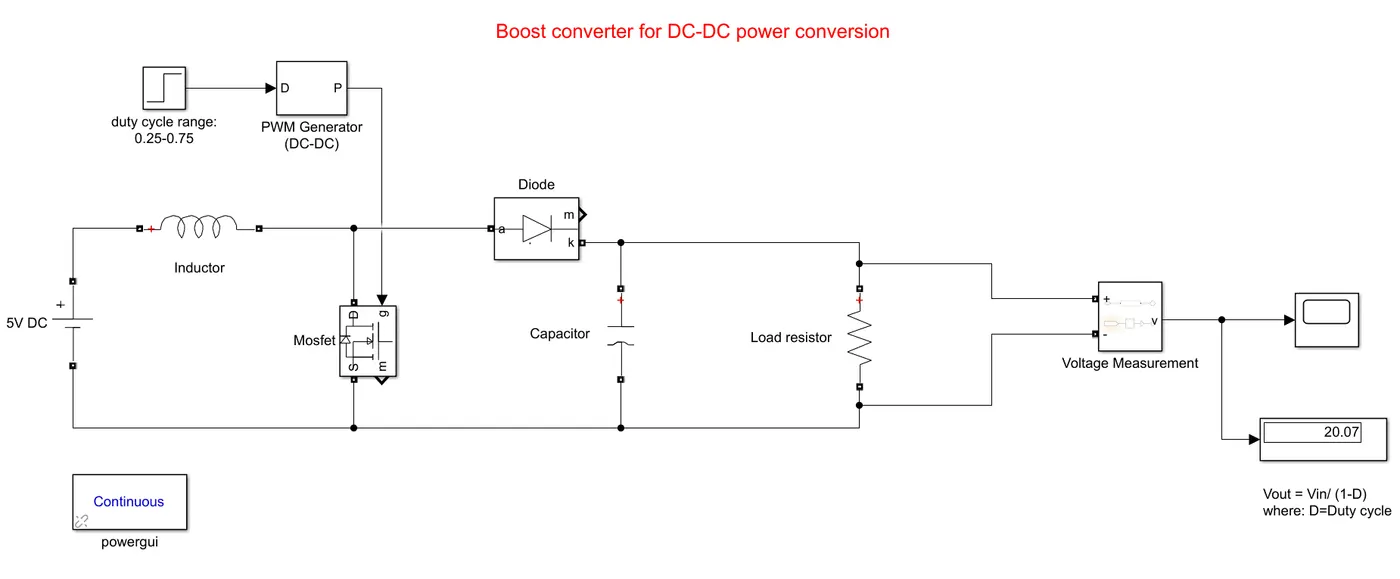
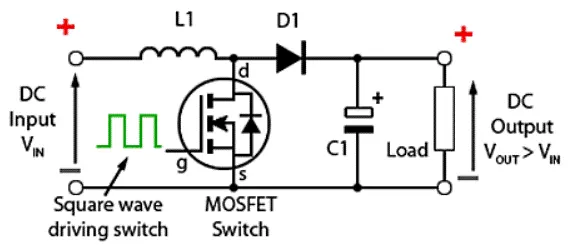
In order to understand the entire circuit, the roles of inductor and capacitor are crucial:
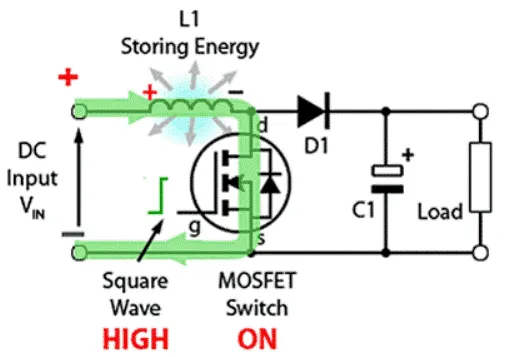
- Referring to figure 1 above, when the FET switch is ON during the positive half cycle of the DC wave, current flows through the inductor. An inductor is a coil of wire through which current flows, hence inducing a magnetic field that stores energy `V_L`.
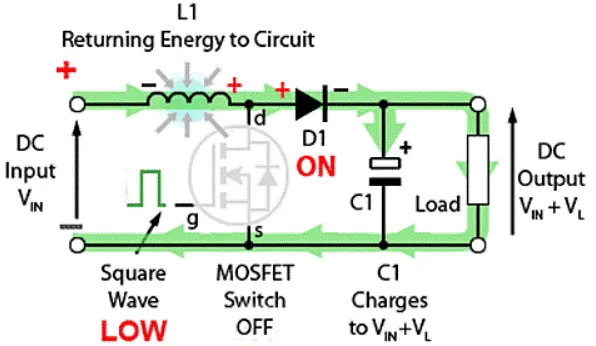
- During the negative half cycle when the FET switch is OFF, there is nothing to hold the induced magnetic field in place, since no new current is flowing through the inductor anymore. The induced magnetic field starts to diminish, and starts to release the stored energy `V_L` (change in field flux in a coil of wire induces current flow). Now current flows to the capacitor (an element that stores energy) and the load, charging the capacitor with `V_(IN) + V_L`. The output voltage across the parallelly connected load is also measured as `V_(IN) + V_L`.
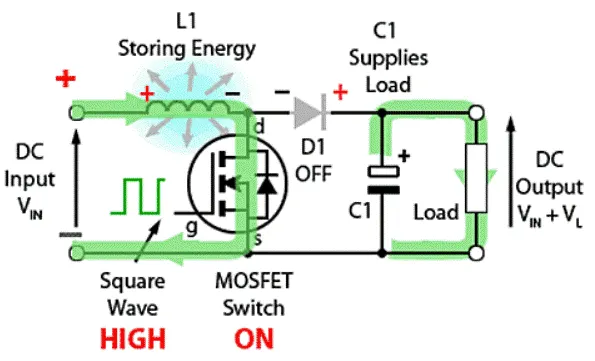
- Once the second period starts and the FET switch is ON again, the capacitor releases its energy to increase the potential difference across the load. Due to the diode, the capacitor cannot discharge its energy towards the inductor and all of it flows towards the load.
- This process keeps on repeating as the FET switch is turned on/off multiple times in a single second, and this is how `V_(IN)` gets boosted to `V_(IN) +V_L` for every cycle, until voltage limit is reached for the load.
Flow rate regulator and flow rate selector:
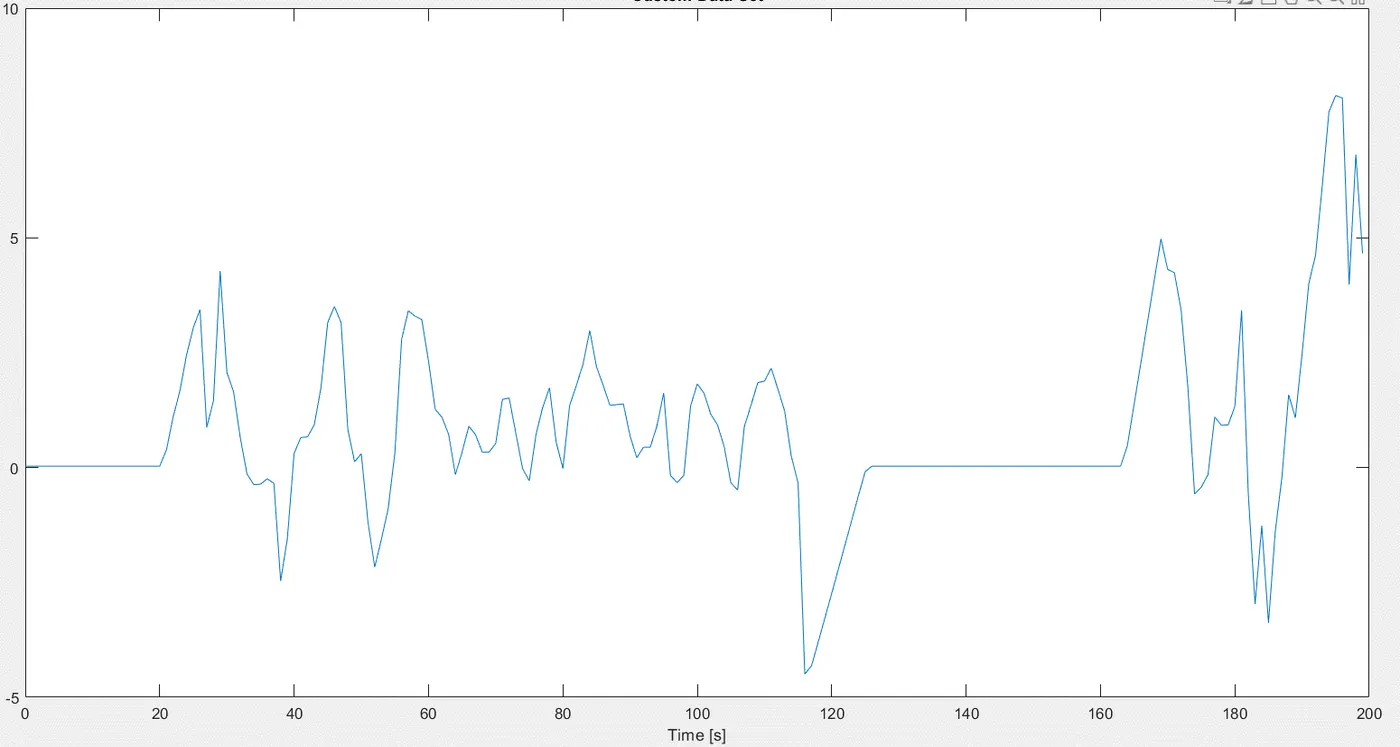
This is used to control the flow rate of fuel into the fuel cell. It takes the feedback of how much current the fuel cell is producing and decides the flow rate accordingly. This is then fed into the flow rate selector. A reference input of the UDDS drive cycle (current vs time) has been given as a modification to the model for better analysis, as the original model only had a ramp block that was ramping up the flow rate by 10. The drive cycle is originally for 1369 seconds, but running it for 200 seconds will be sufficient for analysis needed for this project.
UDDS drive cycle: current vs time
Results:
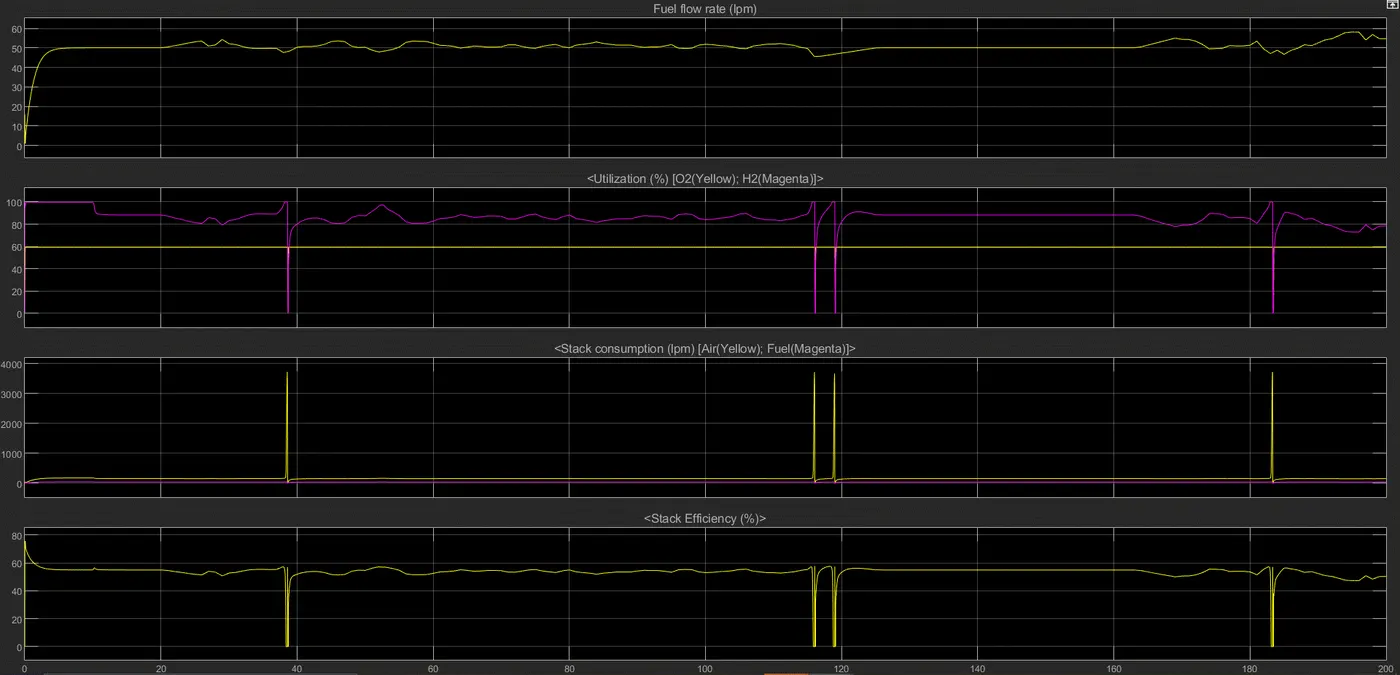
- Fuel flow rate: this is constant at about 50 lpm until 20 seconds, because as can be seen in the UDDS drive cycle, the car is at rest until then too. The fuel cell must be receiving a standby flow rate of 50 lpm everytime it is at rest, to perhaps prepare the vehicle for propulsion post its resting period. This can also be seen from 125 sec to 165 sec, where the flow rate is a constant 50 lpm as the vehicle is at rest. Everytime the vehicle needs to accelerate, the flow rate increases. Likewise, as the vehicle needs to decelerate, the flow rate reduces.
- Fuel utilization: the most noticeable observation is that oxygen has minimal fluctuations and is constantly at about 60%. This could possibly be because the fuel cell demands a standby supply of oxygen so that the byproduct can be formed harmlessly. If oxygen is insufficient, it could result in incomplete combustion, thus releasing pollutants. Everytime the vehicle is accelerated, more hydrogen will be utilized. Drastic changes in hydrogen utilization can be seen right before 40 sec, twice before 120 sec, and once at 185 sec. This is due to the fact that there is drastic deceleration and hard braking is done, which is also reflected in the drive cycle (current is flowing in the negative direction). So during drastic deceleration there is no need for any fuel usage, which is why hydrogen falls to 0% during those instances. It can't be seen in the graphs until zoomed in, but at these points oxygen utilization also falls to zero, which makes sense because without the presence of hydrogen, oxygen has no usage.
- Stack consumption: this shows the amount of fuel and oxygen that is consumed from the stack. The fuel flow rate is pretty stable throughout the cycle, and so is the utilization of fuel, which goes to show the stable nature of the consumption of hydrogen. Oxygen on the other hand, as is seen on the other graphs too, has its drastic changes at some points. At all the instances where there is rapid deceleration, oxygen is consumed from the stack but is not utilized as there is no hydrogen available to combust to produce water.
- Stack efficiency: this graph is identical to the fuel utilization graph in the sense that efficiency decreases to 0% as soon as there is rapid deceleration, which is because fuel isn't being utilized so efficiency cannot be determined. Other than that, efficiency lies a little below 60%
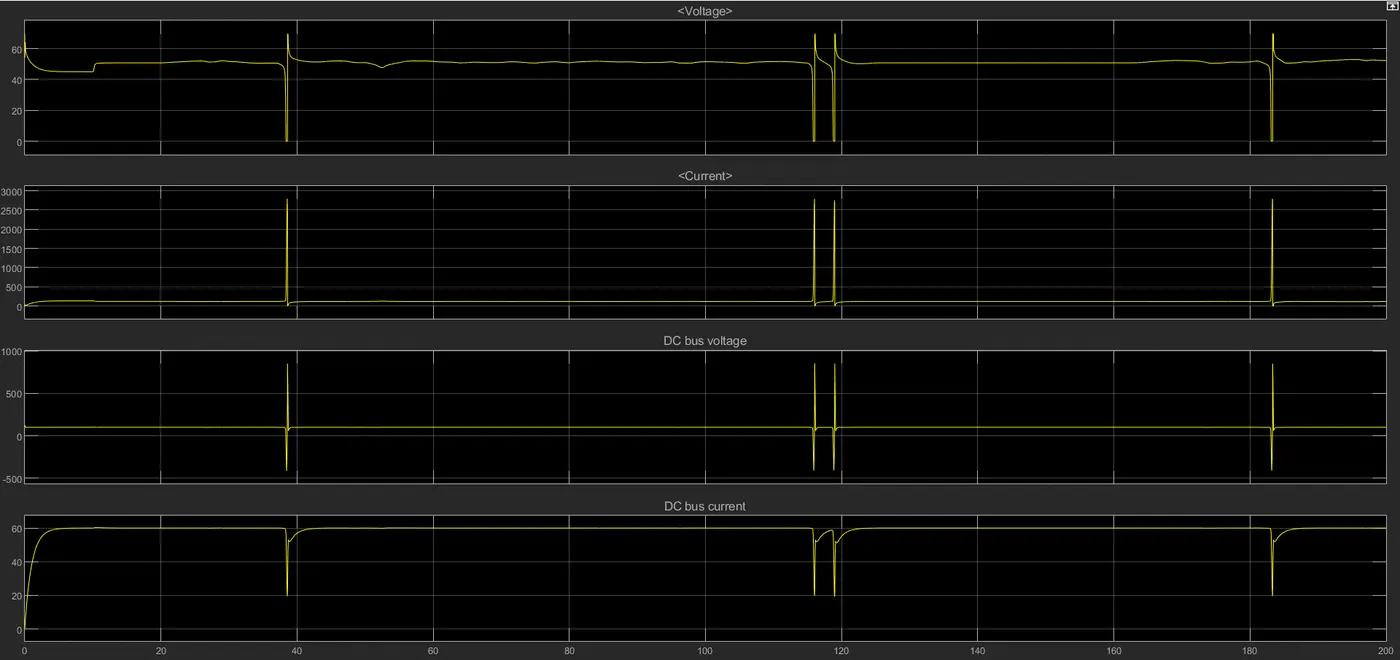
- Voltage: the fluctuation in the voltage is explained by the motion of the vehicle. All those voltage spikes are due to sudden acceleration and sudden deceleration. When there is sudden acceleration, the voltage goes up to about 70V and when there is sudden deceleration, the voltage goes down to 0
- Current: exactly the opposite of voltage graph i.e. when voltage drastically increases, current drastically decreases, and vice versa. This must be the case because a constant power output of 6kW is to be produced (P = VI) by this fuel cell.
- DC bus voltage: this showcases the output voltage after the boost converter has been in operation, which is why the voltage is at a constant 100Vdc with a few fluctuations that are identical to the voltage graph due to the sudden changes in speed of the vehicle
- DC bus current: this showcases the output current after the boost converter has been in operation. The boost converter is responsible to boost the voltage, which means the output current will be reduced by the same factor to keep power output constant. As seen in the current graph, it is constantly at about 130A with fluctuations at instances, and after going through the boost converter it has fallen to 60A.
V-I characteristics of fuel cell stack:
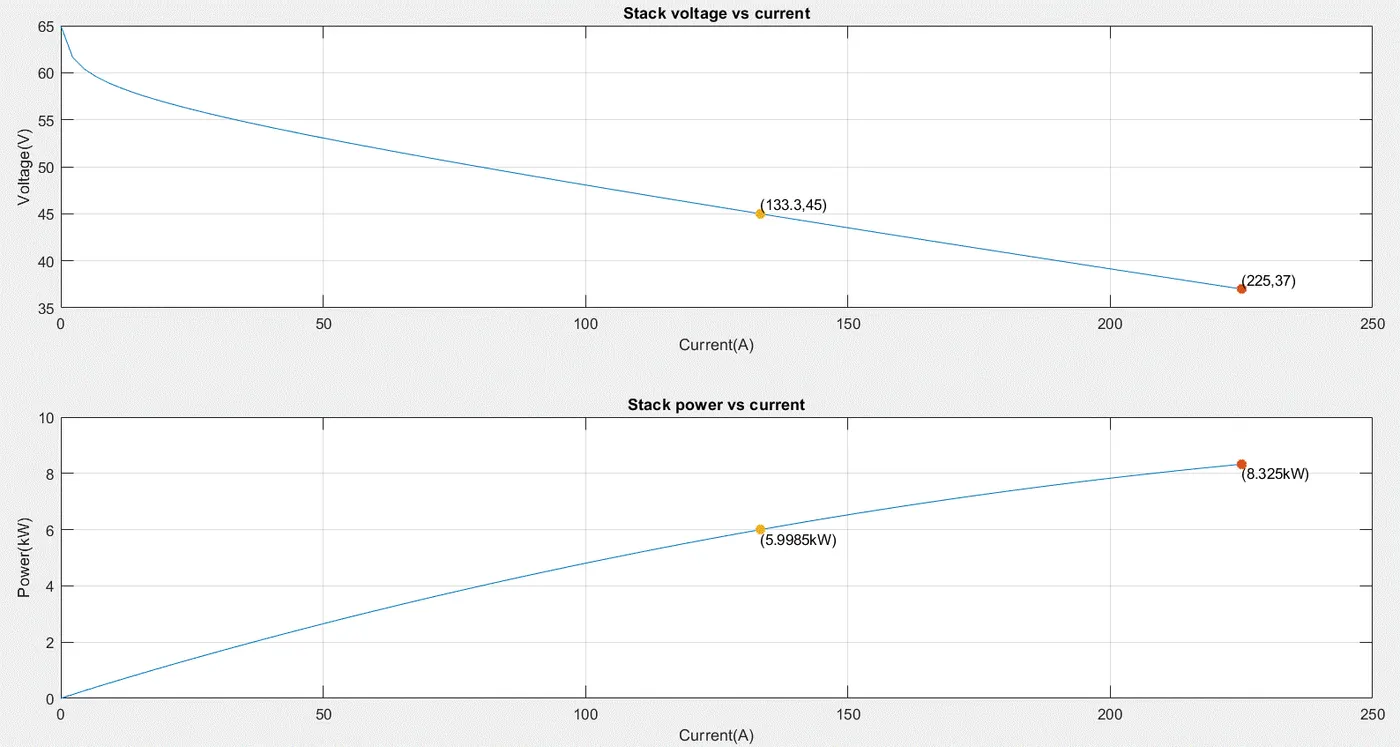
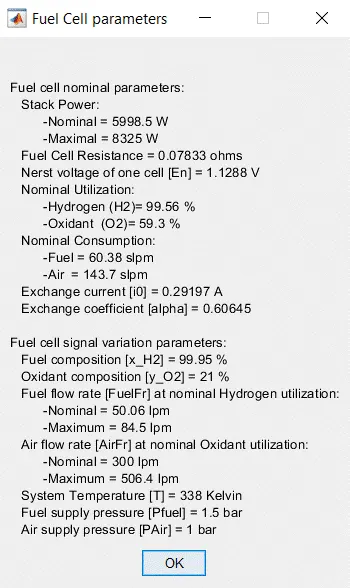
- As evident from the graph and the FC parameters, the nominal stack power is about 6kW with 45Vdc and 133A.
- Because that 6kW is to be maintained, voltage and current share an inversely proportional relationship i.e. when current is increasing, voltage must decrease, in order to maintain the same power output
- As stack current increases, the rate of electrical energy generation is increased, and thus more power from the fuel cell