Flow over a cylinder
Flow over a cylinder
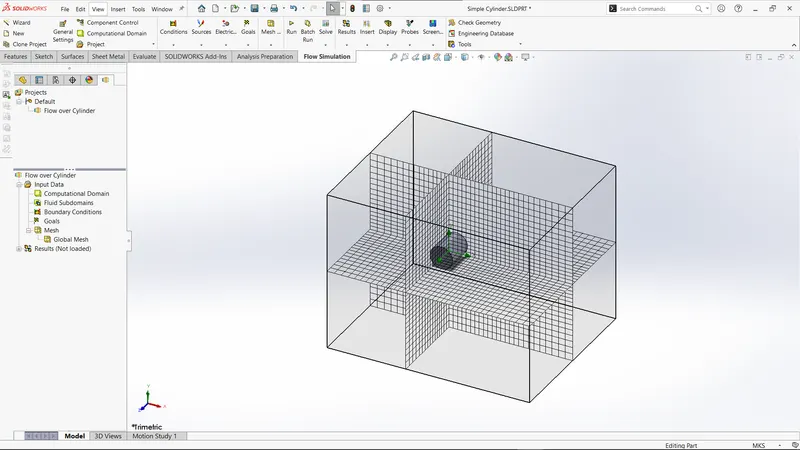
Simulate the flow over a cylinder for the conditions shown in the video.
- Calculate the baseline case Reynolds number.
- Re = rho*U_inlet*D/mu
- D = cylinder diameter
- mu = dynamic viscosity
- rho = density
- Run a baseline simulation and then calculate the Reynolds number. Then increase the Reynolds number by a factor of 20%, 40%, and 100% then run the transient flow simulation.
- For example
- If the Reynolds Number value for the baseline simulation is 100. Then it should be increased( as a factor of 20%, 40%, and 100%) to 120, 140 and 200
- For example
- Simulation end time should be calculated properly
- If the inlet velocity is 1m/s and if the length of the domain is 5 m then the flow through time is 5 seconds. That is, it takes 5 seconds for the flow from the inlet to go to the outlet.
- This 5 second is called the flow through time
- Make sure that end time is set to 2 times flow through time. According to the previous example, the end time would be 10 seconds.
- Create animations for pressure-velocity for all the three Reynolds number.
- Explain your observations
Solution:
AIM
Flow over a cylinder using Solidworks Software
INTRODUCTION
SolidWorks Flow Simulation is a powerful computational fluid dynamics (CFD) software that is used to simulate and analyze fluid flow and heat transfer in various engineering applications. It is a comprehensive tool that is seamlessly integrated into the SolidWorks CAD environment, allowing engineers to perform fluid flow analysis directly on their 3D models.With SolidWorks Flow Simulation, engineers can gain insights into the behavior of fluids, such as liquids and gases, and study how they interact with their surrounding environment. By simulating fluid flow and heat transfer, engineers can optimize designs, improve product performance, and make informed decisions before manufacturing or implementing a system.The software offers a wide range of capabilities, including steady-state and transient flow analysis, laminar and turbulent flow modeling, conjugate heat transfer analysis, and multiphase flow simulations. It provides a user-friendly interface that allows engineers to define the geometry, set up boundary conditions, and specify fluid properties easily.
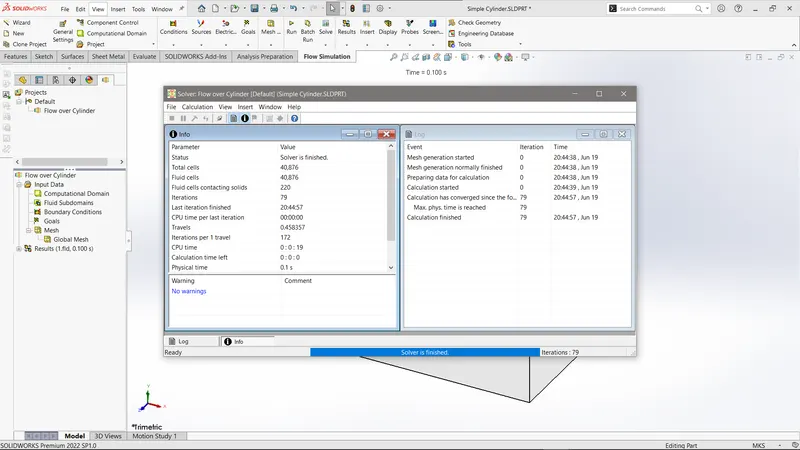
SolidWorks Flow Simulation utilizes the finite volume method, which discretizes the domain into a finite number of control volumes. It then solves the governing equations of fluid flow, including the continuity equation, momentum equations, and energy equation, to calculate fluid velocities, pressures, temperatures, and other relevant parameters.
The software offers advanced visualization tools to help engineers interpret and analyze the simulation results effectively. It provides detailed data on fluid flow patterns, pressure distributions, temperature gradients, velocity vectors, and other important quantities. Engineers can use this information to evaluate the performance of their designs, identify potential issues, and optimize their systems.SolidWorks Flow Simulation finds applications in a wide range of industries, including automotive, aerospace, HVAC (Heating, Ventilation, and Air Conditioning), electronics cooling, chemical processing, and more. It enables engineers to validate and optimize their designs early in the development process, reducing the need for costly physical prototypes and iterations.
Basic Theory
SolidWorks Simulation is a finite element analysis (FEA) software integrated within the SolidWorks CAD environment. It allows engineers to simulate and analyze the structural behavior of their designs, ensuring their performance, reliability, and safety. Here are some basic theories underlying SolidWorks Simulation:
1. Finite Element Method (FEM):
SolidWorks Simulation employs the FEM, which discretizes the geometry into small elements called finite elements. These elements approximate the behavior of the structure under analysis. The FEM divides the structure into a mesh of interconnected elements, where the equations governing the behavior of each element are solved to determine the overall response of the system.
2. Boundary Conditions:
In SolidWorks Simulation, engineers define the boundary conditions to simulate real-world operating conditions. These include applying forces, pressures, constraints, and thermal loads to mimic the actual loading and support conditions the design will experience. Accurate and appropriate boundary conditions are essential for obtaining reliable and meaningful simulation results.
3. Material Properties:
SolidWorks Simulation allows engineers to assign material properties to the components of their designs. These properties, such as Young's modulus, density, thermal conductivity, and others, dictate how the materials will behave under various loading and environmental conditions. Choosing accurate material properties is crucial for obtaining accurate simulation results.
4. Analysis Types:
SolidWorks Simulation offers various analysis types to simulate different scenarios and phenomena. The most common types include static analysis, which analyzes structures under steady loads; dynamic analysis, which considers time-dependent loads and vibrations; and thermal analysis, which predicts temperature distribution and heat transfer within the design. Each analysis type has its own set of equations and assumptions to solve the problem accurately.
5. Solution Methods:
SolidWorks Simulation utilizes numerical algorithms to solve the equations generated from the finite element discretization process. It employs iterative methods to approximate the solution until convergence is achieved. The software provides options for different solution methods, such as direct sparse solvers and iterative solvers, allowing engineers to choose the most appropriate method based on the complexity of the problem.
Methord Study:
Result:
SolidWorks Flow Simulation provides a range of results and outputs that help engineers analyze and understand fluid flow behavior.
Here are some key results that can be obtained from SolidWorks Flow Simulation:
1. Velocity Distribution:
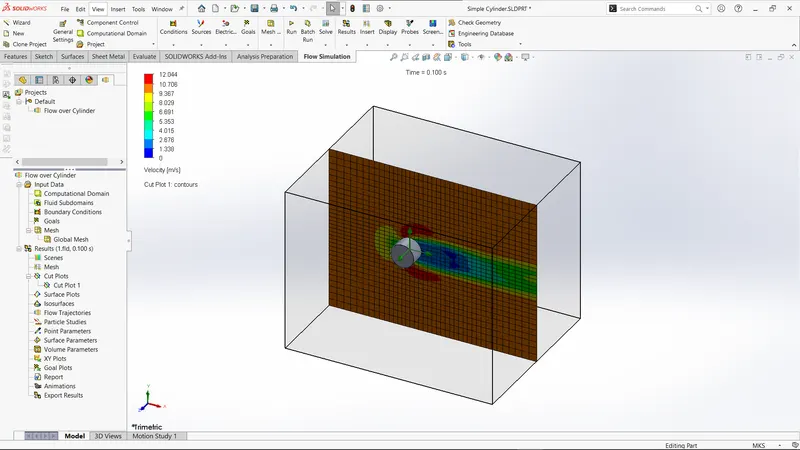
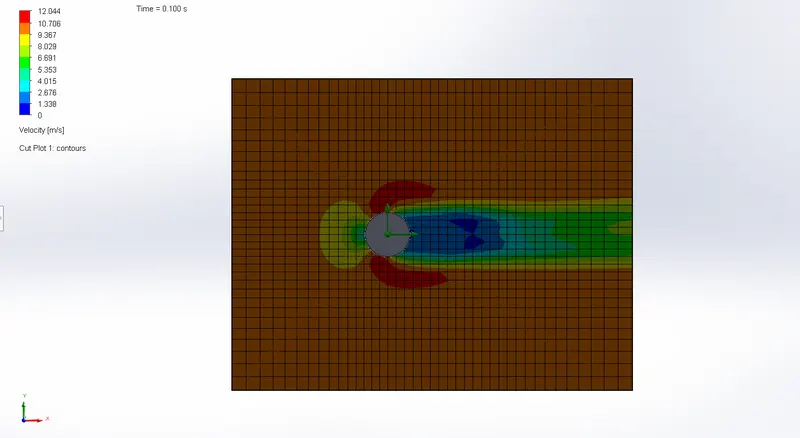
SolidWorks Flow Simulation calculates the velocity field within the analyzed fluid domain. It provides information about the magnitude and direction of fluid velocities at different locations, allowing engineers to identify areas of high or low velocity. Velocity vectors and contour plots can be used to visualize the flow patterns.
2. Pressure Distribution:
The software calculates the pressure distribution within the fluid domain. It provides insights into pressure gradients and variations, helping engineers understand how the fluid flows and interacts with the system. Contour plots and pressure profiles illustrate the pressure distribution across the analyzed geometry.
3. Temperature Distribution:
SolidWorks Flow Simulation predicts the temperature distribution within the fluid domain. This is particularly useful for studying heat transfer and thermal behavior. Engineers can analyze temperature gradients, identify hotspots or areas of heat transfer, and optimize cooling strategies. Contour plots and temperature profiles visualize the temperature distribution.
4. Flow Visualization:
The software offers visualization tools to help engineers understand and analyze fluid flow behavior. Streamlines, pathlines, and streaklines illustrate the path that fluid particles take within the system. These visualizations provide insights into flow patterns, recirculation zones, and fluid behavior in complex geometries.
5. Forces and Moments:
SolidWorks Flow Simulation calculates the forces and moments acting on the geometry due to fluid flow. This information is valuable for analyzing the impact of fluid forces on the design and evaluating its structural integrity. Engineers can assess the loads acting on components, optimize designs, and ensure they meet performance requirements.
6. Heat Transfer Coefficients:
The software provides information about heat transfer coefficients, which quantify the rate of heat transfer between the fluid and solid surfaces. Engineers can identify areas of high or low heat transfer and optimize designs to enhance thermal performance. Heat transfer coefficient plots are used to visualize the distribution of heat transfer rates.
7. Mass Flow Rates and Pressure Drops:
SolidWorks Flow Simulation enables engineers to calculate mass flow rates through specific regions and assess pressure drops across the system. This information helps in understanding fluid distribution, identifying flow restrictions, and optimizing the design for efficient fluid flow.
References:
- Skill-lync
- chatgpt
- solidworks simulation
- https://www.goengineer.com/solidworks/simulation/solidworks-simulation
- https://www.javelin-tech.com/3d/technology/solidworks-simulation/