FLOW OVER A BICYCLE USING PYTHON
FLOW OVER A BICYCLE
AIM
To find the drag force over a bicycle at given velocities and drag coefficients using python programing
OBJECTIVES
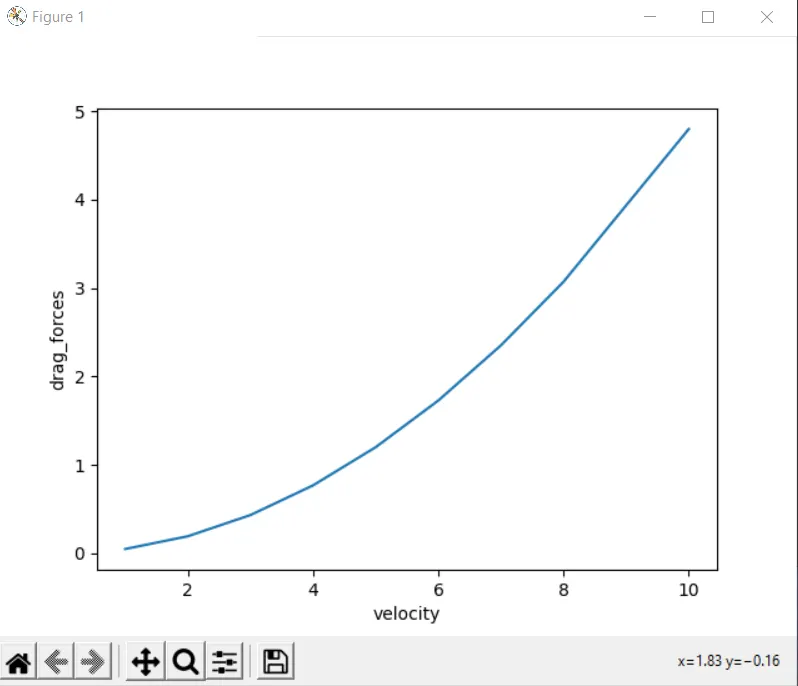
- Write a program to plot Velocity vs Drag force.
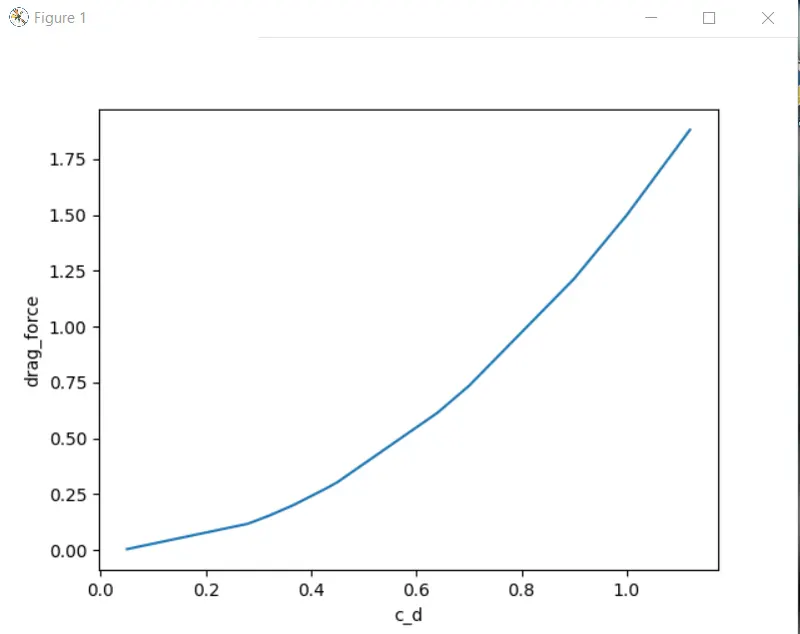
- Write a program to plot Drag Coefficient vs Drag force
DESCRIPTION
A drag force is the resistance force caused by the motion of a body through a fluid, such as water or air. A drag force acts opposite to the direction of the oncoming flow velocity. This is the relative velocity between the body and the fluid.
The drag force D exerted on a body traveling through a fluid is given by
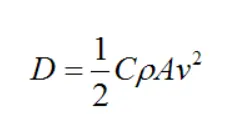
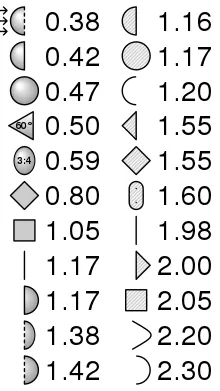
C is the drag coefficient, which can vary along with the speed of the body. But typical values range from 0.4 to 1.0 for different fluids (such as air and water)
ρ is the density of the fluid through which the body is moving
v is the speed of the body relative to the fluid
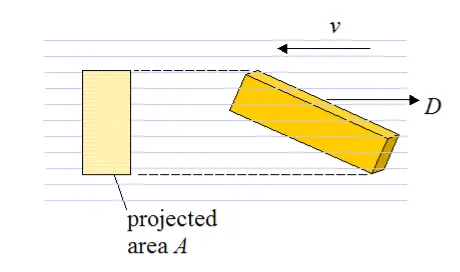
A is the projected cross-sectional area of the body perpendicular to the flow direction (that is, perpendicular to v). This is illustrated in the figure below
EQUATIONS
DRAG COEFFICIENT CHART
ALGORITHM
DRAGFORCE VS VELOCITY
STEP1;start the program
STEP2;import matplotlib.pyplot as plt is the command used to insert plots in python programing
STEP3;input values given like area rho density coefficient of drag(C_d)
STEP4; enter an array of velocity ,values are assigned to a variable V
STEP5: input a null array of drag force
STEP6;for loop initialized
STEP7;for each value of velocity in the array of V ,
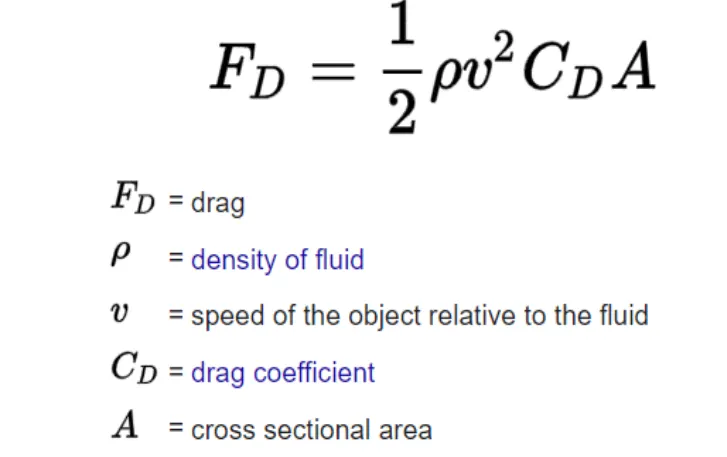
Find out drag force using equation D=0.5 *rho*v*V*A*c_d
STEP8;repeat it using command append and values of drag force for each values in v are printed using print command
STEP9;plot the graph using plot using x axis velocity and y axis drag force
STEP10;x and y axis labelled using xlabel(‘’) and ylabel(‘’) command
step11;plt.show() is used to make the graph visible
Step12;Run and end the program
DRAG FORCE VS C_d
STEP1;start the program
Step2;import matplotlib.pyplot as plt is the command used to insert plots in python programing
Step3;input values given like area rho density velocity
Step4; enter an array of C_d(coefficient of drag),values are assigned to a variable C_d
Step5: input a null array of drag force
Step6;for loop initialized
Step7;for each value of cdrag in the array of c_d ,
Find out drag force using equation D=0.5 *rho*V*V*A*c_d
Step8;repeat it using command append and values of drag force for each values in c_d are printed using print command
Step9;plot the graph using plot using x axis c_d and y axis drag force
Step10;x and y axis labelled using xlabel(‘’) and ylabel(‘’) commands
step11;plt.show() is used to make the graph visible
Step12;Run and end the program
PROGRAM
Drag forces vs C_d
import matplotlib.pyplot as plt
#INPUTS


# formal area(m^2)
A = 0.1

#DENSITY
rho =1.2

#BYCYCLE VELOCITY
v=25
#COEFFICENTS OF DRAG ,A RANGE FROM 0.3 TO 1.4 TAKEN
c_d=[ 0.38, 0.42, 0.47,0.59, 0.80, 1.05,1.17,1.38,1.42]

#DRAG FORCE
drag_force=[]
#DRAGCOEFFICENTS


for dragc in c_d:
 drag_force.append((0.5*v*rho*A*dragc*dragc))
 print(drag_force)


#PLOTTING OF GRAPH
#XAXIS YAXIS
plt.plot(c_d,drag_force)
#LABEL
plt.xlabel('c_d')
plt.ylabe('drag_force')
#SHOW COMMAND
plt.show()
OUTPUT
dragforce vs velocity
import matplotlib.pyplot as plt

#INPUTS
#DRAGCOEFFICENTS
c_d = 0.8

# formal area(m^2)
A = 0.1

#DENSITY
rho =1.2

#BYCYCLE VELOCITY
v=[1,2,3,4,5,6,7,8,10]
#DRAGFORCE
drag_force=[]

for velocity in v:
 drag_force.append((0.5*c_d*rho*A*velocity*velocity))
#TO PRINT DRAG FORCE
print(drag_force)
#PLOTTING
plt.plot(v,drag_force)
#LEBELING
plt.xlabel('velocity')
plt.ylabel('drag_forces')

plt.show()
OUTPUT
CONCLUSIONS
graph plotted.
Python program executed and successfully and output is verified.