Final Project: Electric Rickshaw modelling
FINAL PROJECT (E-RICKSHAW)
OBJECTIVE:
To create a model of three wheeled electric rickshaw(Passenger vehicle) and run the model with three different drive cycles.
TO OBSERVE:
- Energy consumed during the period of each drive cycles.
- Temperature rise in controller from initial temperature during each drive cycles.
- Temperature rise in DC motor from initial temperature during each drive cycles.
- Battery SOC(state of charge) at each drive cycles.
- Distance covered by each drive cycles.
MODEL:
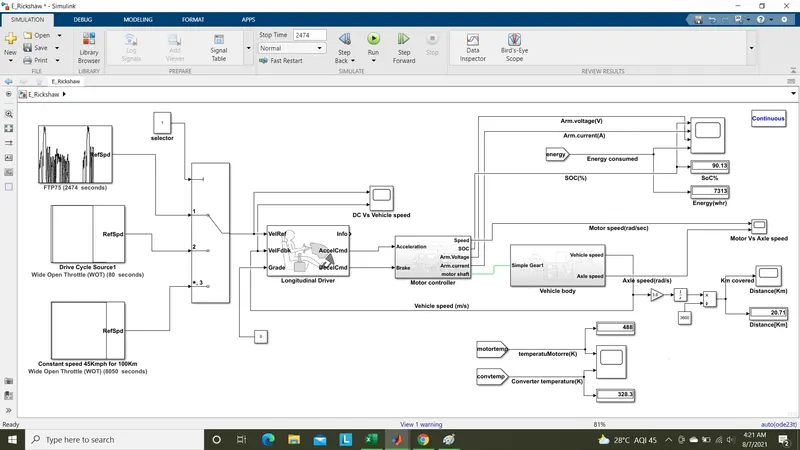
OPERATIONS:
Drive cycles:
Here in our model we have choosen three drive cycles as referance for vehicle.They are,
- FTP75 drive cycle.
- WOT Drive cycle.
- Constant speed of 45Km/hr for 100Km.
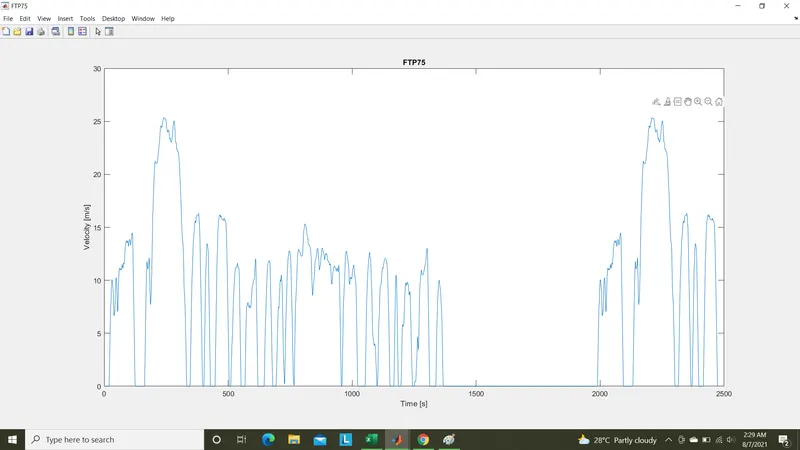
Below shown the FTP75 drive cycle plot and their block paramrters,
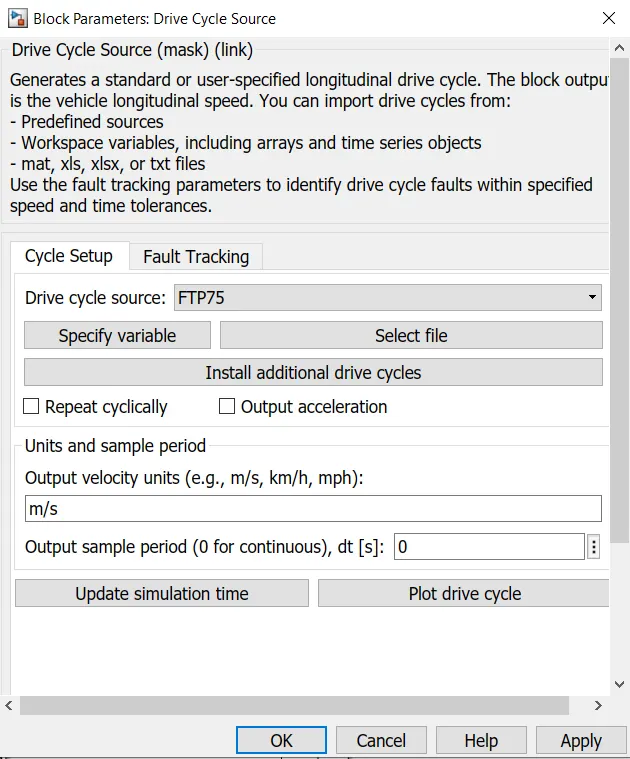
The output velocity is in m/s as mentioned above and its plot can be viewed by clicking 'plot drive cycle' tab.
We can also select our owm drive cycle datas from 'select file' option an choose out excel file data or .mat files time vs speed datas.
Second drive cycle as WOT(Wide Open Throttle) condition with specified configuration parameters as shown below,
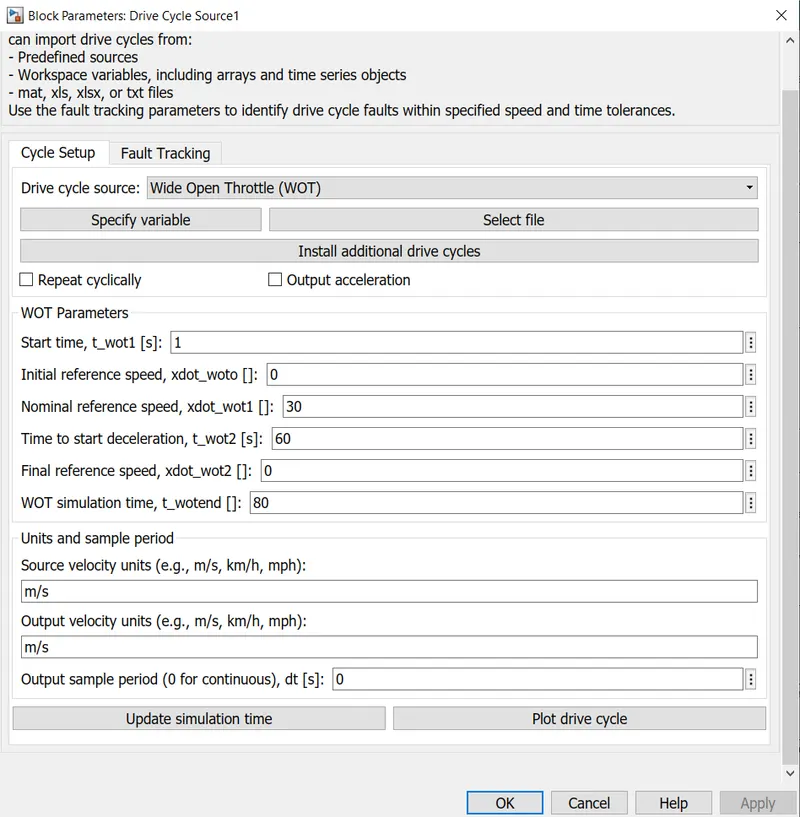
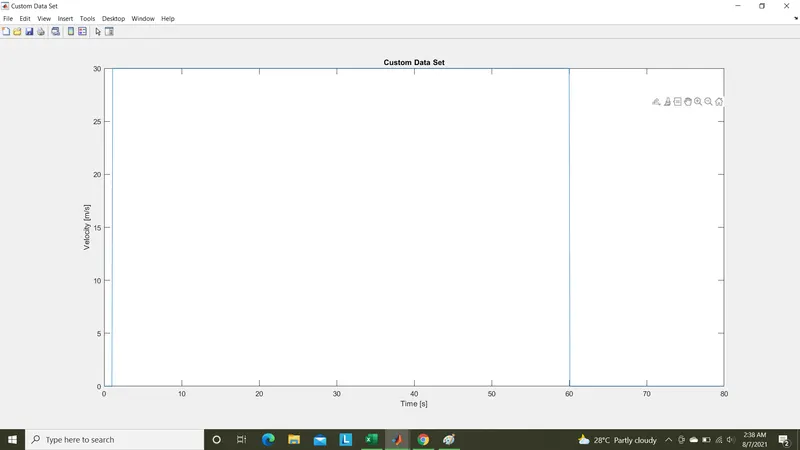
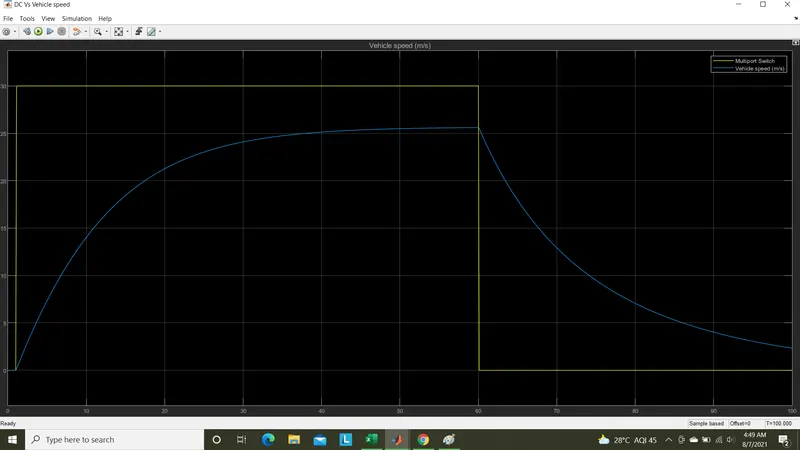
Here start time as 1sec,initial ref.speed as 0,nominal ref.speed as 30m/s,time to start deceleration as 60sec,final ref.speed as 0,simulation end time as 80sec are given as input.
The plot for this drive cycle seen as,
Third drive cycle as constant speed of 45Km/hr for 100Km can be generated from WOT drive cycle itselt as,
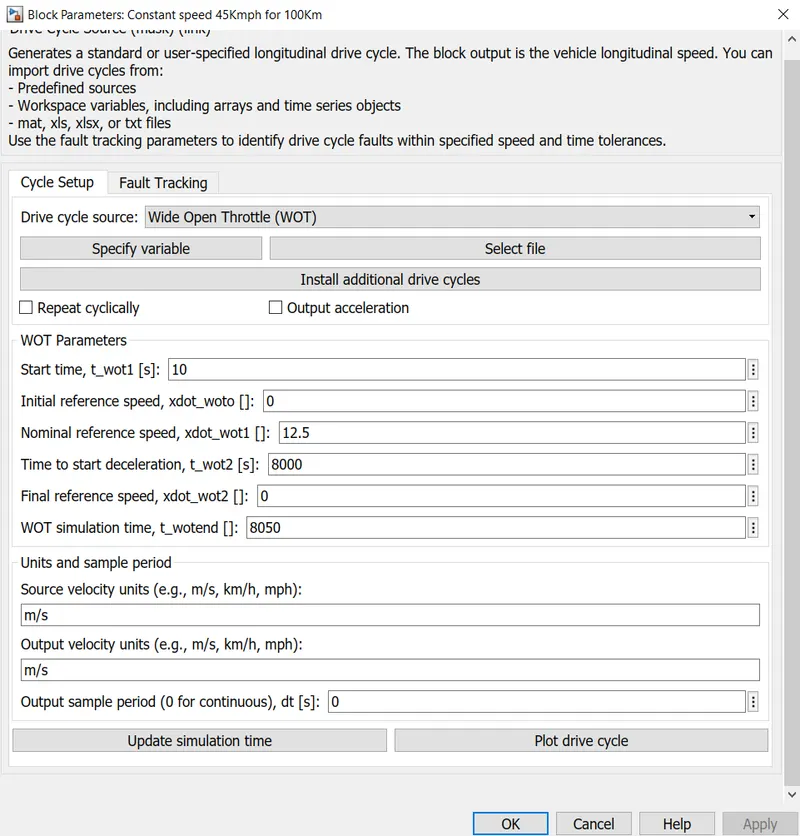
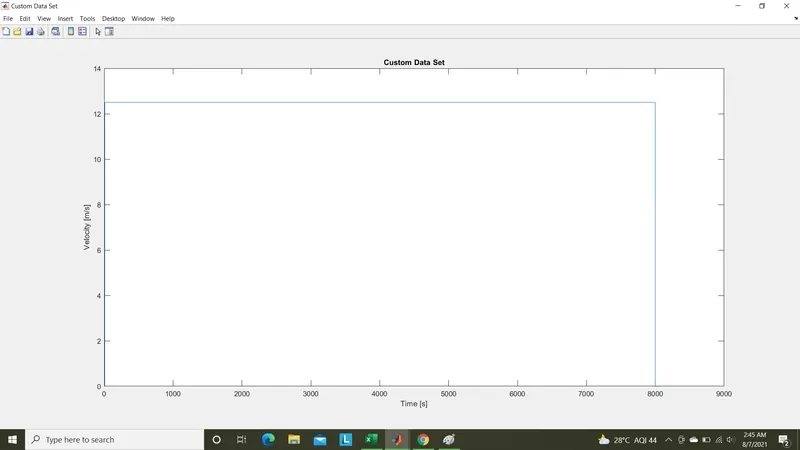
Here the total time duration take by vehicle to cross 100Km in constant speed of 45Km/ph(12.5m/s) is 8000 secs given as inputs. The simulation end time set as 8050 secs.
Initial start time is given as 10 secs. Its plot seen as,
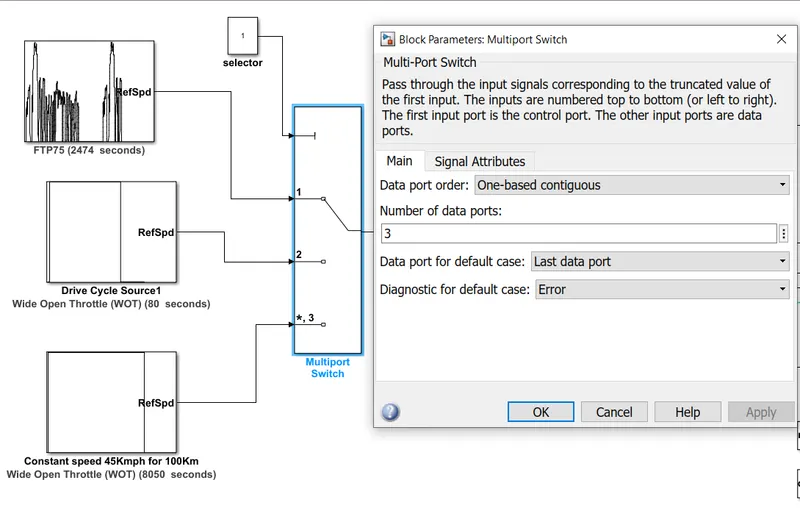
These referance drive cycles are given as referance speed input with resprct to time to the longitudinal driver block through a multiport switch.Depending upon the selection
port number, drive cycles are choosed.
Longitudinal driver block:
The referance input are given to this block.The feedback speed from vehicle body is given through feedback port. Both the speeds are compared
and pulse signals are produced as acceleration command and deceleration commands.
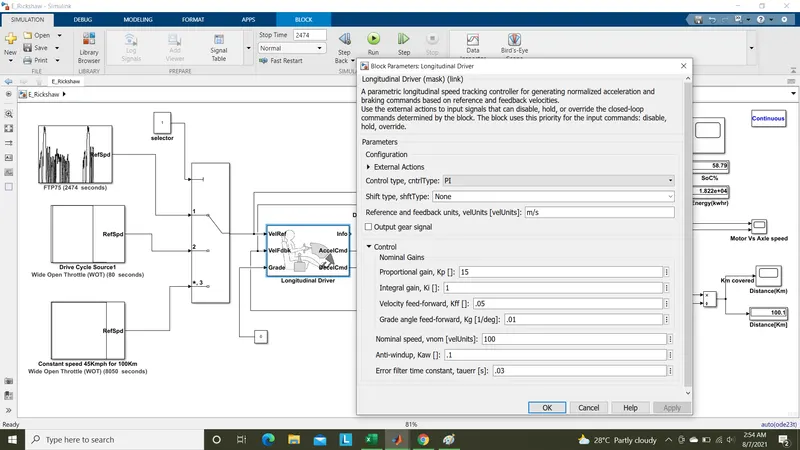
This block controls the acceleration and deceleration commands from feedback according to referance speed by PI controller.It gain values Kp,Ki are assigned as
shown in above parameter box.
Motor Controller:
Here shown the overall motor controller parts of this subsystem.
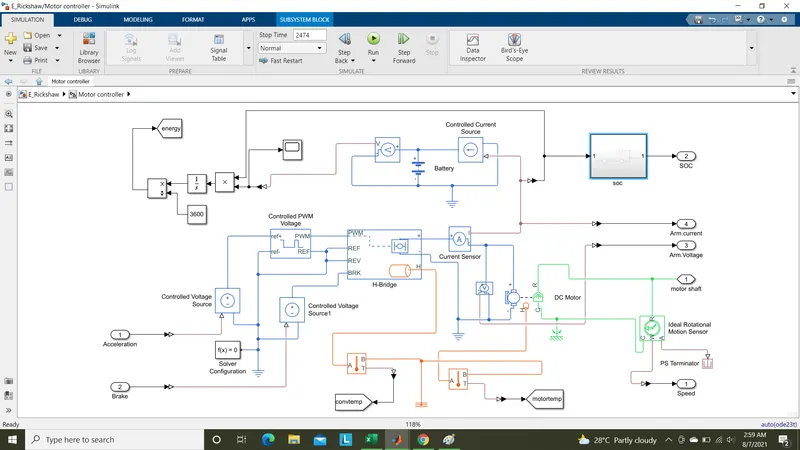
In this subsystem the major blocks presented were,
- Controlled voltage source.
- Controlled PWM voltage.
- H-bridge(Converter).
- Current sensor.
- Voltage sensor.
- DC Motor.
- Thermal sensor.
- Ideal rotation motion sensor.
- Battery.
- Controlled current source.
- SOC unit.
- Energy consumption unit.
The operation of this subsystem explained as below,
- The Acceleration and deceleration commands are given to controlled voltage source for producing voltage accordingly to the commands for PWM generation unit.
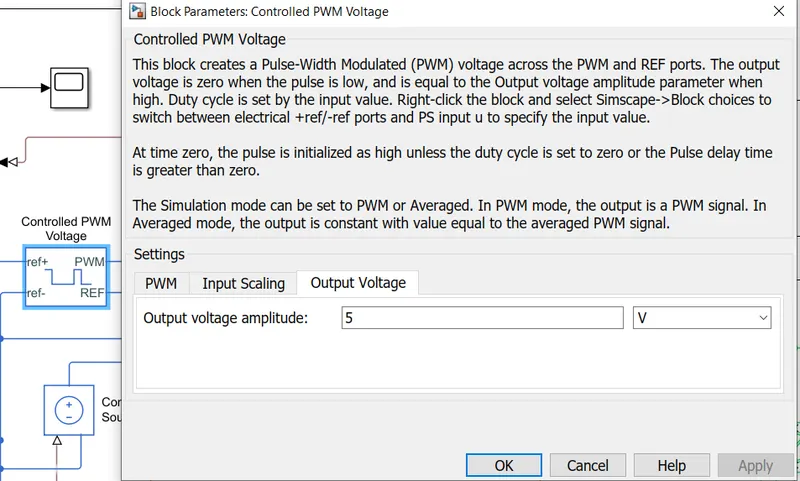
- The controlled PWM voltage block produce the PWM pulses for H-Bridge(DC-DC converter) switches as controlled PWM signals.
- These PWM Pulses makes ON/OFF accordingly to make the motor input voltage as controlled voltage from battery source.
- The speed of the motor changes correspond to the referance drive cycle speeds by the power converter switches present in H-bridge circuit.
- The Voltange can be controlled by variations in their duty cycle in PWM signals.
- Finally the shaft of motor is given to the axle of vehicle body through a coupled gear with certain gear ratio.
Controlled PWM voltage:
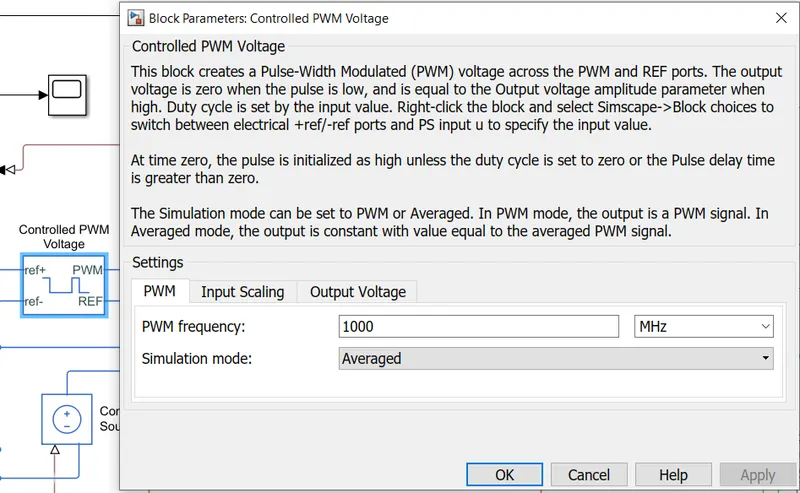
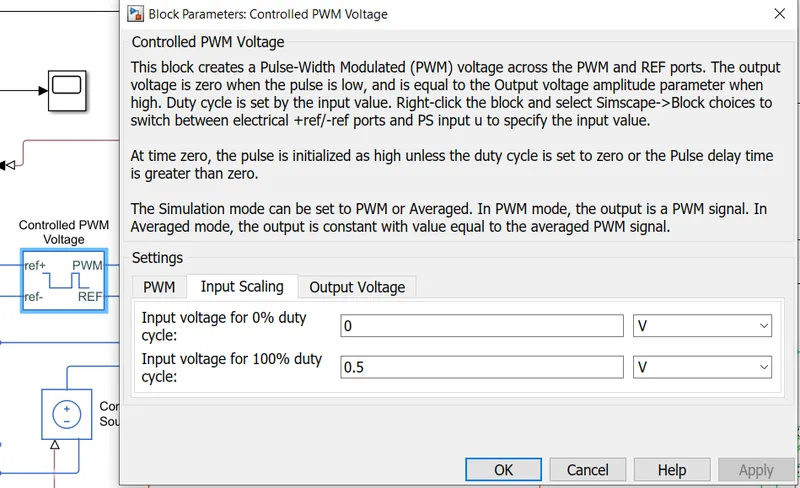
The configured values are shown below,
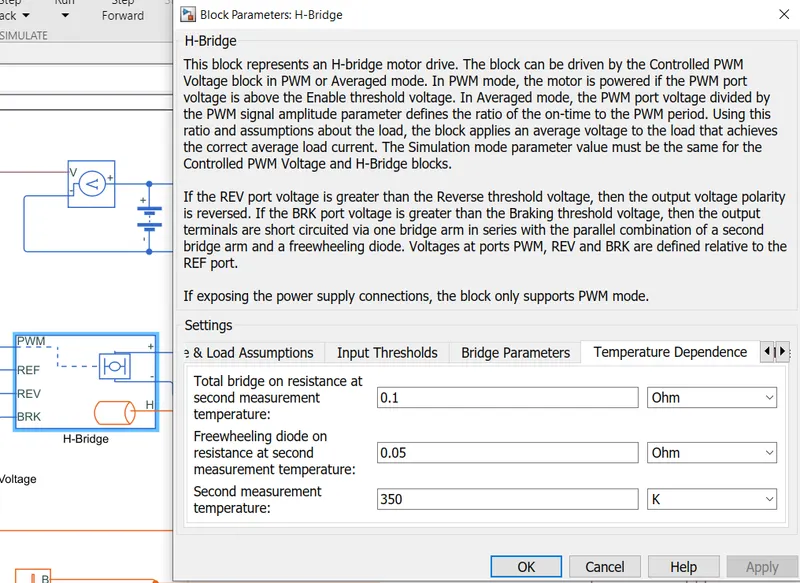
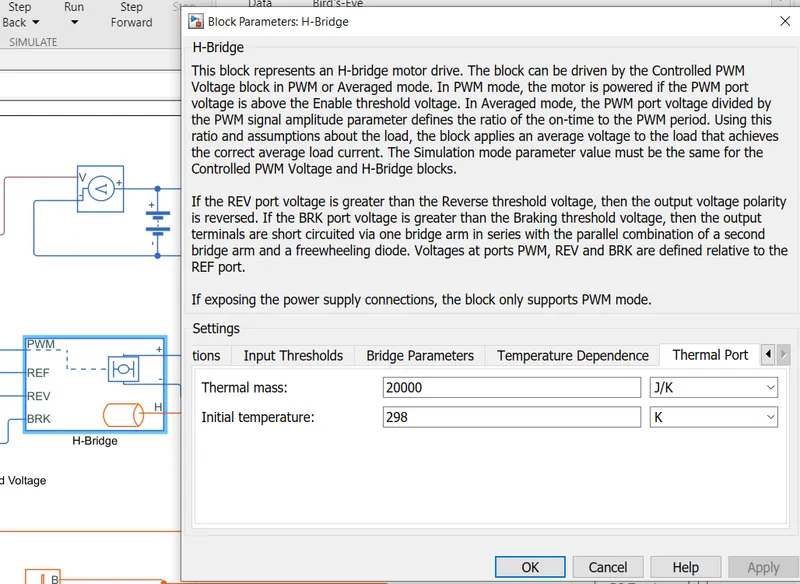
H-bridge:
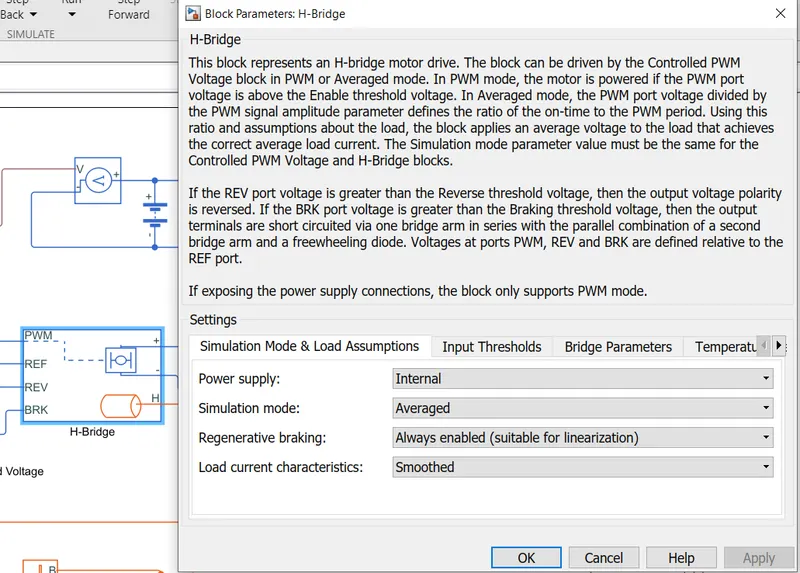
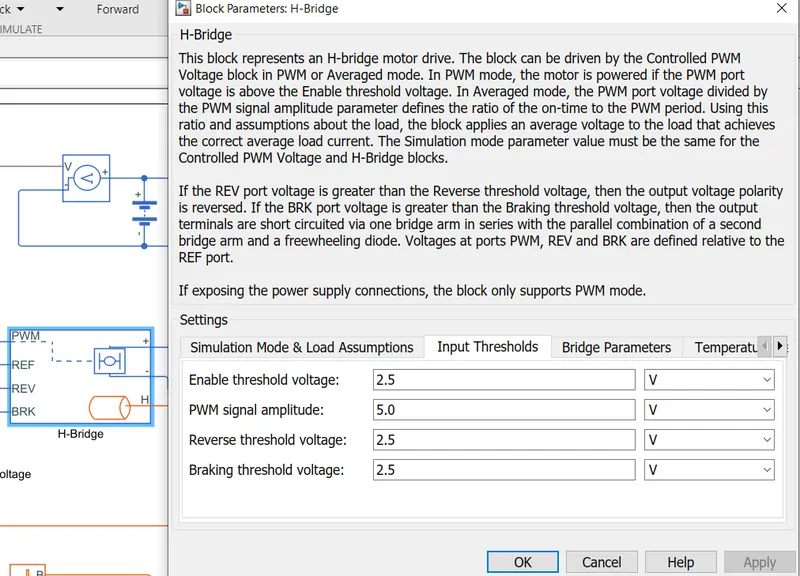
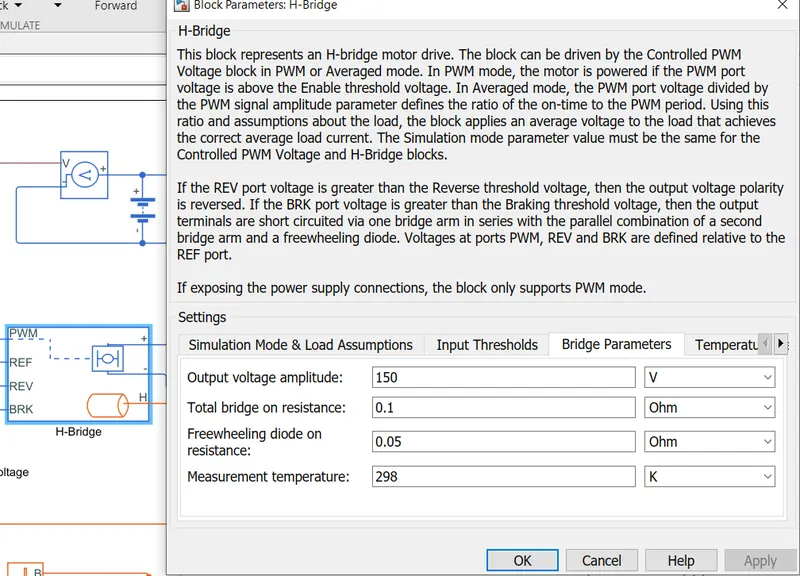
This block is power electronic converter of DC motor.The battery rated voltage 400V reduced to 150V and given as input to DC motor.
Thermal port is adden in this block to measure the temperature produced on converter. From this port we can maesure the rice in temperature in converter
by, Temperature rise =(Initial temperature 298K(25 deg celcius) - Noted temperature at end of drive cycle)
The configuration parameters for H-bridge are given below,
DC Motor:
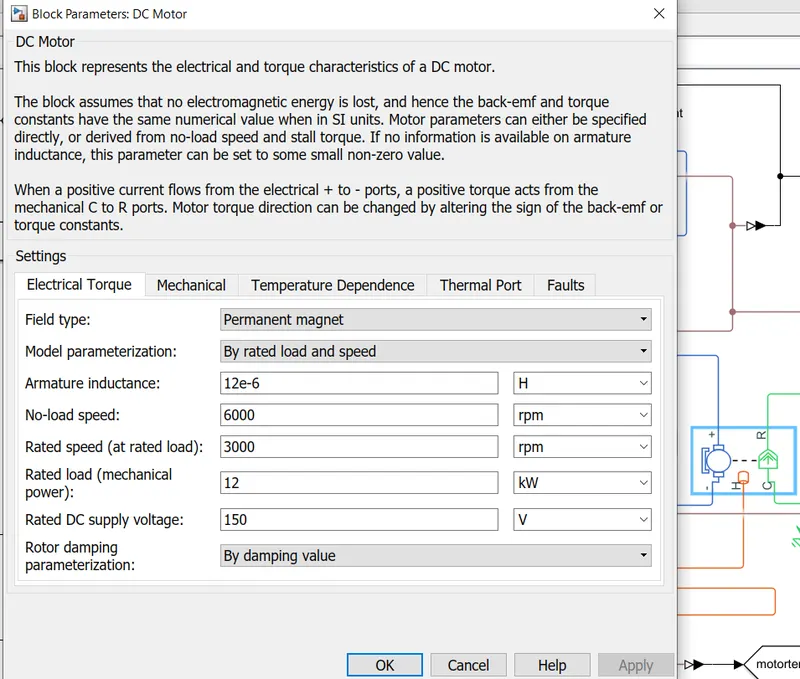
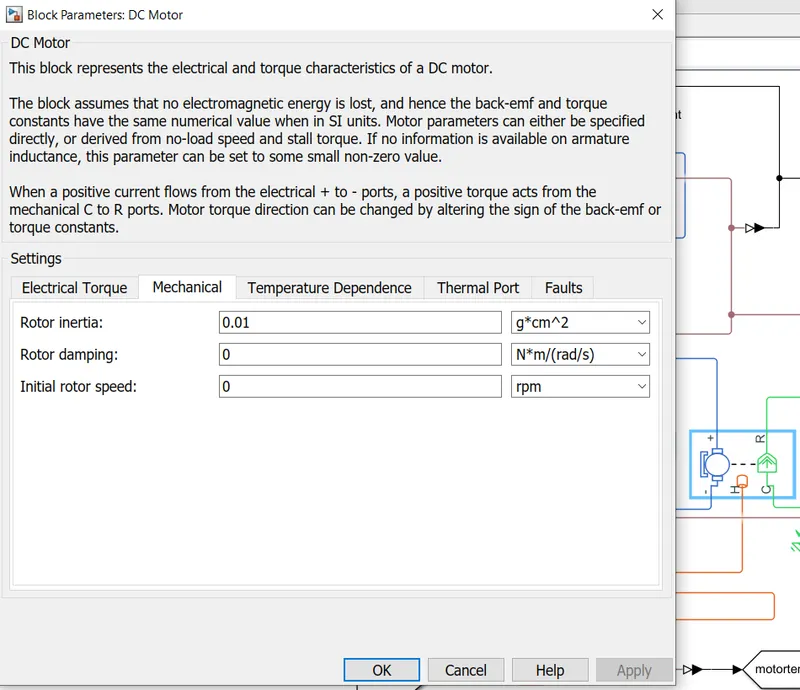
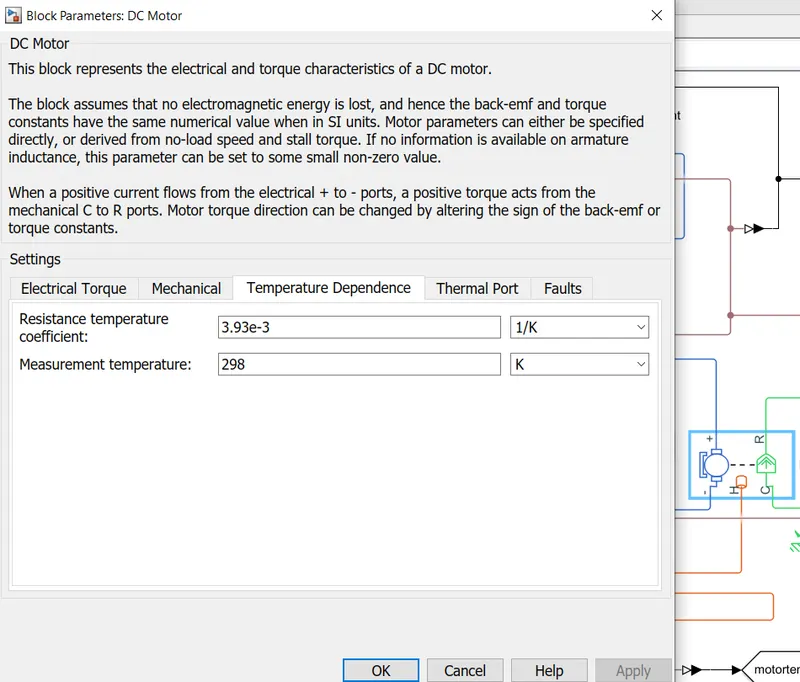
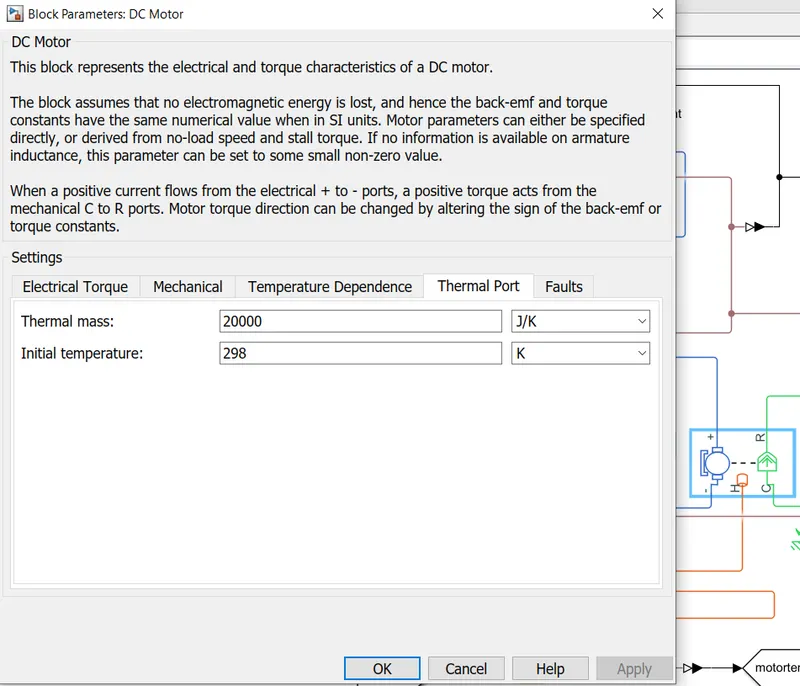
The configured parameters are,
Here we had taken 12KW rated load motor with no load speed as 6000 rpm and rated speed as 3000 rpm.Rated DC supply as 150 V.
Here also thermal out port is added to measure temperature rise of motor.
Battery:
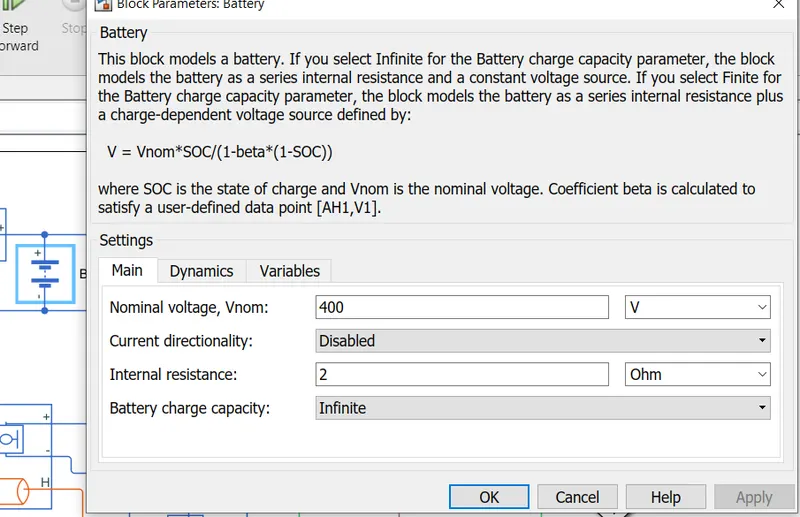
Here battery is additionally added to see the charging and discharging current and overall energy consumed by vehicle through out the
drive cycle period.
The voltage to DC motor is supplied directly from converter circuit as voltage source is given as internal in H-Bridge block parameter.
Here battery nominal valtage is set as 400V and internal resistance as 2 ohms.
The battery capacity is set as infinite for controlled Ah level of battey as assumption.
SOC % :
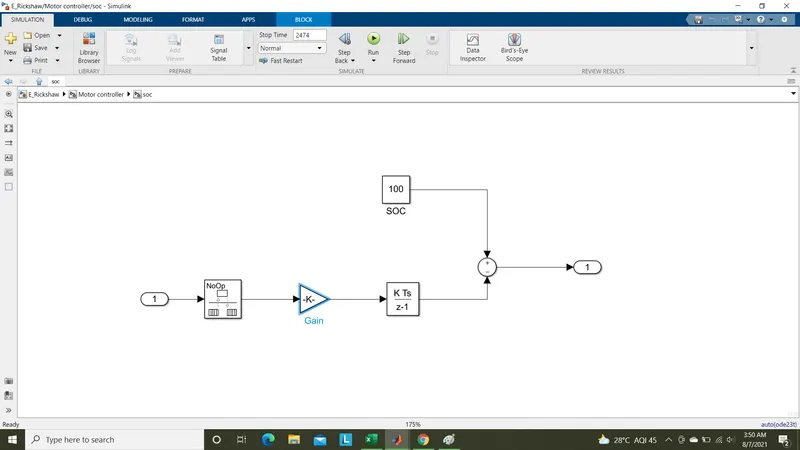
The SOC of battey can be calculated by taking 100% as initial refeerance state.
Then the variation in current senced at armature of DC motor is given to a rate transition for converting the current value to a per unit
of 100 ,multiplied with gain of inverted 1 Ah value, then converted to state of charge value at every sec compared with 100%.
The resultant charge is plotted accordingly at every sec.
Energy consumption:
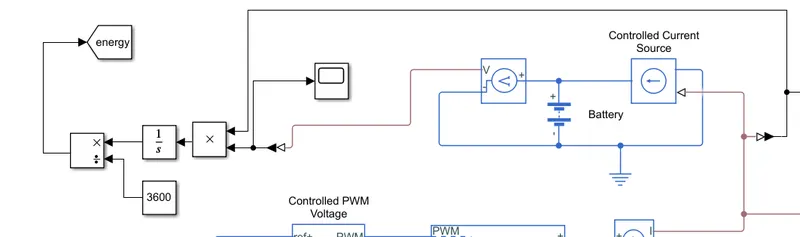
The overall energy consumption of vehicle can be calculated from this below model circuit.
The voltage across battery and current from motor armature ps-signal get multiplied and integrated to get energy consumed by vehicle.
Temperature senceing:
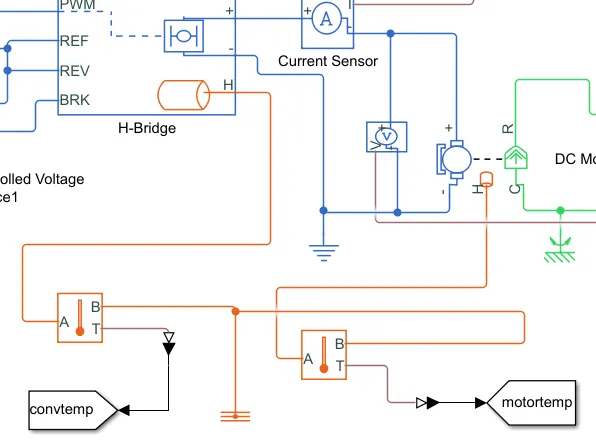
The temperature out ports are enabled in converter and motor blocks.
The outports are connected to Thermal sensor to sence the temperature of converter and motor at every second.
The connections are shown as,
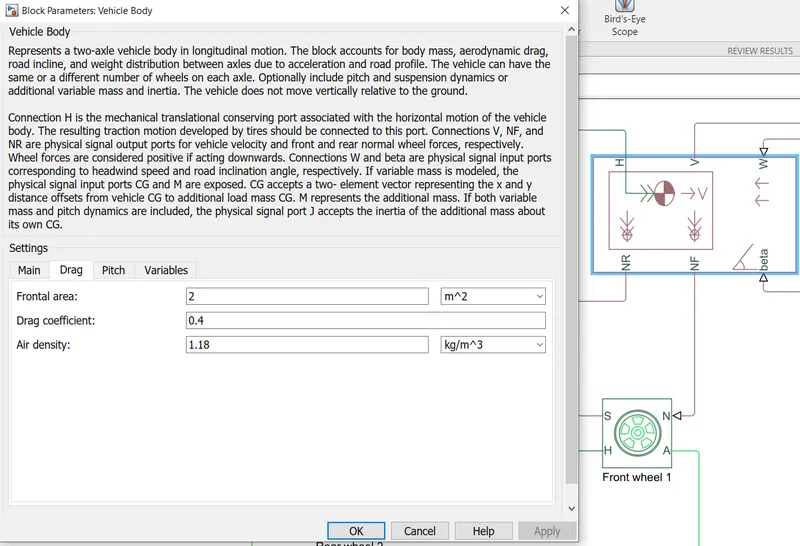
Vehicle body:
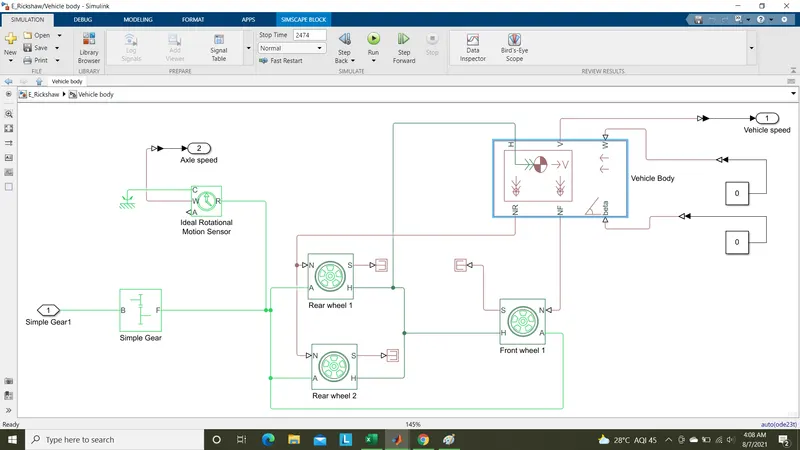
Here a simple gearof gear ration 5 is connected between the motor shaft and rear wheel axle.A single wheel is connected to NF.
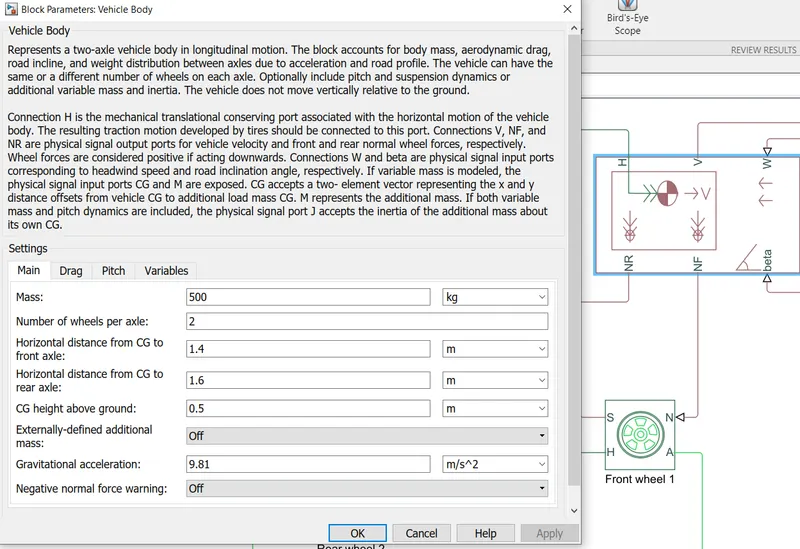
The vehicle body configured as,
RESULTS:
After configured all the parameters run the model for three drive cycles connected as referance.
(1) FTP75 Drive cycle:
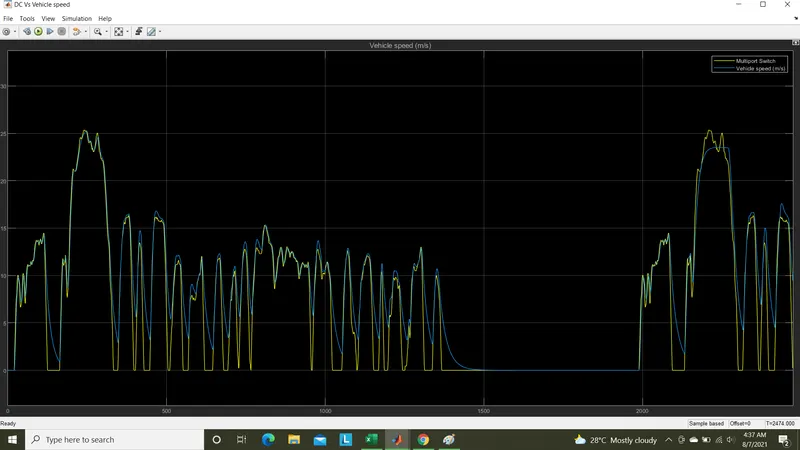
Set the selector as 1 in multiport switch and set stop time as 2474 secs and click run.
The results are,
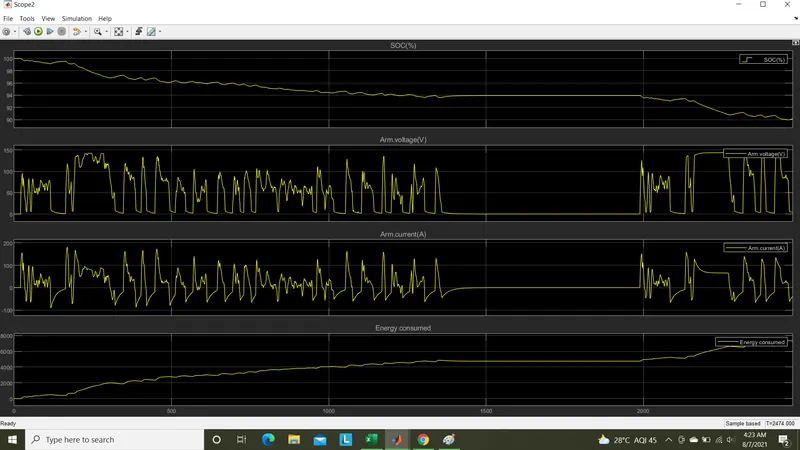
Energy consumed during the period of drive cycles=7.31Kwhr
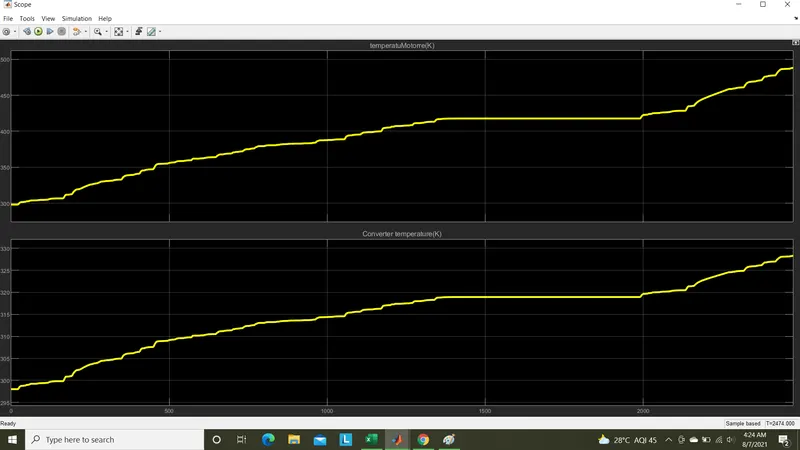
Temperature rise in controller from initial temperature during drive cycle=30.15 deg C.
as final temp of converter is 328.3K(55.15 C)
=>( 55.15 - 25) =30.15 deg C
Temperature rise in DC motor from initial temperature during drive cycle=190 deg C.
as final temp of motor is 488K(214.85 C)
=>( 214.85 - 25) =189.85 deg C
Battery SOC(state of charge) at end of drive cycle=90.13%( 10% reduced in this drive cycle)
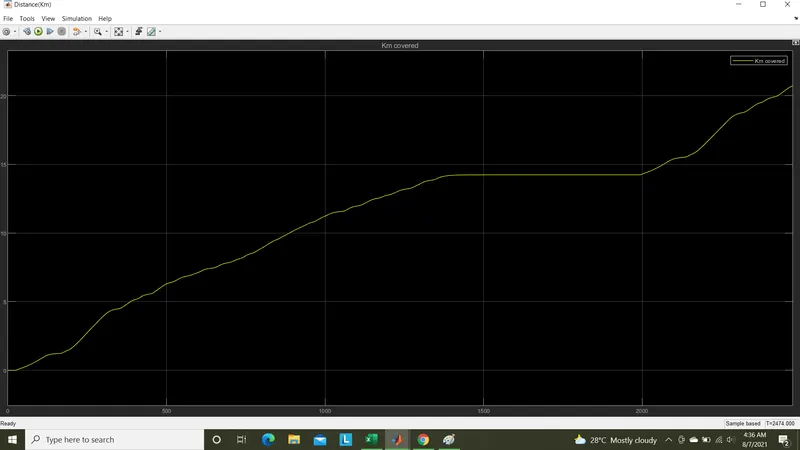
Distance covered by at end of drive cycle=20.71 Km.
SoC%,Arm.Voltage,Arm.current,Energy consumption:
Temperature rise:
Distance covered:
Ref.speed Vs Vehicle speed control:
(2) WOT Drive cycle:
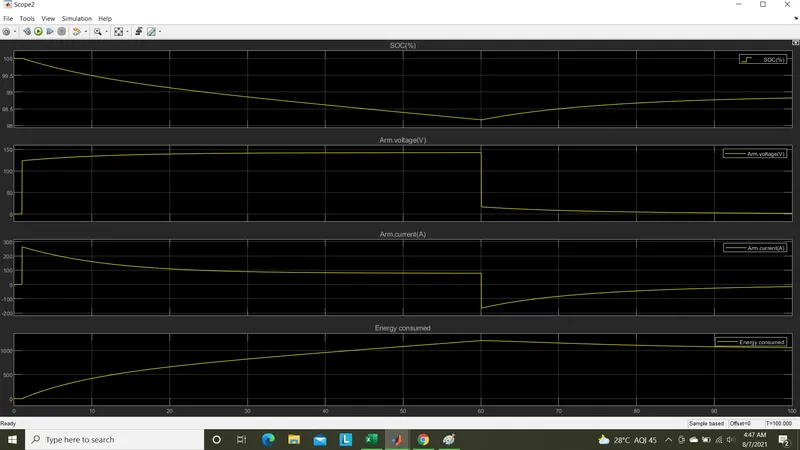
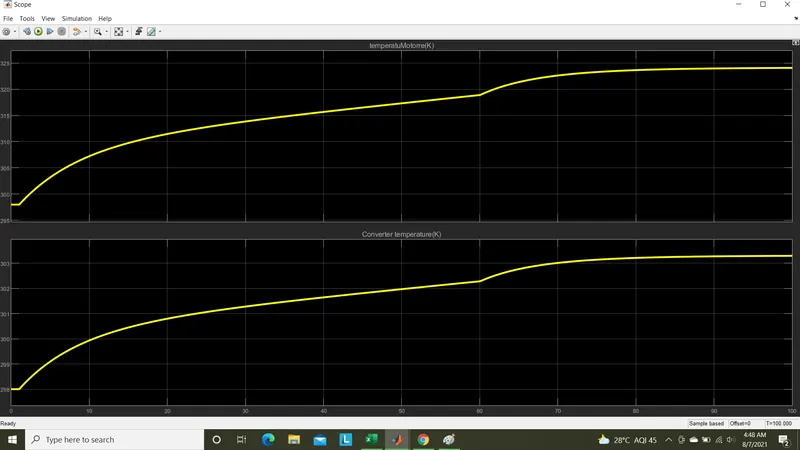
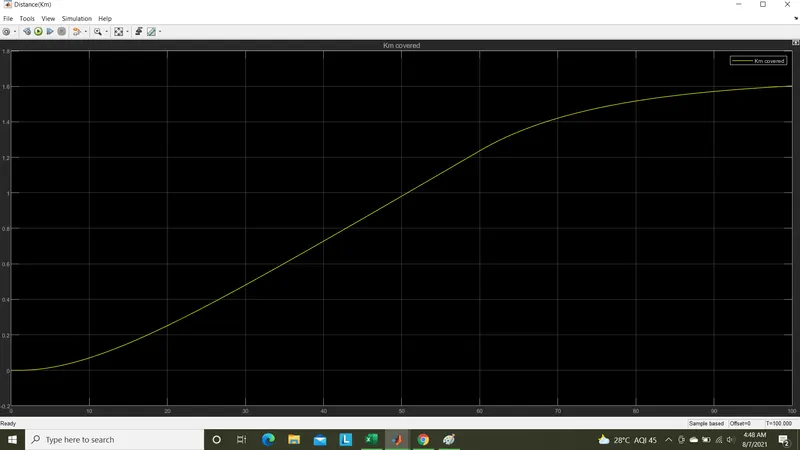
Set the selector as 2 in multiport switch and set stop time as 100 secs and click run.
The results are,
Energy consumed during the period of drive cycles=1.05Kwhr
Temperature rise in controller from initial temperature during drive cycle= 5.15deg C.
as final temp of converter is 303.3K(30.15 C)
=>( 30.15 - 25) =5.15deg C
Temperature rise in DC motor from initial temperature during drive cycle= 26deg C.
as final temp of motor is 324.1K( 50.95C)
=>( 50.95 - 25) =26 deg C
Battery SOC(state of charge) at end of drive cycle=98.82%( 1.18% reduced in this drive cycle)
Distance covered by at end of drive cycle= 1.6Km.
SoC%,Arm.Voltage,Arm.current,Energy consumption:
Temperature rise:
Distance covered:
Ref.speed Vs Vehicle speed control:
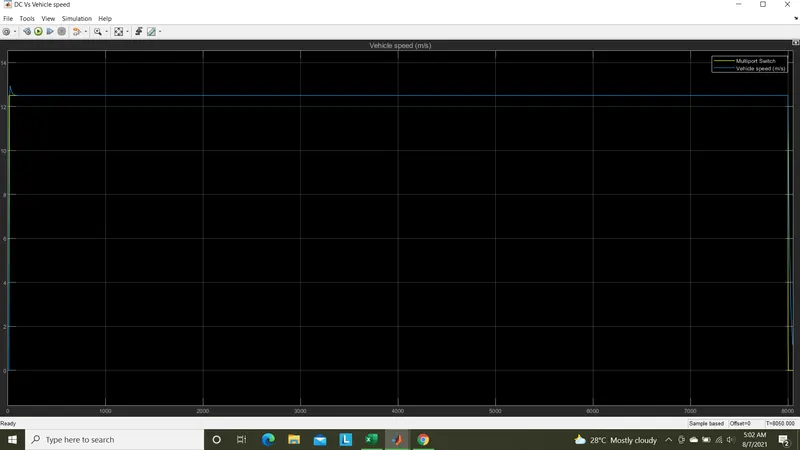
(3) Constant speed of 45Kmph for 100Km Drive cycle:
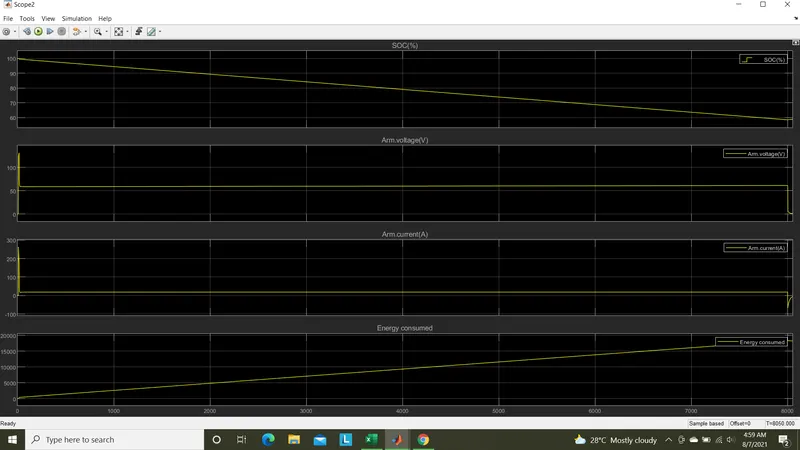
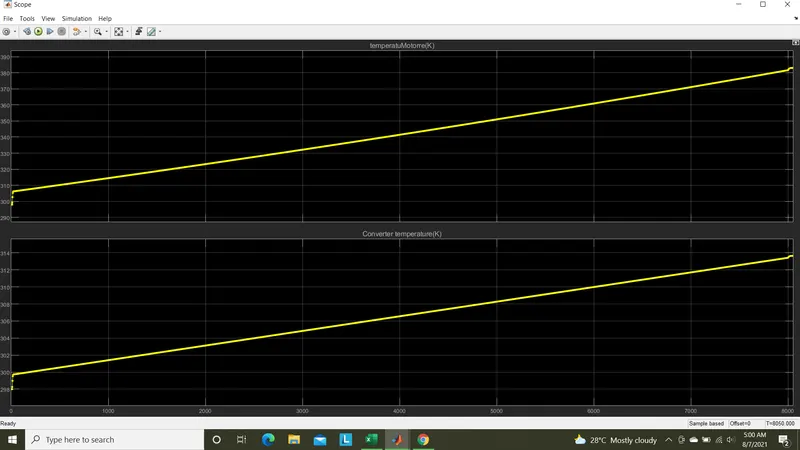
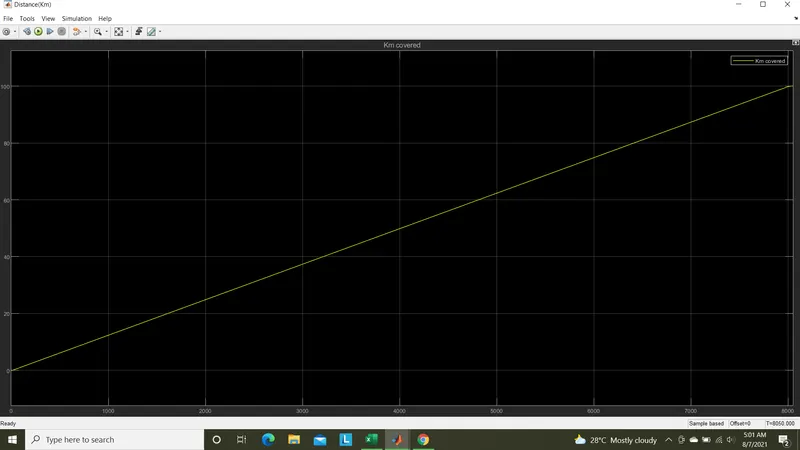
Set the selector as 3 in multiport switch and set stop time as 8050 secs and click run.
The results are,
Energy consumed during the period of drive cycles=18.22Kwhr
Temperature rise in controller from initial temperature during drive cycle= 15.55deg C.
as final temp of converter is 313.7K(40.55 C)
=>( 40.55 - 25) =15.55deg C
Temperature rise in DC motor from initial temperature during drive cycle= 84.85deg C.
as final temp of motor is 383 K( 109.85C)
=>( 109.85 - 25) =84.85 deg C
Battery SOC(state of charge) at end of drive cycle=58.79( 41.21% reduced in this drive cycle)
Distance covered by at end of drive cycle= 100.1Km.
SoC%,Arm.Voltage,Arm.current,Energy consumption:
Temperature rise:
Distance covered:
Ref.speed Vs Vehicle speed control:
Note: Model file and Excel file are attached outside.
Thank you
Submitted by,
Praveen Kumar L V,
Date:07/08/2021.