Electric Rickshaw Modelling using Matlab and Simulink
Aim: The aim of this MATLAB model is to assess the energy consumption, as well as the temperature rise of the motor and motor controller, for a 100 km driving distance at a constant speed of 45 km/h using three standard driving cycles (urban, highway, mixed). This analysis will help evaluate the performance and thermal characteristics of the electric rickshaw under different driving conditions, allowing for optimization and improvement if necessary.
Objective:- Create a detailed MATLAB model of an electric rickshaw (three wheel passenger vehicle) as per details below:
Rear wheels driven by PM brushed type motor
Assume efficiency points of motor controller and motor
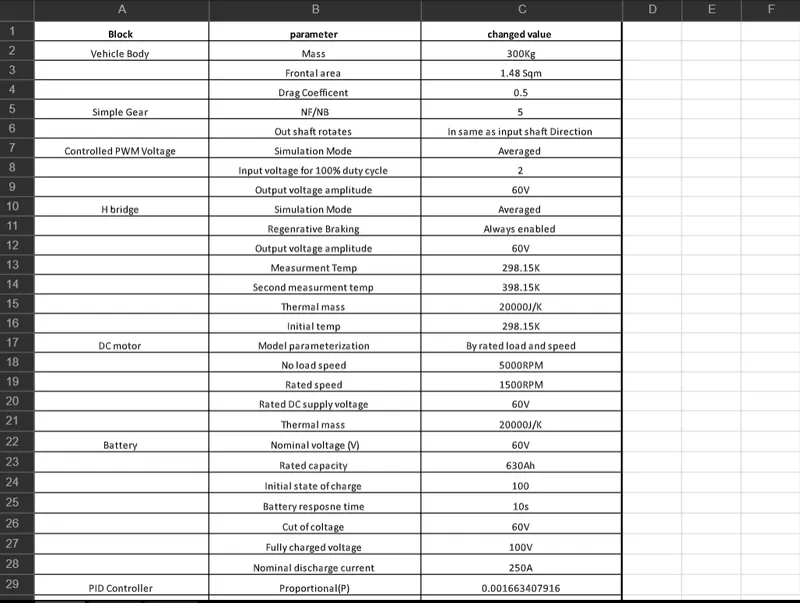
Make an excel sheet of all input and assumed data
Results: For any three standard driving cycles show energy consumption, temperature rise of motor and controller for 100 km constant speed driving at 45 kmph.
To create a detailed MATLAB model of an electric rickshaw as per the given details, we'll consider the following components and parameters:
Components:
- PM brushed type motor: This motor will be responsible for driving the rear wheels of the rickshaw.
- Motor controller: The motor controller regulates the power supplied to the motor and controls its speed.
Parameters:
- Efficiency points of the motor controller: These efficiency points represent the efficiency of the motor controller at different operating conditions.
- Efficiency points of the motor: Similar to the motor controller, these efficiency points represent the efficiency of the PM brushed motor at different operating conditions.
- Driving cycles: We'll consider three standard driving cycles to evaluate energy consumption and temperature rise. These driving cycles define the speed-time profiles for the rickshaw during a trip.
Assumed Data: To proceed with the model, we need to make some assumptions. Let's assume the following parameters:
- Motor controller efficiency points: 90% at full load, 85% at half load, and 80% at no load.
- Motor efficiency points: 85% at full load, 80% at half load, and 75% at no load.
- Driving cycles: Urban cycle, highway cycle, and mixed cycle. These cycles will have different speed-time profiles.
Excel Sheet: To organize the input and assumed data, we'll create an Excel sheet with the following columns:
- Driving Cycle: Urban, Highway, Mixed
- Speed (km/h): Time-varying speed profiles for each driving cycle.
- Motor Controller Efficiency: Efficiency values based on the assumed efficiency points for different load conditions.
- Motor Efficiency: Efficiency values based on the assumed efficiency points for different load conditions.
- Energy Consumption (kWh): Calculated energy consumption for each driving cycle based on the speed profile and efficiencies.
- Temperature Rise of Motor (°C): Calculated temperature rise of the motor based on the energy consumption and assumed thermal characteristics.
- Temperature Rise of Controller (°C): Calculated temperature rise of the motor controller based on the energy consumption and assumed thermal characteristics.
Result:-
Electric rickshaws (also known as electric tuk-tuks or e-rickshaws or toto or e-tricycles) have been becoming more popular in some cities since 2008 as an alternative to auto rickshaws and pulled ricksaws. This popularity is due to their lower fuel cost and ease of use compared to human-pulled rickshaws. They are being widely accepted as an alternative to petro/diesel/CNG auto rickshaws. They are three-wheelers powered by an electric motor ranging from 650 to 1400 Watts. They are mostly manufactured in India and China. Battery-run rickshaws could be a low-emitter complementary transport for the low-income people, who suffer most from a lack of transport facility, if introduced in a systematic manner according to experts.
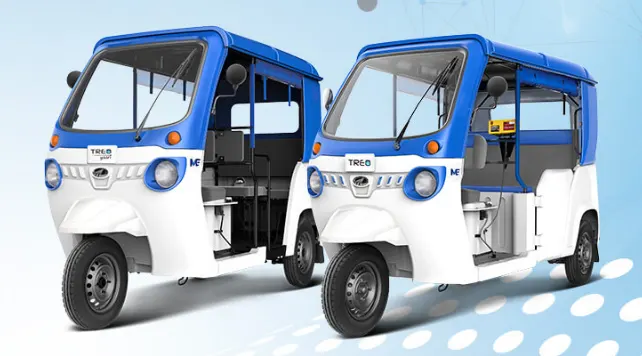
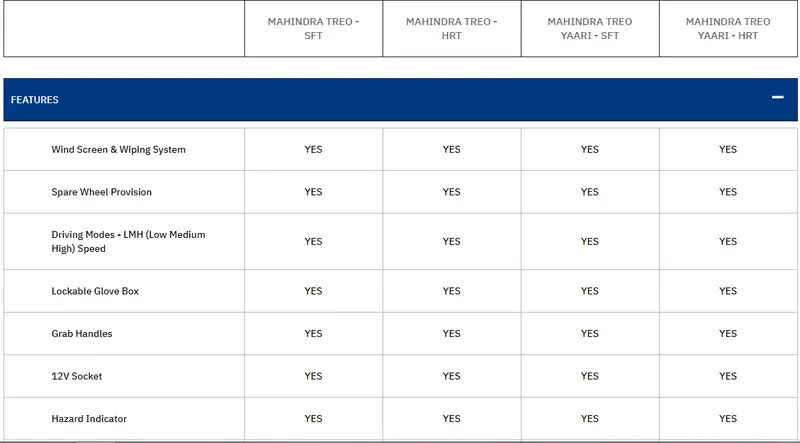
Mahindra Treo is a revolutionary new range of electric autos, e-rickshaw and cargo version. Powered by the advanced Lithium-ion technology, Mahindra Treo offers higher savings, superior ride quality and best in-class interior space. Ride the change with Mahindra Treo for a better tomorrow.
1)- Low running cost of only 50 paise per km, leading to savings of up to ₹ 45 000.00 every year in fuel cost.
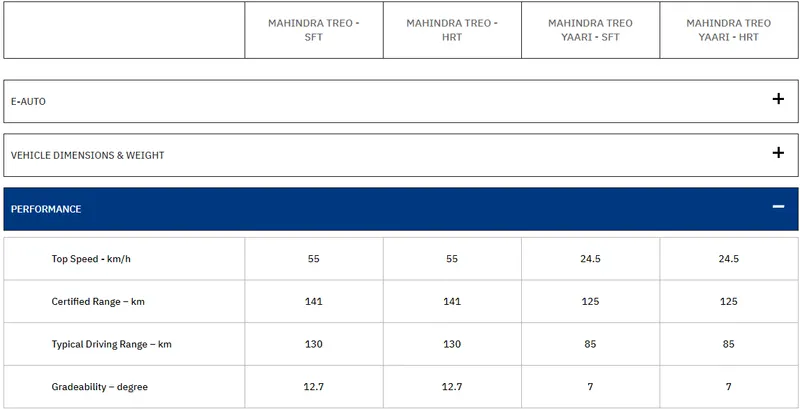
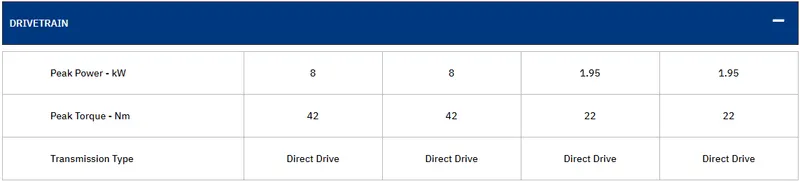
2)- The new powerful AC induction motor now has a highest power of 8 kW with a higher top speed of 55 kmph.
3)- With 42 Nm torque Treo offers best-in-segment acceleration of 0-20 km/h in 2.3 s which makes driving an enjoyable experience.
4)- Mahindra Treo’s high gradeability of 12.7 degree makes it easy to climb slopes & flyovers which is the best-in-segment.

5)- With the longest wheelbase of 2073 mm the Mahindra Treo offers best-in-segment comfort with more leg room as well as easy entry and egress for all age groups.
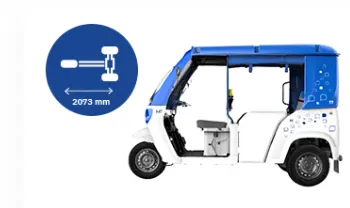
6)- Treo's IP 67 rated motor gives enhanced protection from water & dust entry. The in-built rear crash guard protects passengers in case of impact on the rear side. The optional hard top roof provides all-year weather protection.
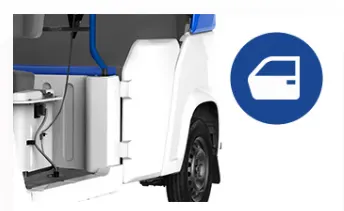
7)- Mahindra Treo offers side doors making the ride much safer for the passengers.
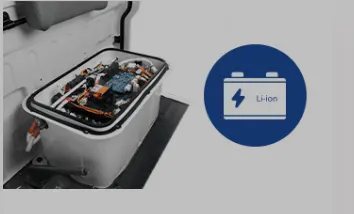
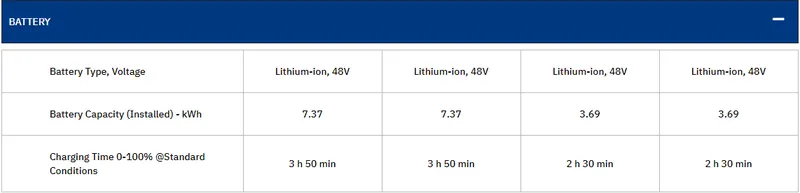
8)- Zero maintenance, lithium-ion battery with 3 years standard warranty & minimum 1 50 000 km of life.
9)- Space-frame architecture along with corrosion free modular SMC panels for dent free body, and easy repair or replacement.
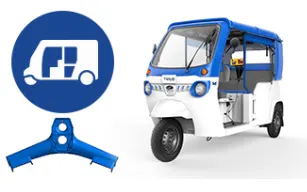
10)- Remote monitoring of range, speed, location and more for Next Generation Mobility* and efficient utilisation of fleet.

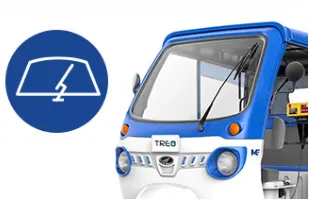
11)- Larger windscreen area ensures great visibility for maneuvering in bumper-to- bumper traffic.
12)- The new Mahindra Treo is powered by advanced lithium-ion technology and can travel for up to 131 km (typical driving range) on a single charge and has a certified range of 141 km.
13)- Zero pollution and noiseless drive, making Treo environment friendly.
14)- Kinetic energy generated on braking is fed back into the battery, thereby ensuring minimum wastage of energy.
15)- Charing the Treo is as simple as charging a mobile phone. Just 3 h 50 min to charge Treo and 2 h 30 min for Treo Yaari. A top up during lunch break can give you over 20km of additional running. It can be charged anywhere as it comes with a portable charger and can be charged using a 15 A socket.
16)- The drive by wire technology in Treo makes it very easy to drive the vehicle. The noise-less, vibration-free, comfortable ride gives a fatigue-free experience to drivers as well as passengers. Its seats are specially designed for driver and passenger comfort. The ergonomically designed brake pedal offers effortless breaking.
17)- Treo's spacious interiors ensures ample leg space for everyone. The electric Auto also caters to luggage space for connectivity to bus stations and railway stations.
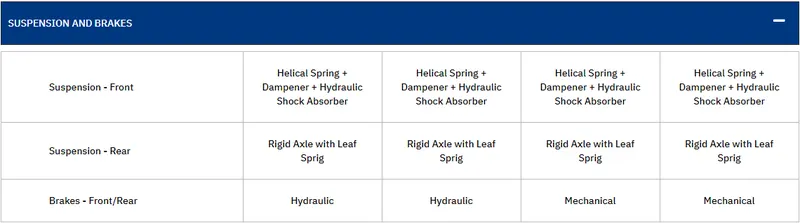
Specification:-
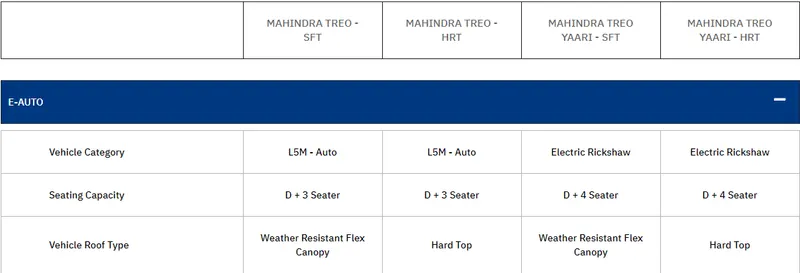
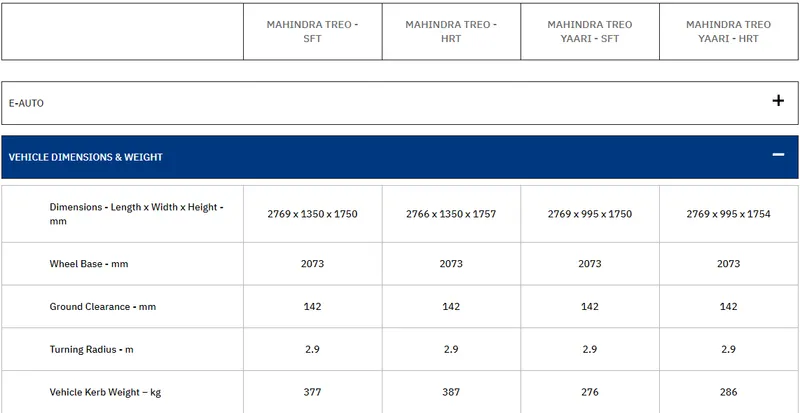

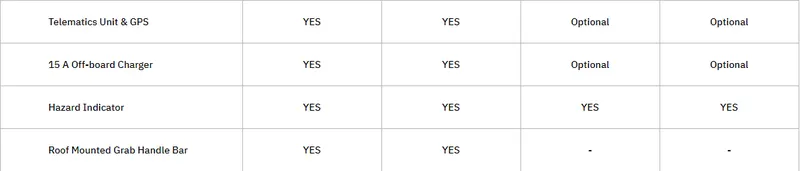
Features:-
Procedure of the model:-
- Firstly identify what amount of Propulsion power required for the vehicle.
- Identify the suitable motor as per the propulsion power.
- Then identify battery range and type of that battery as per motor and controller type.
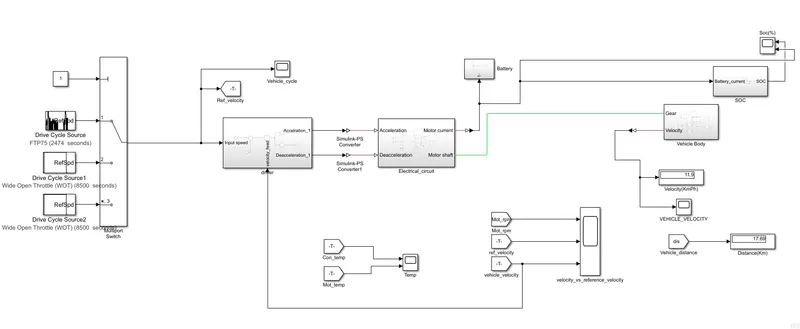
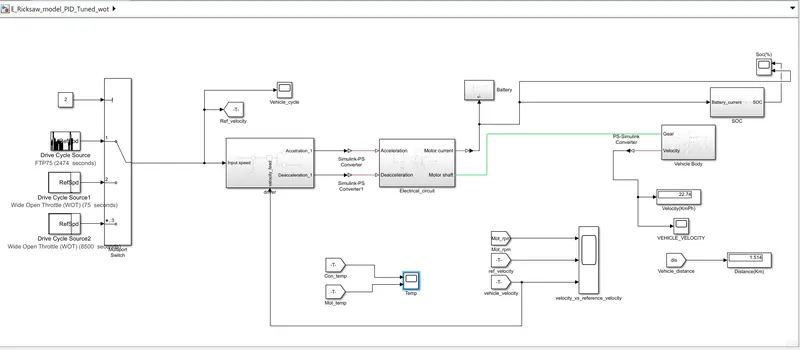
We have divided the model into some parts.
- Input source
- Wheel and Vehicle body
- Electric system
- Battery system and SOC
- controller
Wheel and Vehicle body:-
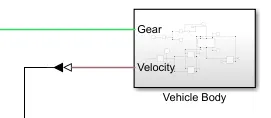
Subsystem of Vehicle Body and Wheel:-
The above block is forming a subsystem which serves as a part of the whole vehicle. Three tires are connected where the right two tires are the rear wheels and left one tire are the front wheels. They are interconnected to the hub of the vehicle body block. And their respective axles are connected accordingly. We here have connected the rear axle with the gear as we want the model to be a rear wheel drive vehicle. Here the wind velocity part and hill climbing angle ports are connected to physical constant blocks which is kept as zero.
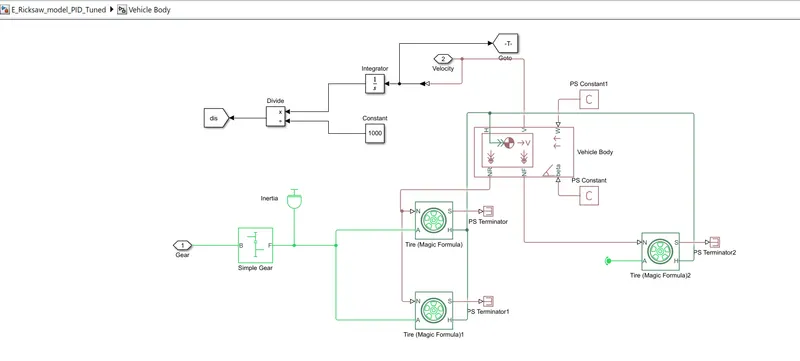
Vehicle Body:-
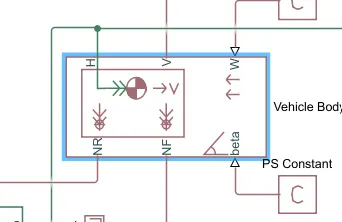
The Vehicle Body block represents a two-axle vehicle body in longitudinal motion. The vehicle can have the same or a different number of wheels on each axle. For example, two wheels on the front axle and one wheel on the rear axle. The vehicle wheels are assumed identical in size. The vehicle can also have a center of gravity (CG) that is at or below the plane of travel.
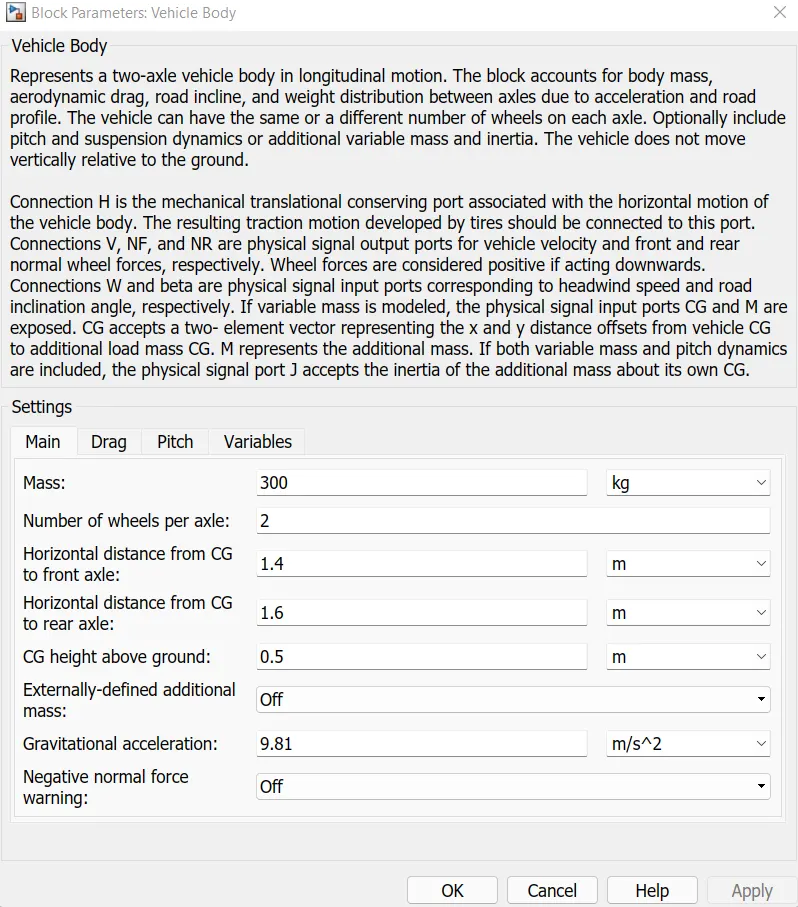
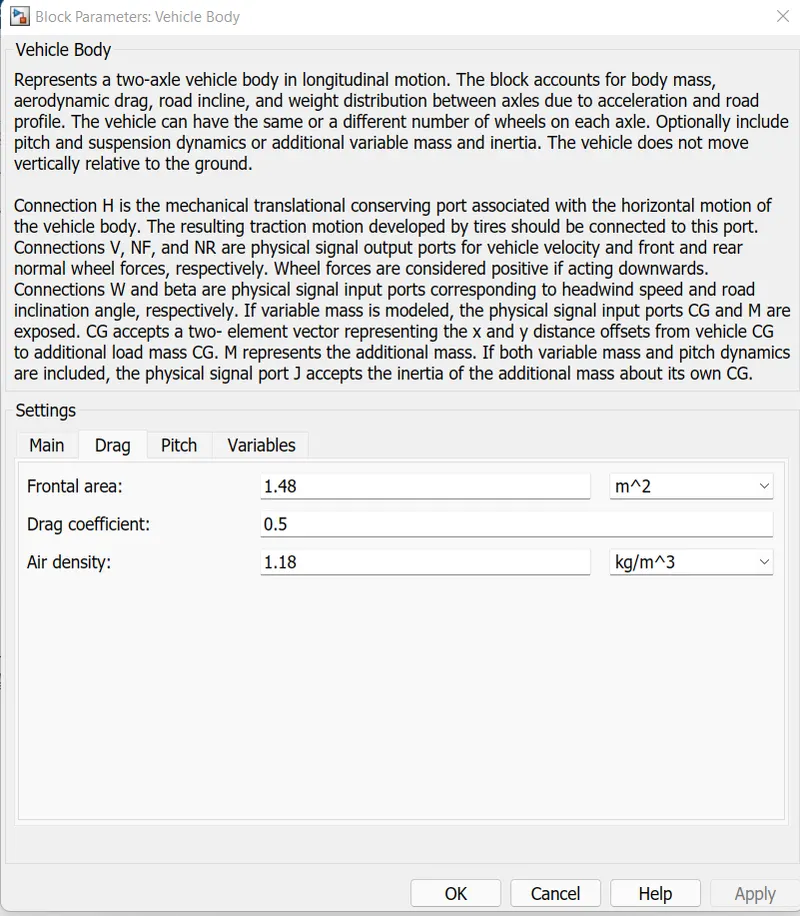
The block accounts for body mass, aerodynamic drag, road incline, and weight distribution between axles due to acceleration and road profile. Optionally include pitch and suspension dynamics. The vehicle does not move vertically relative to the ground.
The block has an option to include an externally-defined mass and an externally-defined inertia. The mass, inertia, and center of gravity of the vehicle body can vary over the course of simulation in response to system changes.
- H this stands for hub and is used to connects the hubs of the wheels to the main body of the vehicle.
- V physical signal output port which stands for velocity and is used the output the velocity of the vehicle.
- W physical signal port and allow us to model a wind velocity that acts against the vehicle.
- NR physical signal output port to connect to the rear wheels.
- NF physical signal output port to connect the front wheels of the vehicle.
- Beta physical signal input port which allow the vehicle to undergo an inclination of hill climbing force
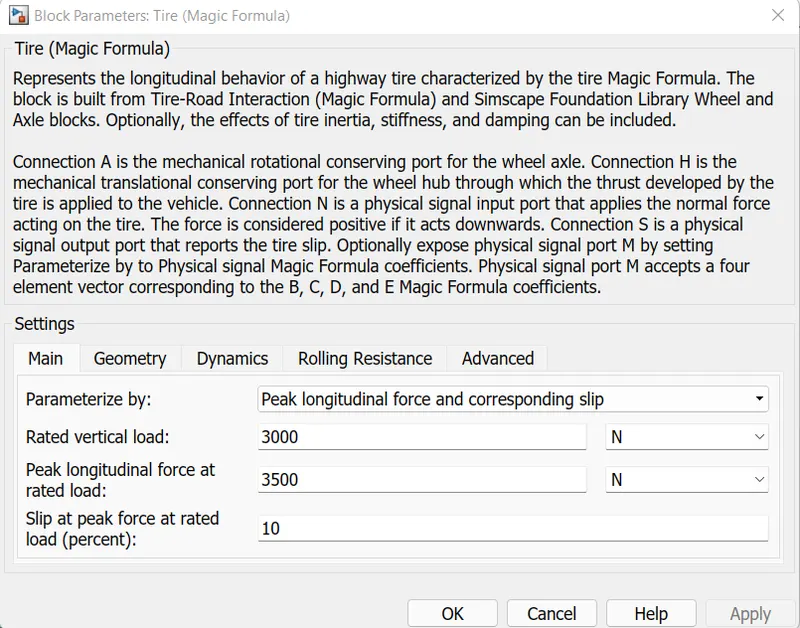
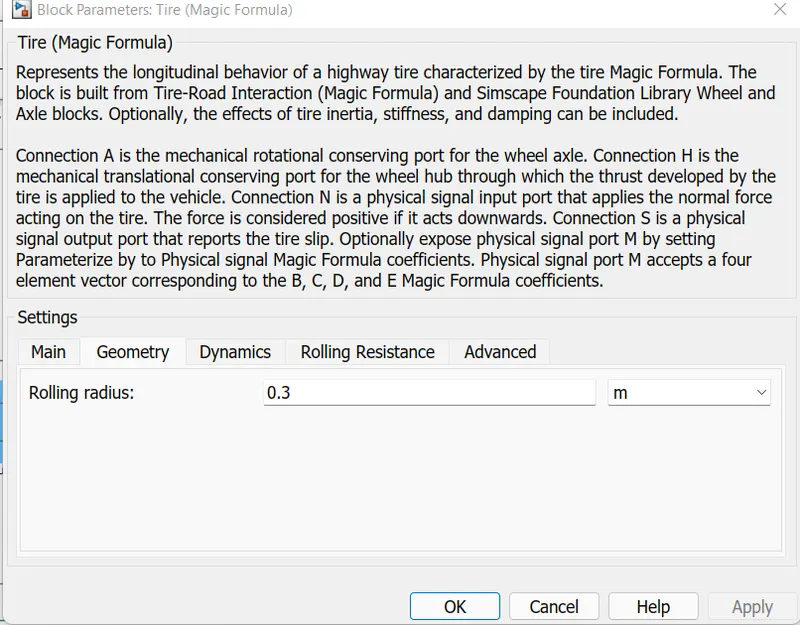
Tire(Magic Formula):-
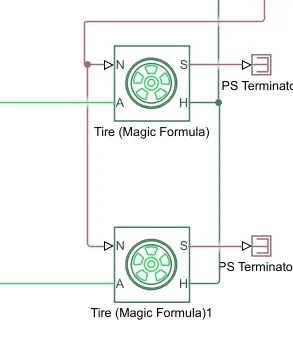
The Tire (Magic Formula) block models a tire with longitudinal behavior given by the Magic Formula [1], an empirical equation based on four fitting coefficients. The block can model tire dynamics under constant or variable pavement conditions.
The longitudinal direction of the tire is the same as its direction of motion as it rolls on pavement. This block is a structural component based on the Tire road interaction(Magic formula) block.
To increase the fidelity of the tire model, you can specify properties such as tire compliance, inertia, and rolling resistance. However, these properties increase the complexity of the tire model and can slow down simulation. Consider ignoring tire compliance and inertia if simulating the model in real time or if preparing the model for hardware-in-the-loop (HIL) simulation.
- Connection A is the mechanical rotational conserving port of the wheel axle.
- Connection H is the mechanical rotational conserving port of the wheel hub through which the Thurst developed.
- Connection N is the physical signal input port that applies the normal force acting on the tire.
- Connection S is the physical sinal output port that reports the tire slip.
Simple gear:-
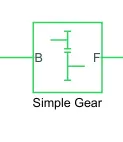
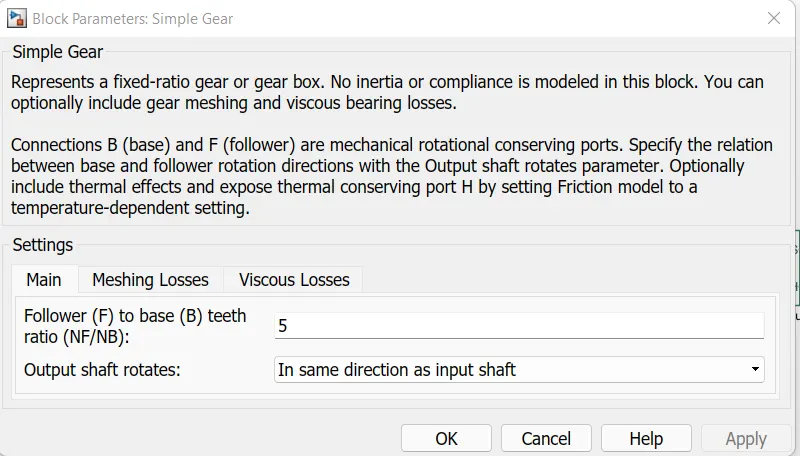
This block models a gear system with fixed gear ratio with no intertia effects. However we can modify the messing of the gear teeth, Here the follower to base teeth ratio has been set to 2 and the output shaft rotates in the same direction as the input shaft.
These blocks are forming a subsystem which serves as a part of the whole vehicle. Four tires are connected where the right two tires are front wheel and the left two tires are rear wheel. They are interconnected with the vehicle by the Hub port and the axle are also connected accordingly. Here we have connected the rear axle with the gear as we want the model to be a rear wheel drive vehicle.
Electrical Circuit Sub system:-
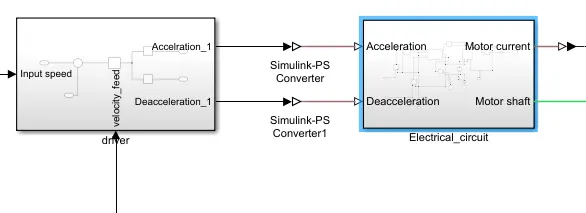
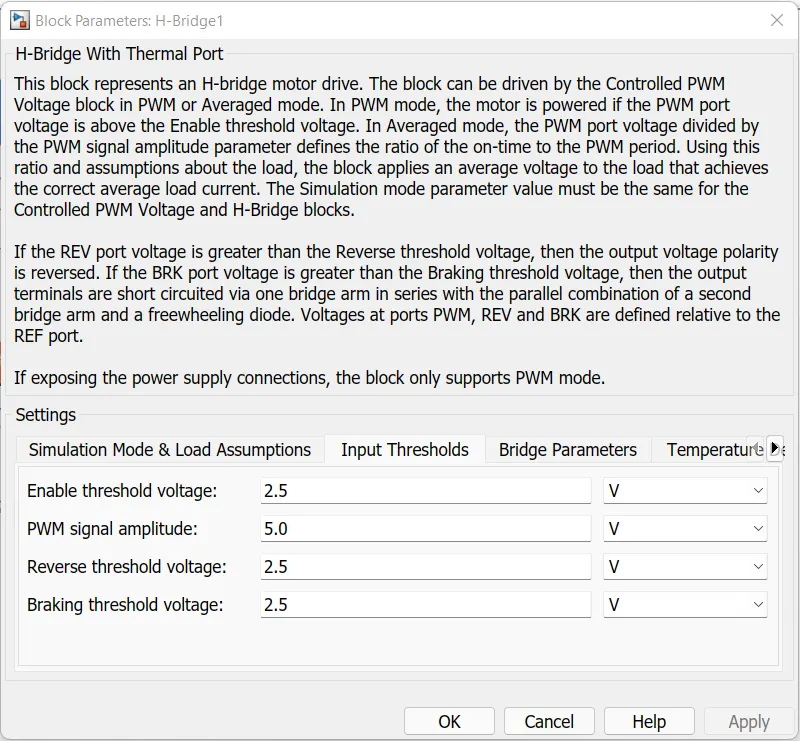
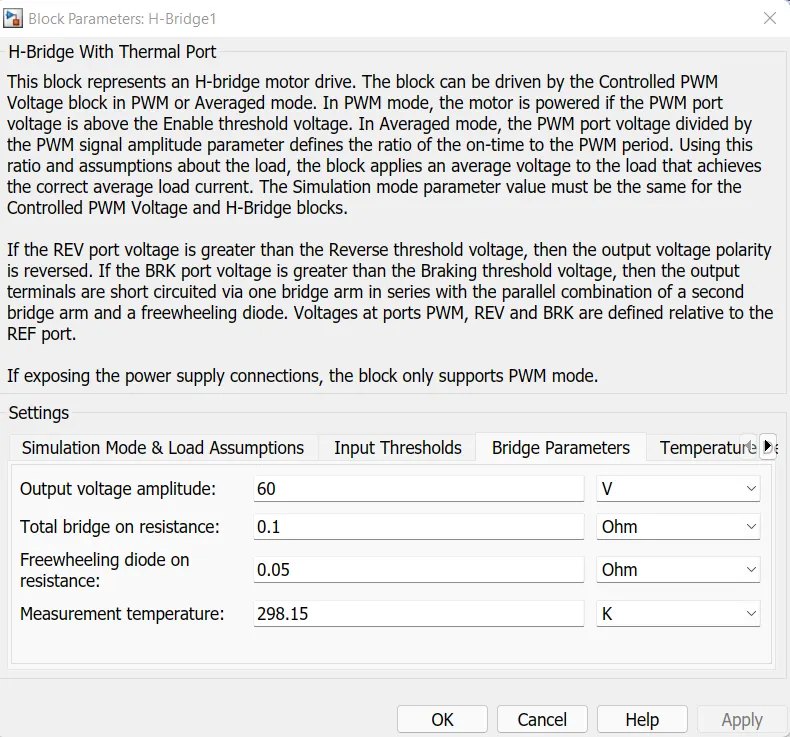
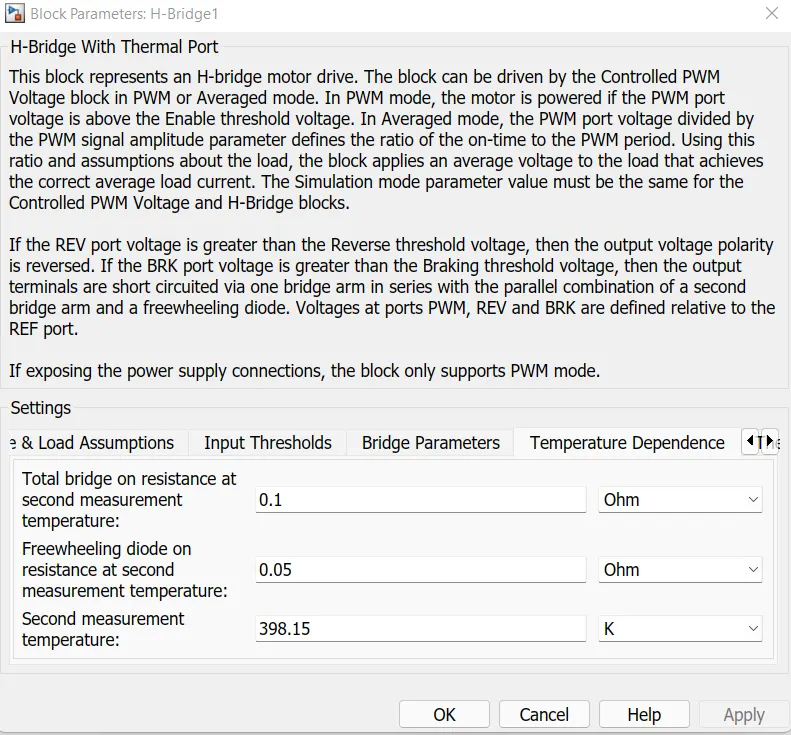
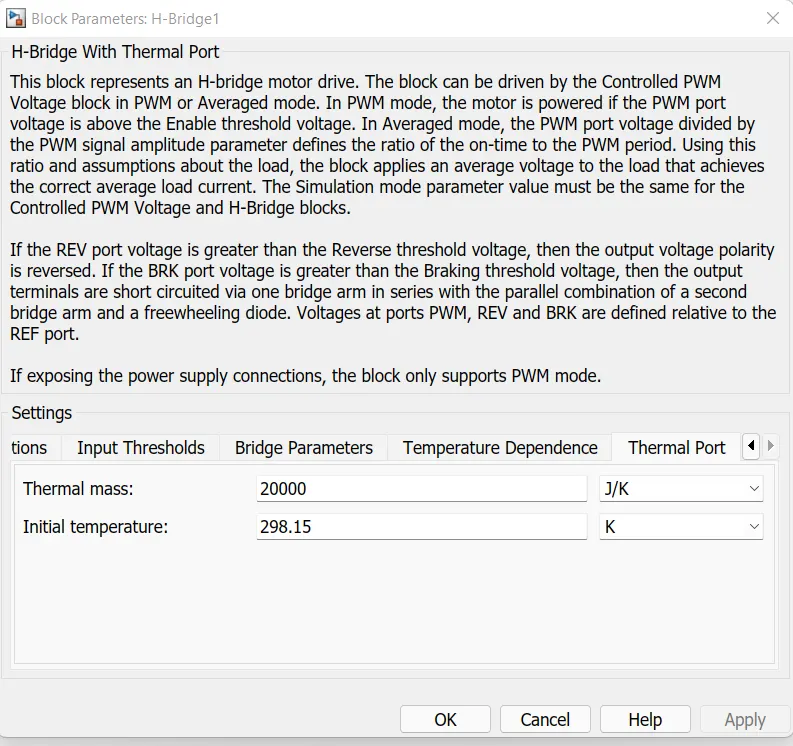
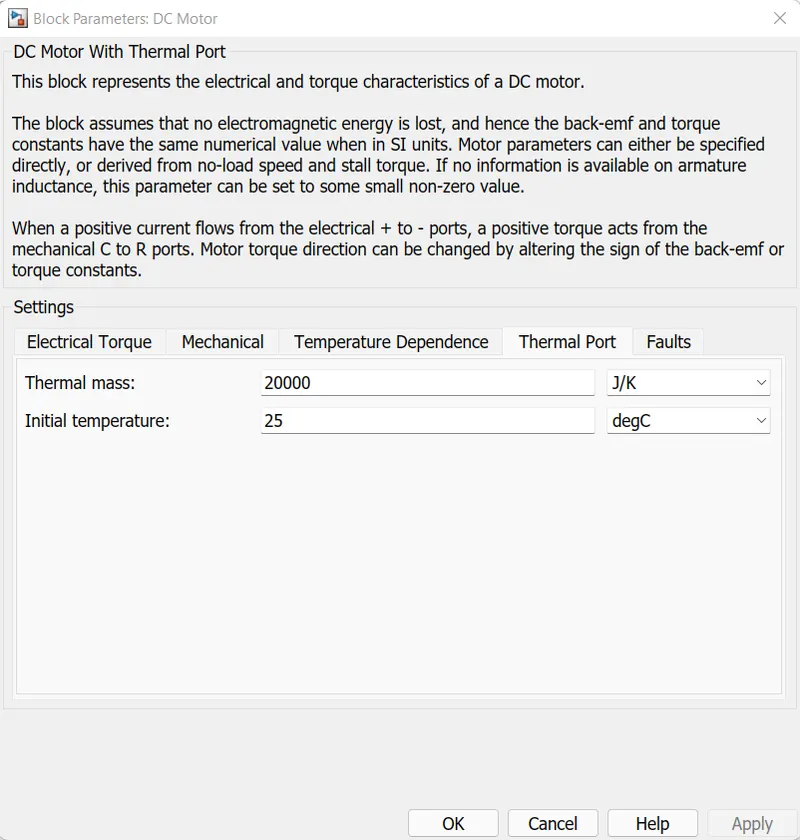
In the Electrical circuit subsystem we have H bridge which is fed by PWM controller method. By this H bridge we are providing supply to DC motor to control the speed and other parameters. We have thermal port as well in H bridge and in DC motor which helps to determine the temp of them during running.
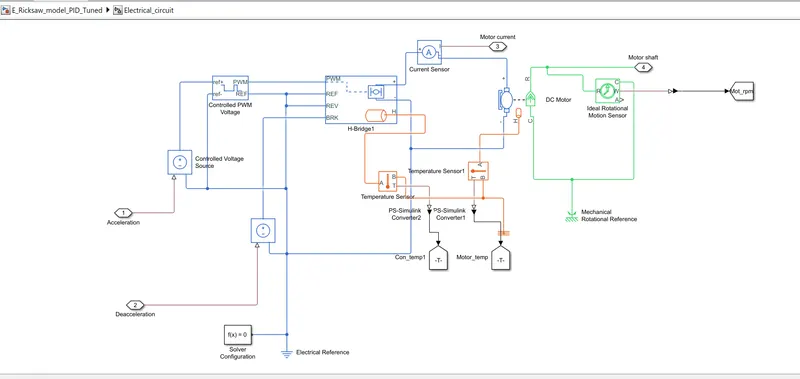
Controlled PWM voltage:-
-
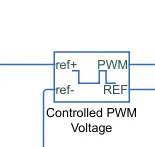
Electrical input ports — The block calculates the duty cycle based on the reference voltage across its ref+ and ref- ports. This modeling variant is the default.
-
PS input — Specify the duty cycle value directly by using an input physical signal port.
-
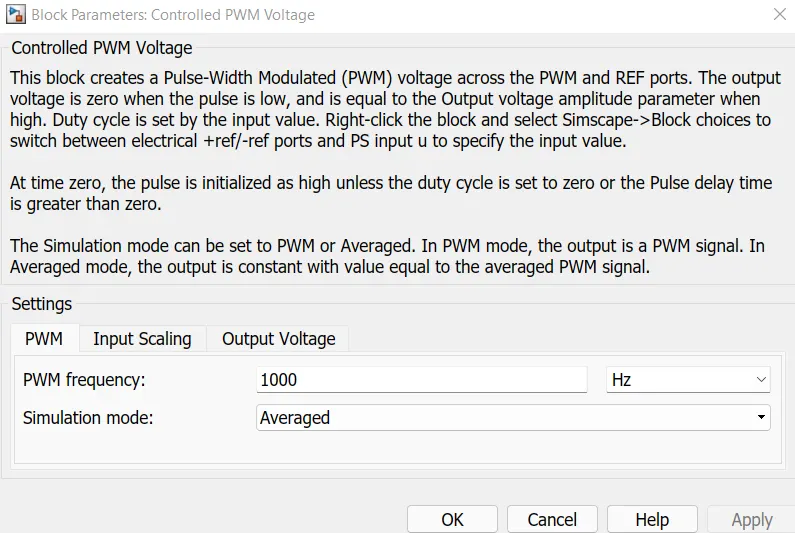
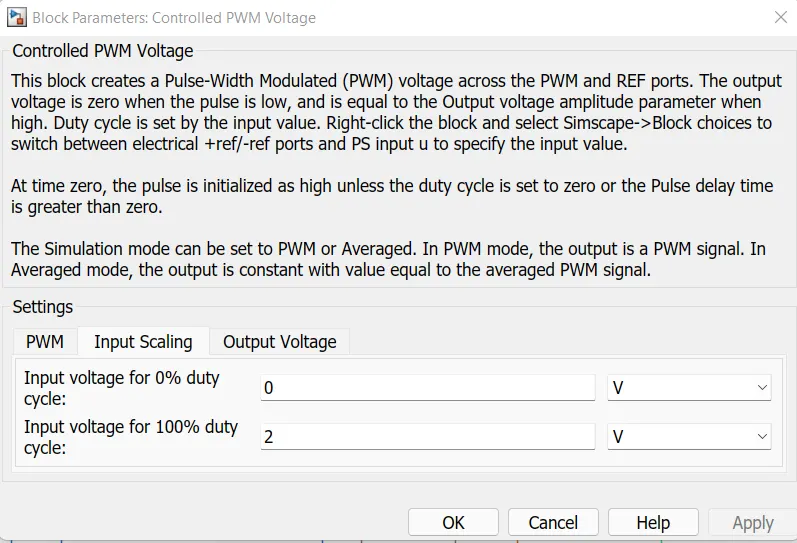
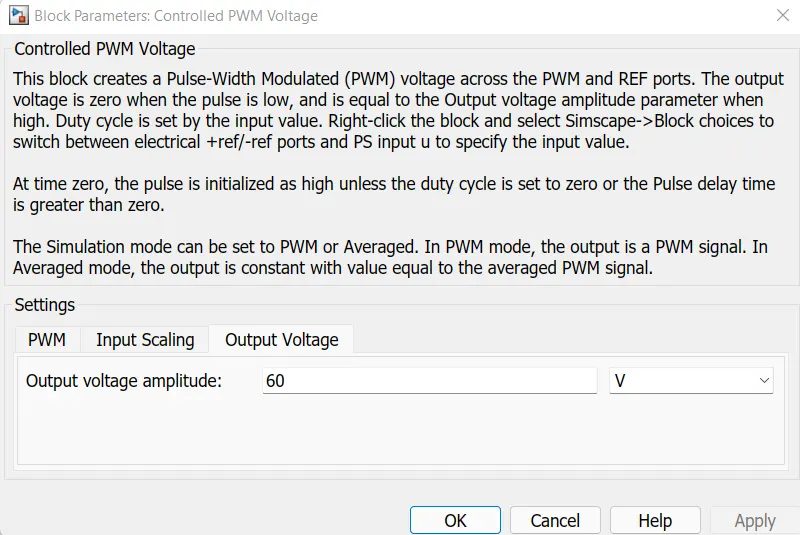
Next i have used a controlled PWM voltage to provide a controlled pulse width modulated voltage to the H-bridge block. The pulse of voltage created by this block are dependent on the duty cycle which is in that ratio of the time that the switch is ON to the time taken for one cycle. The duty cycle formula is given by
Duty cycle:- Ton/(Ton+Toff)
Ton/Tcyc, Where Tcyc= time taken for one cycle
For the Electrical input ports variant of the block, the demanded duty cycle is
100∗Vref−VminVmax−Vmin percent
where:
-
Vref is the reference voltage across the ref+ and ref- ports.
-
Vmin is the minimum reference voltage.
-
Vmax is the maximum reference voltage.
The value of the Output voltage amplitude parameter determines amplitude of the output voltage.
At time zero, the pulse is initialized as high, unless the Pulse delay time parameter is greater than zero, or the demanded duty cycle is zero.
H-bridge:-
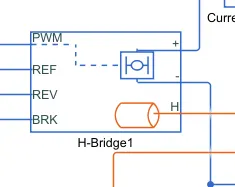
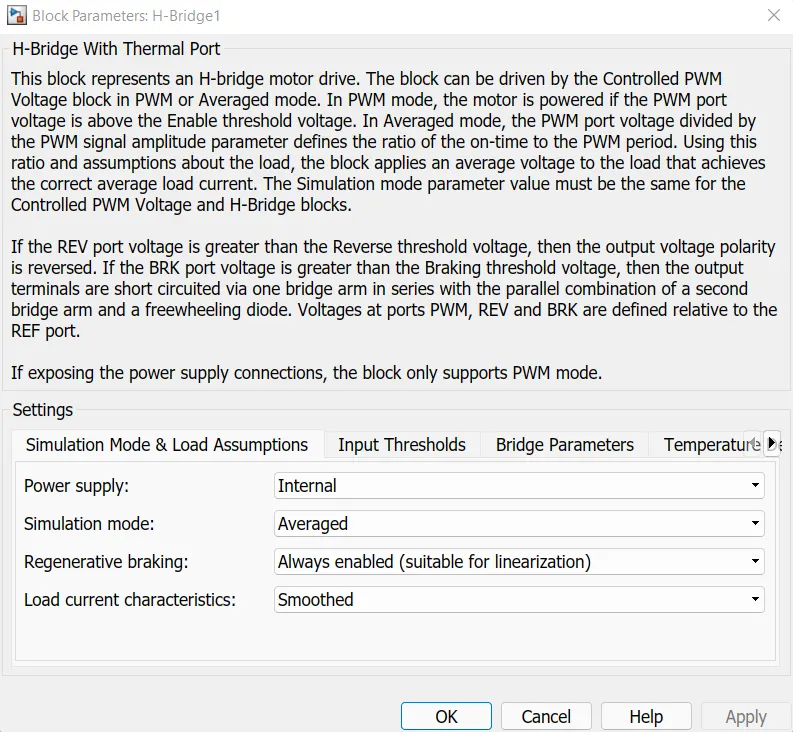
The H-Bridge block represents an H-bridge motor driver. The block has the following two Simulation mode options:
-
PWM— The H-Bridge block output is a controlled voltage that depends on the input signal at the PWM port. If the input signal has a value greater than the Enable threshold voltage parameter value, the H-Bridge block output is on and has a value equal to the value of the Output voltage amplitude parameter. If it has a value less than the Enable threshold voltage parameter value, the block maintains the load circuit using one of the following three Freewheeling mode options:if the PWM frequency is large enough. Synchronous operation where freewheeling is via a bridge arm back to the supply also helps smooth the current. For cases where the current is not smooth, or possibly discontinuous (that is, it goes to zero between PWM cycles), use theUnsmoothed or discontinuousoption. For this option, you must also provide values for the Total load series resistance, Total load series inductance, and PWM frequency. During simulation, the block uses these values to calculate a more accurate value for H-bridge output voltage that achieves the same average current as would be present if simulating in PWM mode.
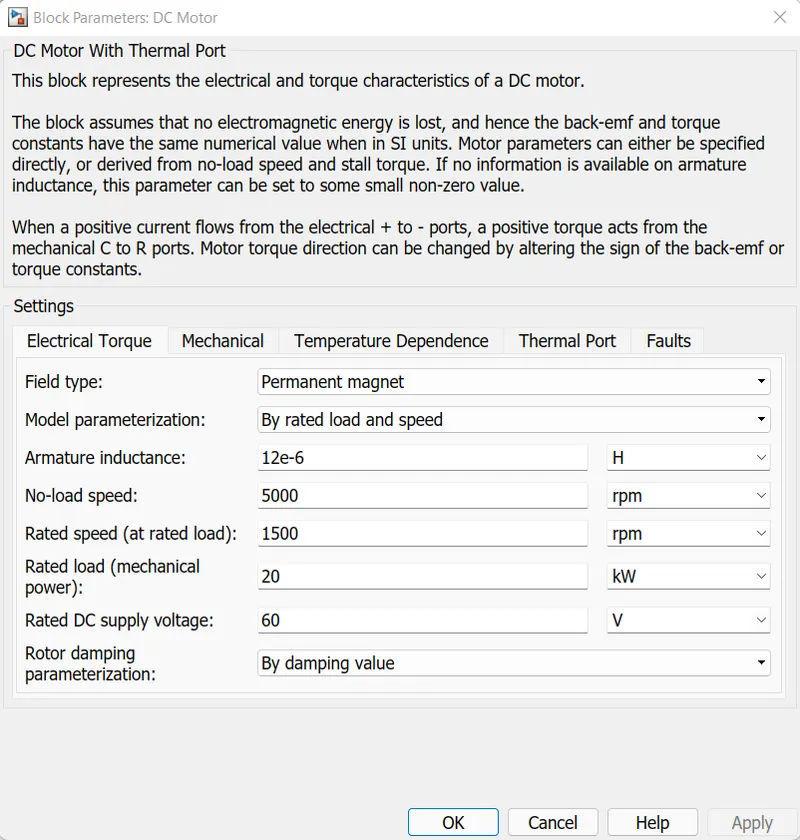
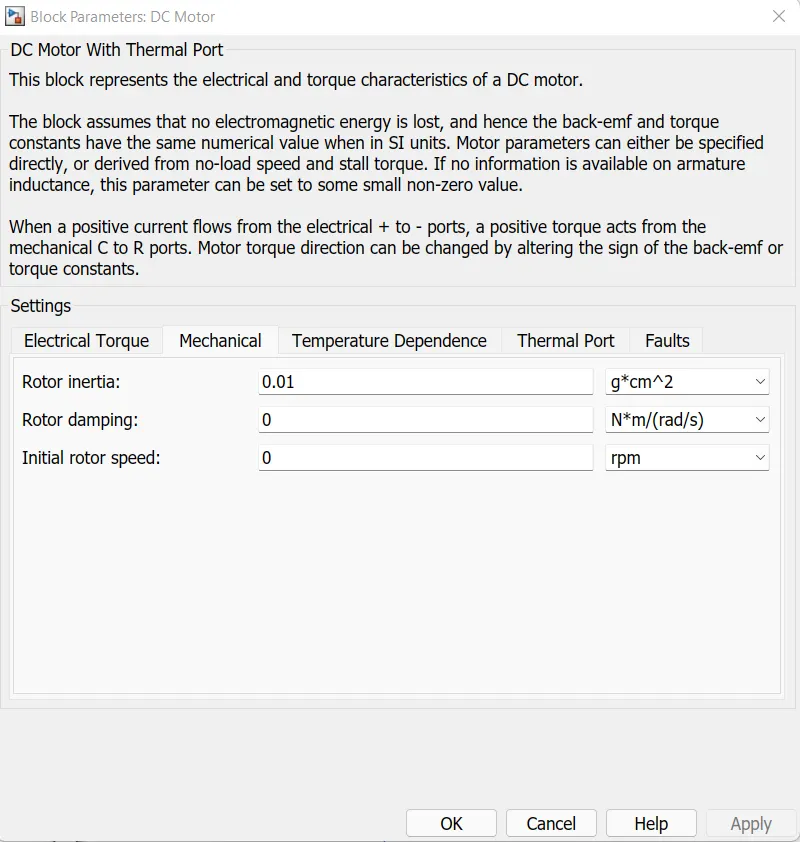
DC motor:-
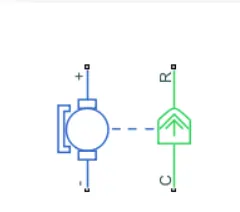
The DC Motor block represents the electrical and torque characteristics of a DC motor using the following equivalent circuit model:
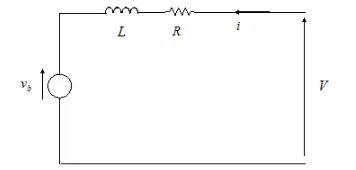
You specify the equivalent circuit parameters for this model when you set the Model parameterization parameter to By equivalent circuit parameters. The resistor R corresponds to the resistance you specify in the Armature resistance parameter. The inductor L corresponds to the inductance you specify in the Armature inductance parameter.
You can specify how to generate the magnetic field of the DC motor by setting the Field type parameter to the desired option. The permanent magnets in the motor induce the following back emf vb in the armature:

where kv is the Back-emf constant and ω is the angular velocity. The motor produces the following torque, which is proportional to the motor current i:
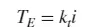
where kt is the Torque constant. The DC Motor block assumes that there are no electromagnetic losses. This means that mechanical power is equal to the electrical power dissipated by the back emf in the armature. Equating these two terms gives:
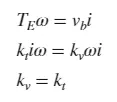
As a result, you specify either kv or kt in the block parameters.
If the magnetic field is generated from the current flowing through the windings, the Back-emf constant depends on the field current If:
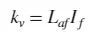
where Laf is the Field-armature mutual inductance.
The torque-speed characteristic for the DC Motor block is related to the parameters in the preceding figure. When you set the Model parameterization parameter to By stall torque & no-load speed or By rated power, rated speed & no-load speed, the block solves for the equivalent circuit parameters as follows:
-
For the steady-state torque-speed relationship, L has no effect.
-
Sum the voltages around the loop and rearrange for i:
Temperature sensor:-
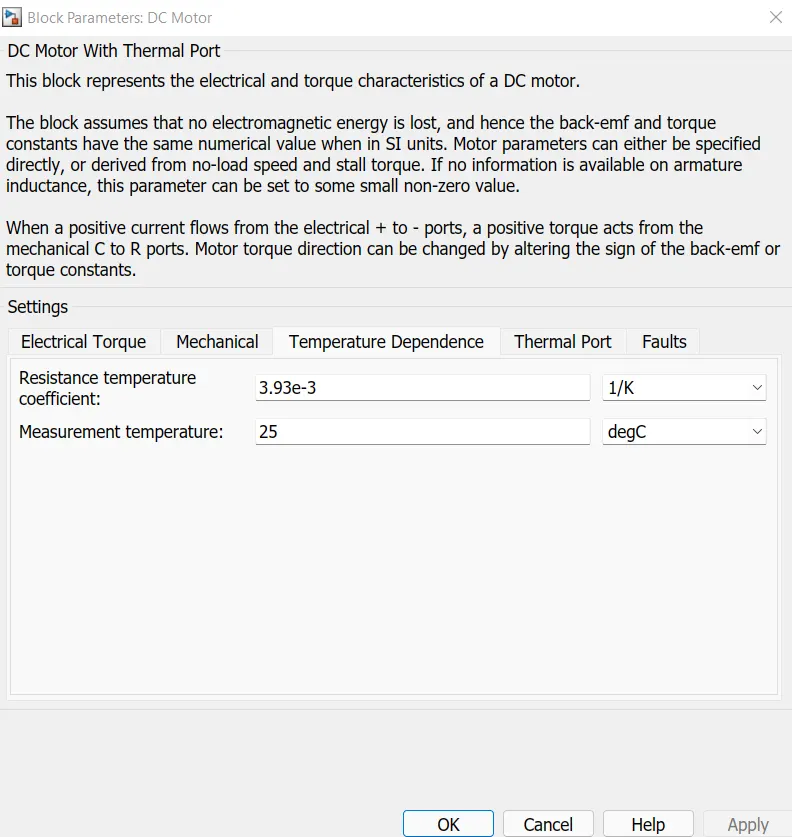
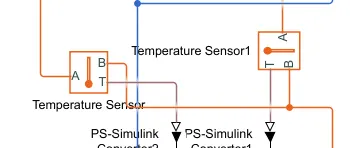
Use the thermal port to simulate the effect of copper resistance losses that convert electrical power into heat. For more information using thermal ports and on the temperature dependence and thermal port parameter.
The thermal port T reports the temperature difference across the sensor. The measurment is positive when the temperature at port A is greater than the temperature at port B.
Battery system & SOC:-
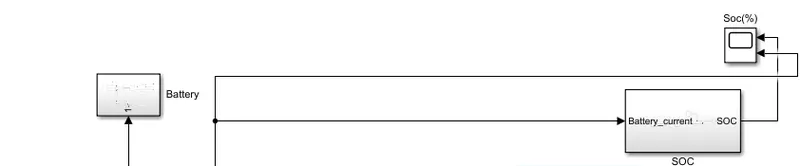
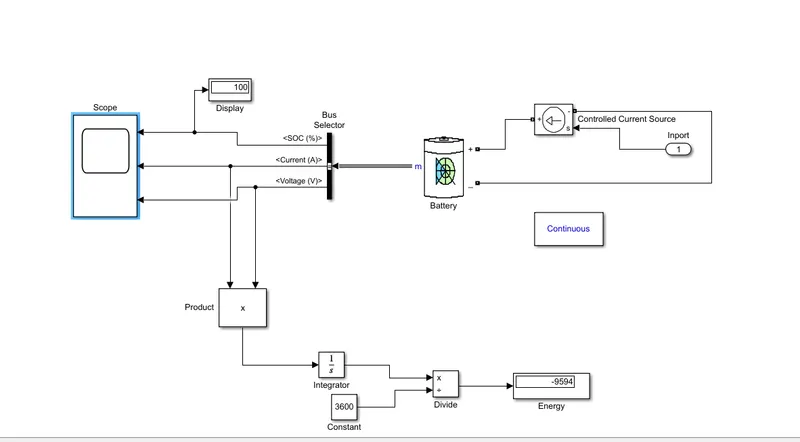
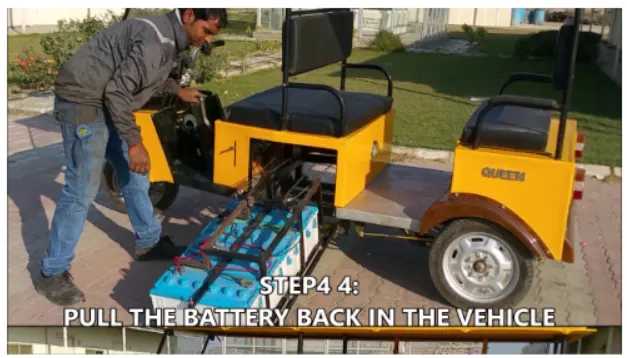
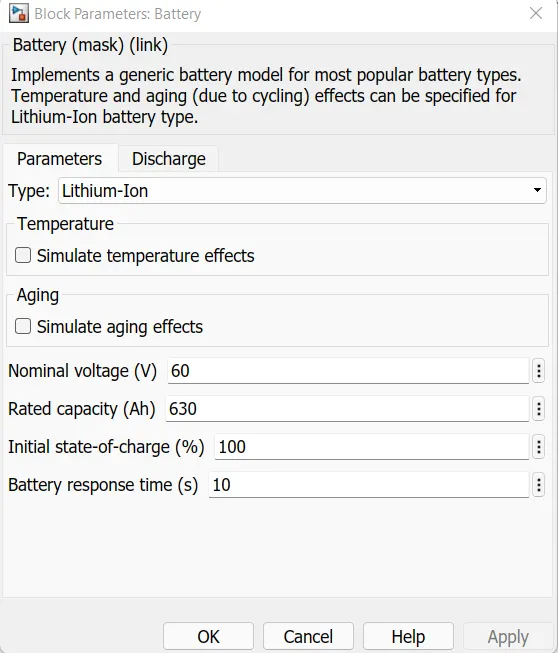
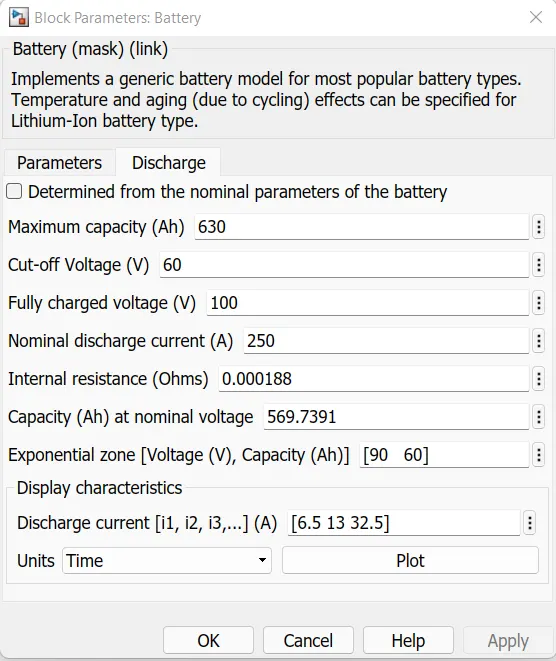
To need power for motor and other equipment we give battery pack. This battery pack is decided by the rating of motor and considering other electrical loads. So we used lithium ion battery. Implement a generic battery model which is the most popular battery model.
State of charge(SOC):-
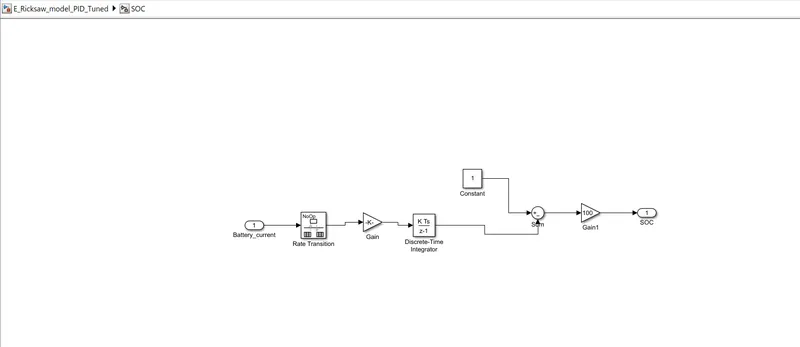
For the SOC calculation we have used several block hich are following below.
Rate transition:- Handle data transfer between between different rates and tasks.
Gain:- Element wise or matrix gain where by battery voltage is 60V. So my formula is like 1/(60*3600).
Discrete time interator:- Discrete time integrator or accumulation of the input signal.
Port and Source model:-
We have multiport switch where we have used three types of drivin cycle for the different calculation of the battery power, temperature of the motor and converter etc.
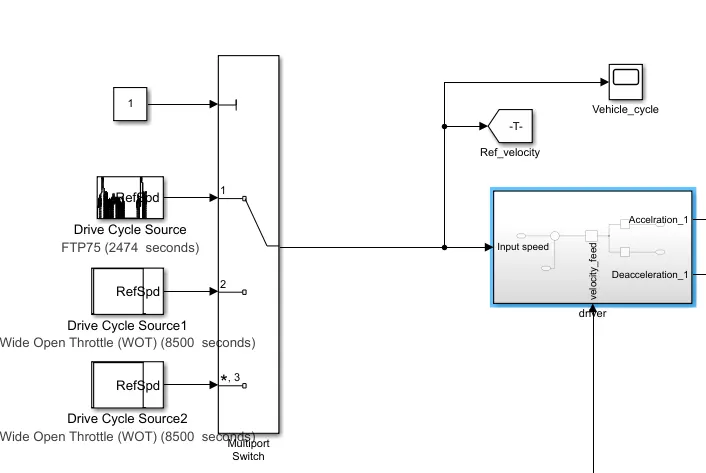
here we have deigned the source model for the feeding of the motor.
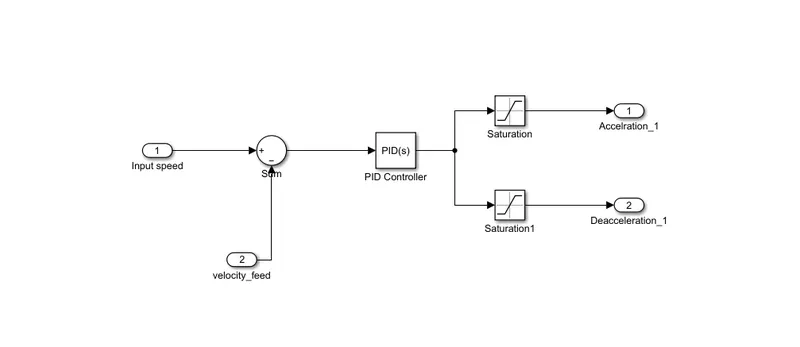
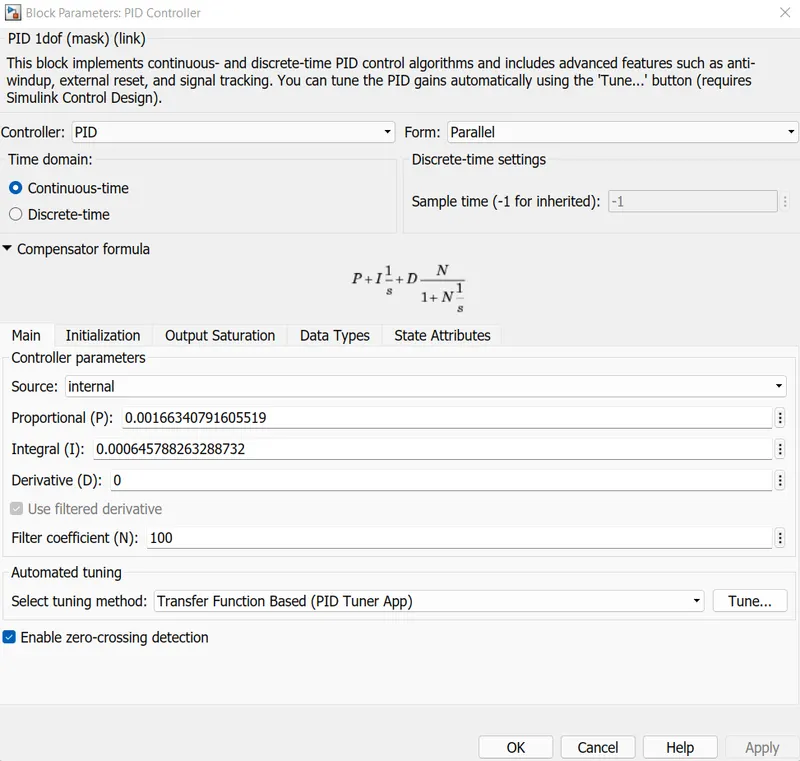
PID Controller:-
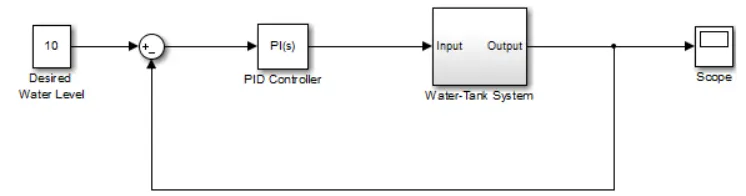
The PID Controller block implements a PID controller (PID, PI, PD, P only, or I only). The block is identical to the Discrete PID controller block with the Time domain parameter set to Continuous-time.
The block output is a weighted sum of the input signal, the integral of the input signal, and the derivative of the input signal. The weights are the proportional, integral, and derivative gain parameters. A first-order pole filters the derivative action.
The block supports several controller types and structures. Configurable options in the block include:
-
Controller type (PID, PI, PD, P only, or I only) — See the Controller parameter.
-
Controller form (Parallel or Ideal) — See the Form parameter.
-
Time domain (continuous or discrete) — See the Time domain parameter.
-
Initial conditions and reset trigger — See the Source and External reset parameters.
-
Output saturation limits and built-in anti-windup mechanism — See the Limit output parameter.
-
Signal tracking for bumpless control transfer and multiloop control — See the Enable tracking mode parameter.
Saturation:-
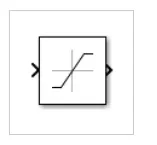
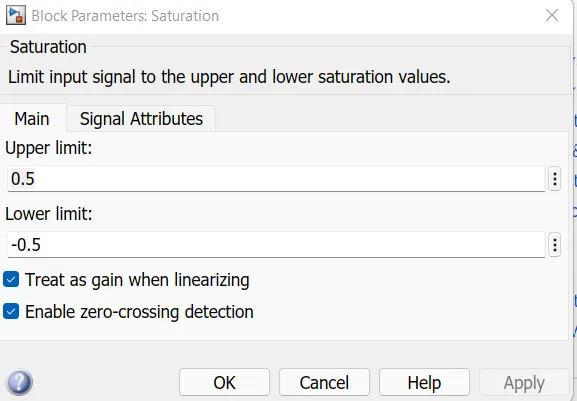
The Saturation block produces an output signal that is the value of the input signal bounded to the upper and lower saturation values. The upper and lower limits are specified by the parameters Upper limit and Lower limit.
| Input | Output |
|---|---|
| Lower limit ≤ Input value ≤ Upper limit | Input value |
| Input value < Lower limit | Lower limit |
| Input value > Upper limit | Upper limit |
Cases:- We will run the model into three different courses
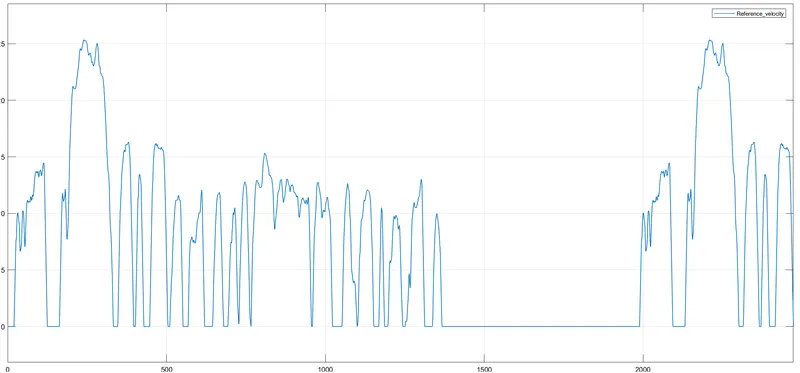
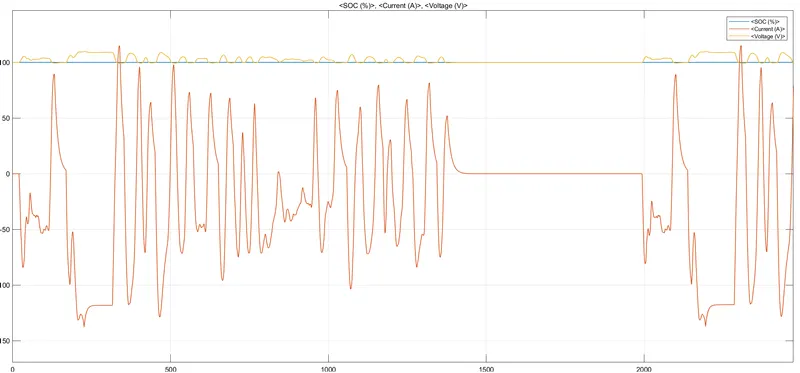
Case 1:- Firstly we will run the model by FTP75 cycle for 2475 secs to see the behaviour of all parameter by tuned PID.
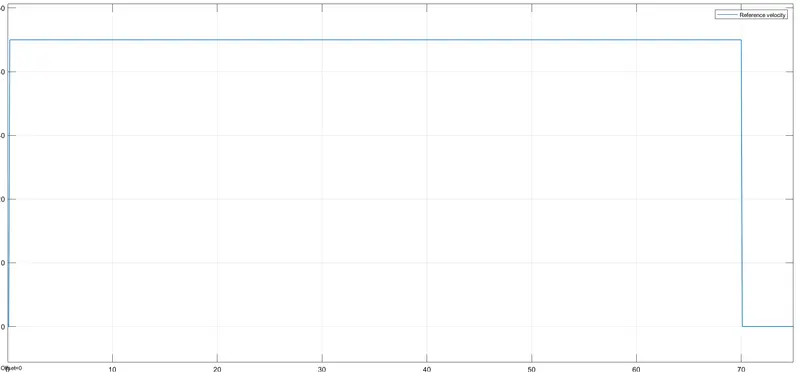
Case 2:- Secondaly we will take the test of the model by WOT cycle for 75 secs to see the parameter behaviour by tuned PID.
Case 3:- At last we will take WOT cycle to maintain the speed of 45Kmph for 100Km to see the behaviour of parameter by tuned PID.
Case 1:- Firstly we will run the model by FTP75 cycle for 2475 secs to see the behaviour of all parameter by tuned PID.
Reference Velocity:-
Battery SOC, Current % Voltage:-
Battery SOC & motor Current:-
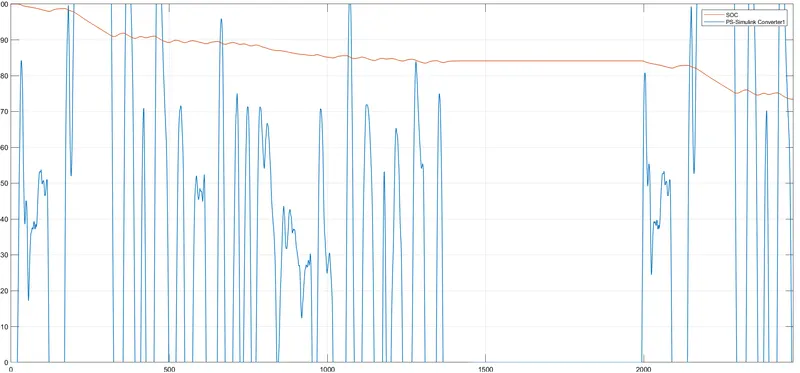
SOC of the system is 75%.
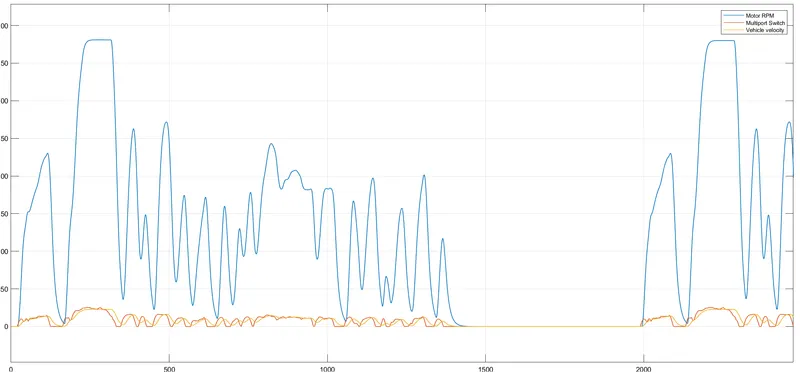
Motor RPM Vs Vehicle velocity Vs Reference velocity:-
Motor and converter Temp:-
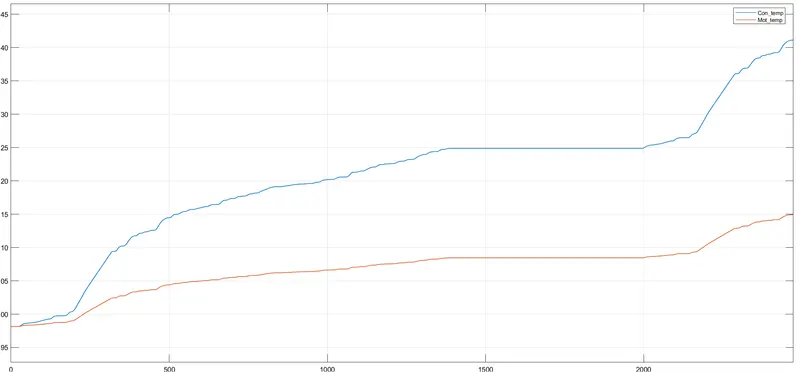
Converter temp is more than motor temp.
Converter temp is 298-342K and motor temp is 298-315K.
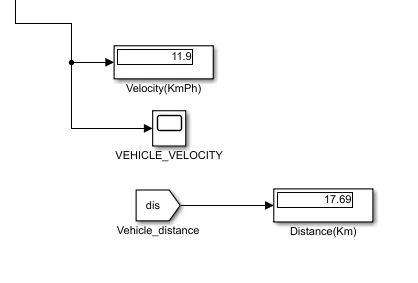
Distance covered 17.69 Km with the velocity of 11.9KmPh as pe rthe this driving cycle.
Case 2:- Secondaly we will take the test of the model by WOT cycle for 75 secs to see the parameter behaviour by tuned PID.
Reference Velocity:-
Battery SOC, Current & Voltage:-
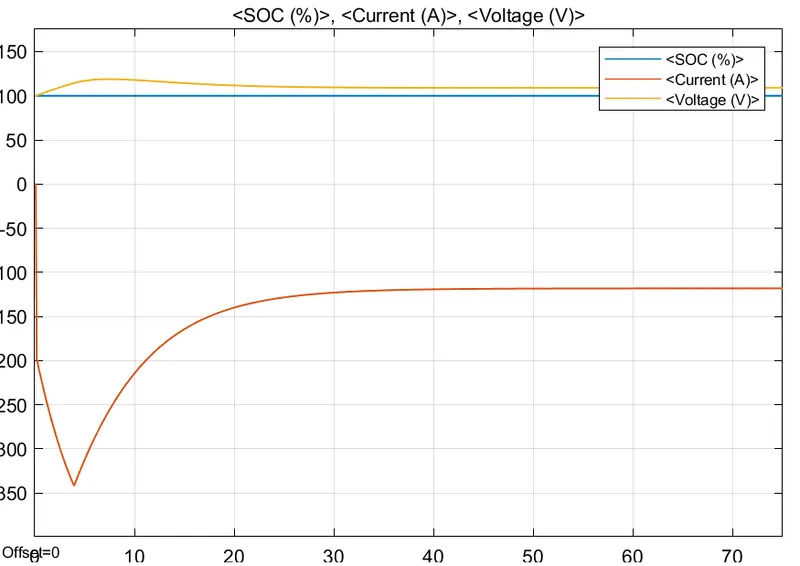
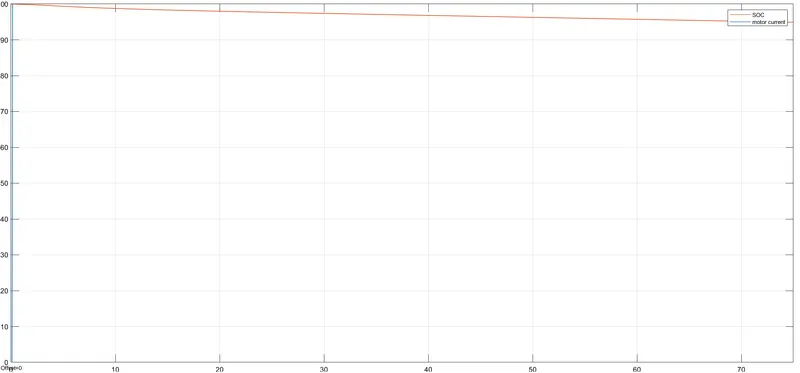
SOC and Motor Current:-
SOC of this driving cycle is 95%.
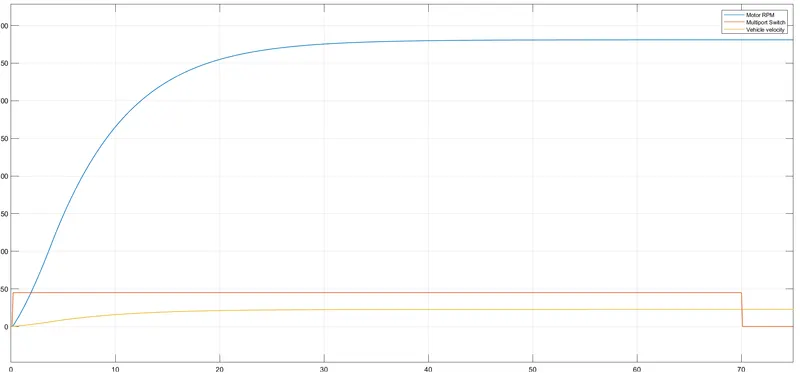
Motor RPM Vs Reference velocity Vs Vehicle velocity:-
Motor temp and Converter Temp:-
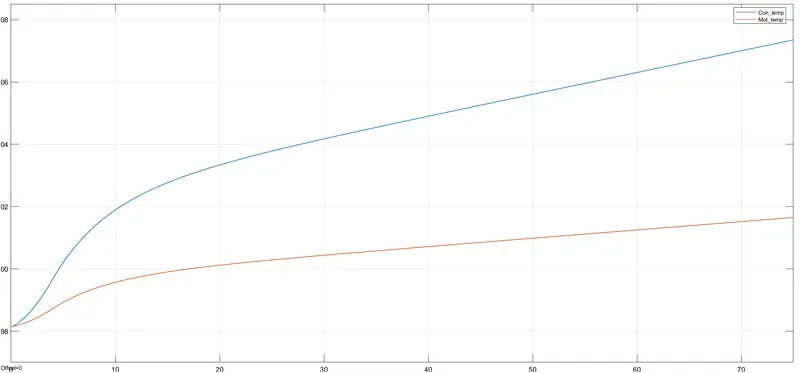
As per this driving cycle converter temp is 298-307K and motor temp is 298-301K.
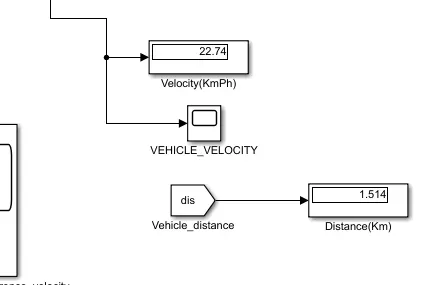
Distance covered by 1.514Km and velocity is 22.74KmPh.
Case 3:- At last we will take WOT cycle to maintain the speed of 45Kmph for 100Km to see the behaviour of parameter by tuned PID.
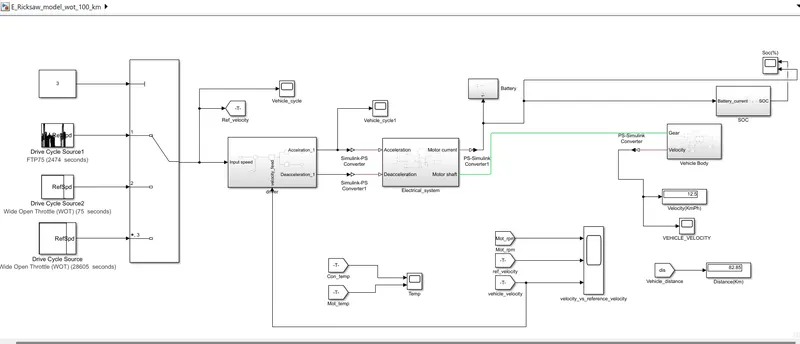
Reference Velocity:-
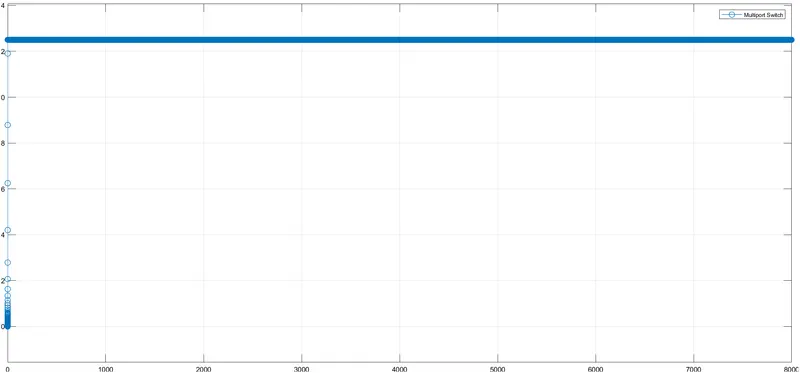
Battery SOC, Current and Voltage:-
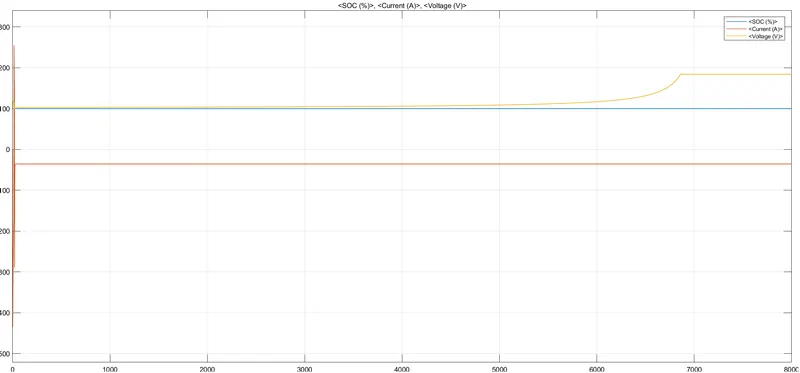
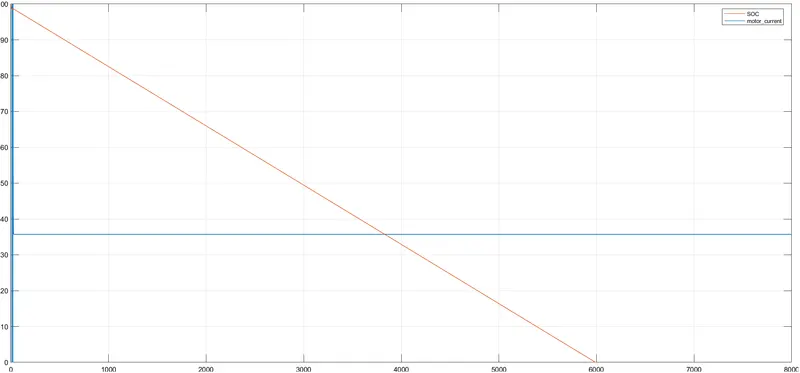
SOC and Motor current:-
As per the graph we can see that our SOC becomes zero its means battery is totally drained out. So as per the objective we required high rating of battery capacity to run this model 100Km at 45KmPh.
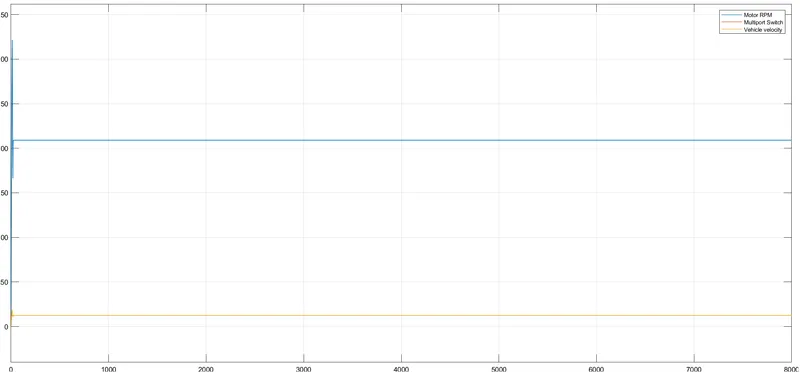
Motor RPM Vs Reference Velocity Vs Vehicle velocity:-
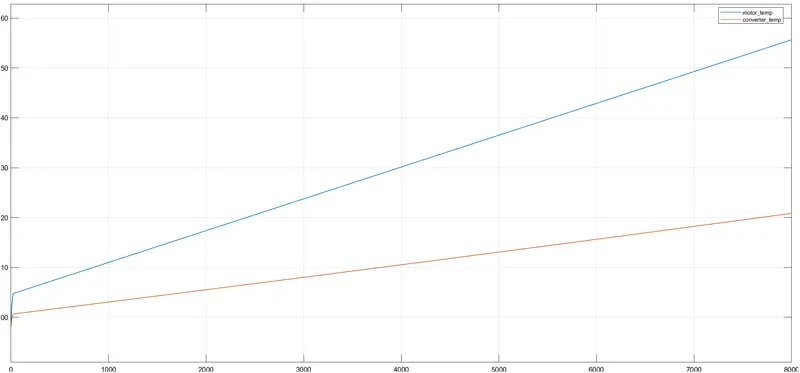
Motor temp and Converter temp:-
Our nominal temp is 298K so motor temp increases to 355K and converter temp goes upt 322K.
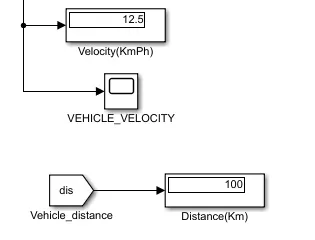
And as per this display our velocity is 12.5m/sec with distance cover 100Km.

| Parameter | Case 1 (2474 secs) | case 2 (75 secs) | Case 3 (8000 secs) |
| SOC(%) | 75% | 95% | 0 |
| Motor temp(Min-Max)(K) | 298-315 | 298-301 | 298-355 |
| Converter temp(Min-Max)(K) | 298-342 | 298-307 | 298-322 |
| Velocity(at end of cycle)(KmPh) | 11.9 | 22.74 | 45 |
| Distance(Km) | 17.69 | 1.514 | 99.79 |
Conclusion:- As per the objective we have tested the three nos drive cycle to check the behaviour of the blocks and component at each level. and we have setermined that for accelerationa and deacceleration we save some power for the further use but if we need continuous power from the system then we have to increase the battery capacity for the same.
As you can see in the third case where we have to maintain the speed of 45Kmph for 100Km then our SOC becomes zero at the end of the cycle. This is because we had constant power consumption. There is nothing like deacceleration mode where our regenrative mode can devlop power to the battery.