Data Handling and Interpolation using Matlab.
% Project: challenge 4 Matlab Basics
% In a laboratory experiment, data of voltage and current has been recorded and the
% same is attached in an excel file ( Click on this link VI.xlsx ). Read the excel
% file in the Matlab program and perform the interpolation in the range of -17.3:0.1:0.9.
% Generate the interactive plot for the interpolated data and store them in a text
% file.
%
% Key Highlights:
%
% Graphical solutions are more visual and appealing
% Interpolation of data
% Read excel file
% Write to text file
%
% Deliverables:
%
% Find missing data and save it in text
% Interpolate the data set
% Save your program and attach the same.
% Save txt file and upload in attachment
%--------------------Implementation details---------------------
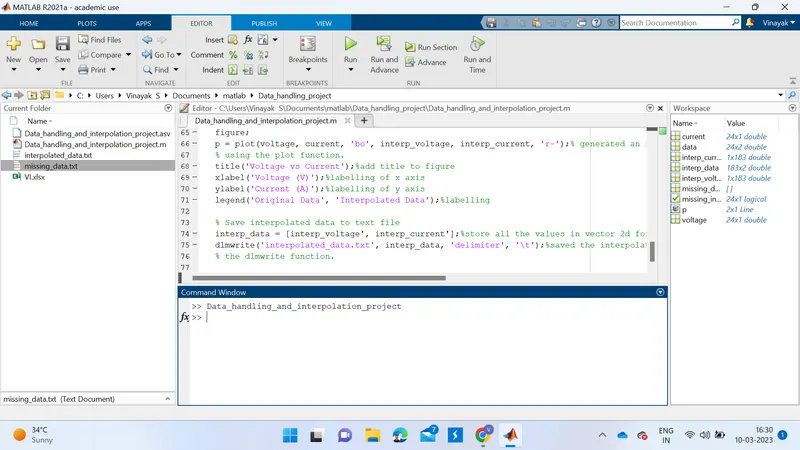
% In this code, I first read the data from the Excel file 'VI.xlsx' using the xlsread
% function. Then I extracted the voltage and current data from the data matrix.
%
% Next, I found any missing data (i.e., NaN values) and save them to a text file
% 'missing_data.txt' using the isnan function and dlmwrite function.
%
% I then interpolated the data using the interp1 function with a range of -17.3:0.1:0.9
% volts. Then I interpolated voltage and current data are stored in the interp_voltage
% and interp_current variables.
%
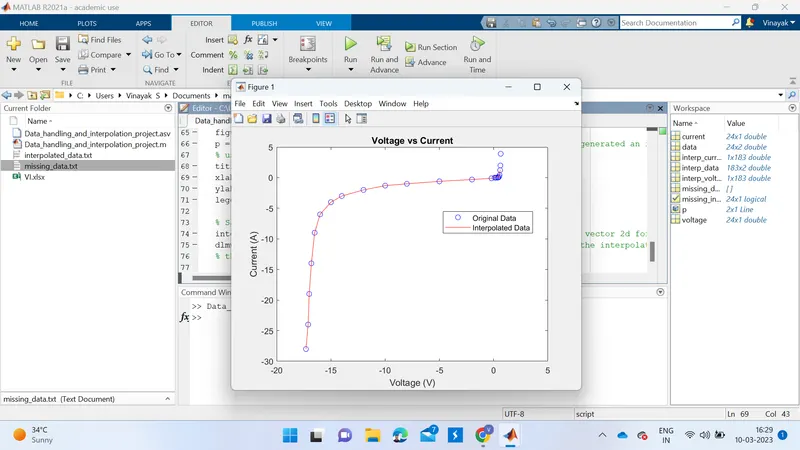
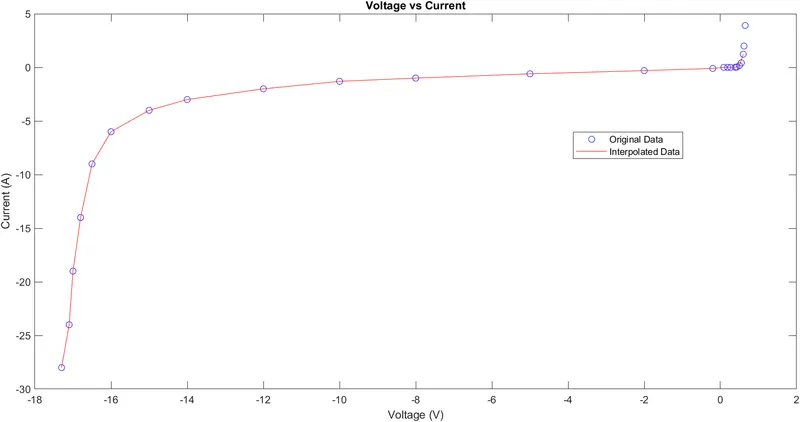
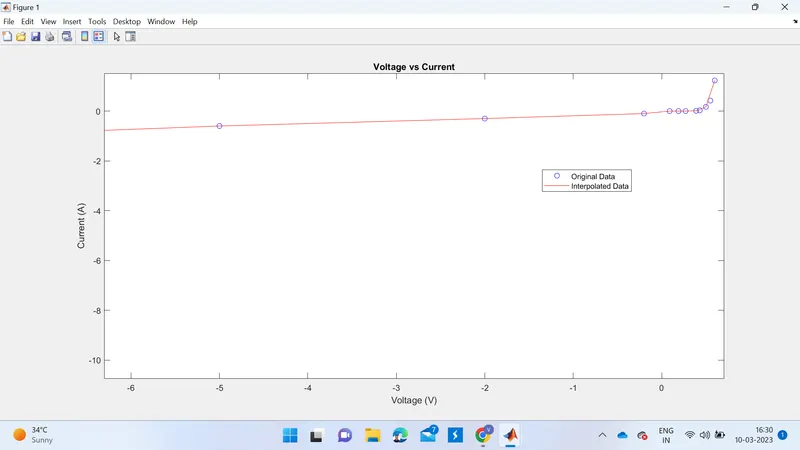
% I then generated an interactive plot of the original data and the interpolated data
% using the plot function. I also added a title and axis labels to the plot, and include
% a legend to differentiate the original and interpolated data.
%
% Finally, I saved the interpolated data to a text file 'interpolated_data.txt' using
% the dlmwrite function.
%----------------Program------------------
% Read Excel file
data = xlsread('VI.xlsx'); %read the data from the Excel file 'VI.xlsx' using the xlsread
% function
% Extract voltage and current data
voltage = data(:,1);%extracted the voltage data from the data matrix.
current = data(:,2);%extracted the current data from the data matrix.
% Find missing data and save to text file
missing_indices = isnan(voltage) | isnan(current);%found any missing data (i.e., NaN values)
missing_data = [voltage(missing_indices), current(missing_indices)];%save them to a text file
% 'missing_data.txt' using the isnan function and dlmwrite function
dlmwrite('missing_data.txt', missing_data, 'delimiter', 't');% saving of text file
% Interpolate data
interp_voltage = -17.3:0.1:0.9;%interpolated the data using the interp1 function with a range of -17.3:0.1:0.9
% volts
interp_current = interp1(voltage, current, interp_voltage);%interpolated voltage and current data are stored in the interp_voltage
% and interp_current variables.
% Generate interactive plot
figure;
p = plot(voltage, current, 'bo', interp_voltage, interp_current, 'r-');% generated an interactive plot of the original data and the interpolated data
% using the plot function.
title('Voltage vs Current');%add title to figure
xlabel('Voltage (V)');%labelling of x axis
ylabel('Current (A)');%labelling of y axis
legend('Original Data', 'Interpolated Data');%labelling
% Save interpolated data to text file
interp_data = [interp_voltage', interp_current'];%store all the values in vector 2d form in interp_data
dlmwrite('interpolated_data.txt', interp_data, 'delimiter', 't');%saved the interpolated data to a text file 'interpolated_data.txt' using
% the dlmwrite function.