Final Project: Electric Rickshaw modelling
FINAL PROJECT:
DESIGN OF AN ELECTRIC RICKSHAW MODEL:
SIMULINK MODEL:
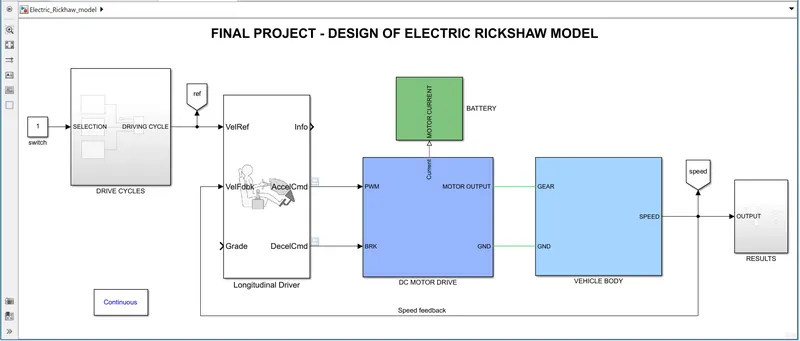
- The model of an electric rickshaw
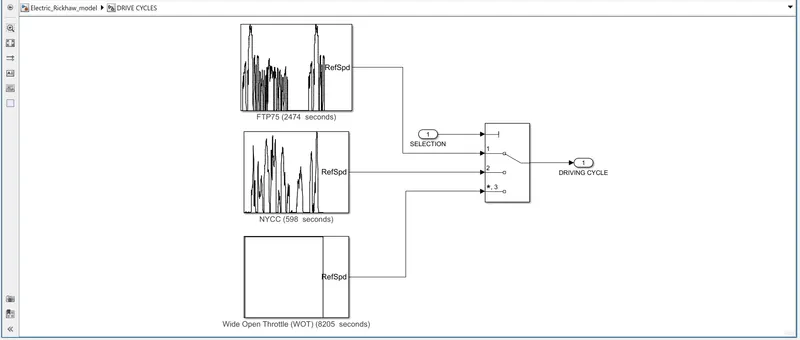
- The drive cycle subsystem
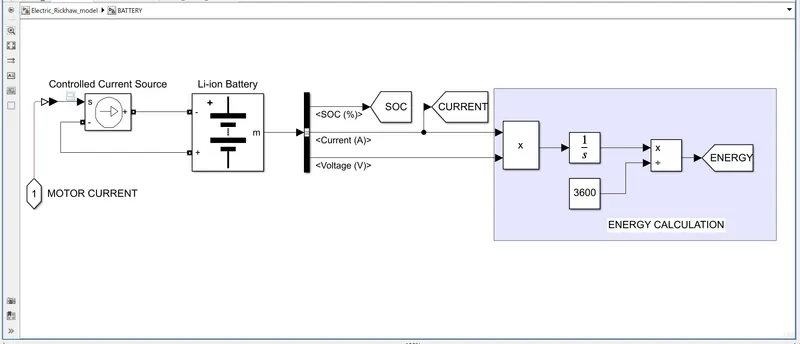
- The lithium-ion battery subsystem
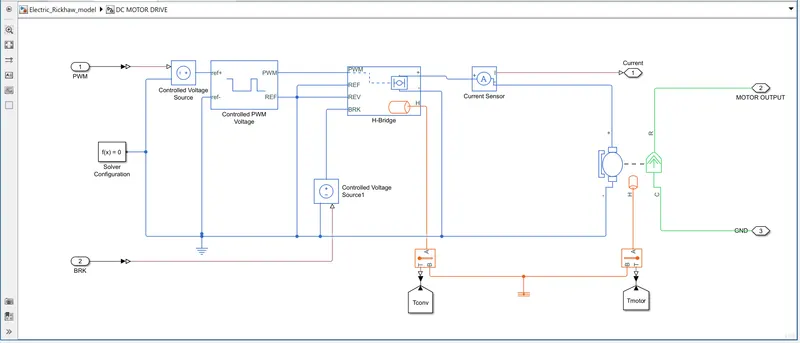
- The motor drive subsystem
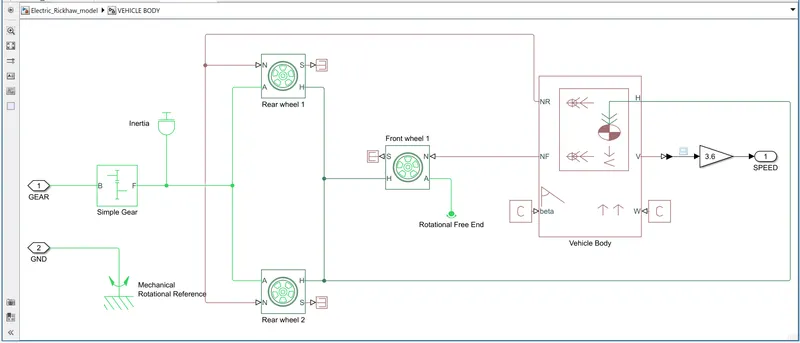
- The vehicle body subsystem
REPORT:
- Three different type of drive cycle used to analyse the electric rickshaw model
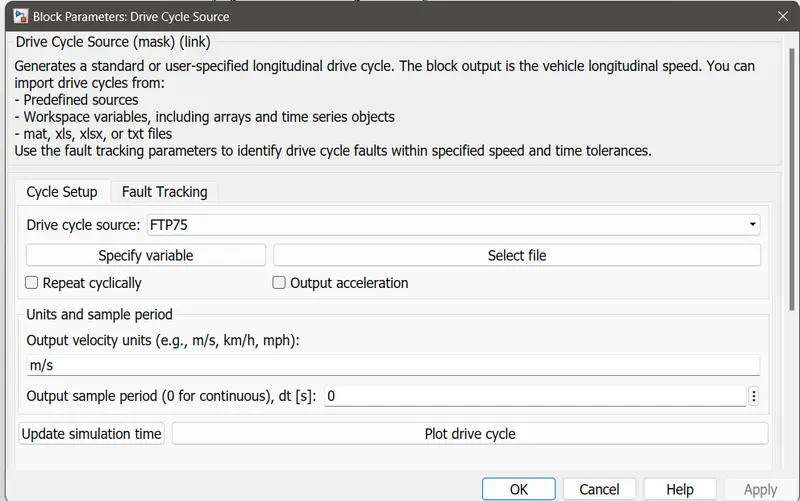
- The FTP75 drive cycle parameters choosen as follows
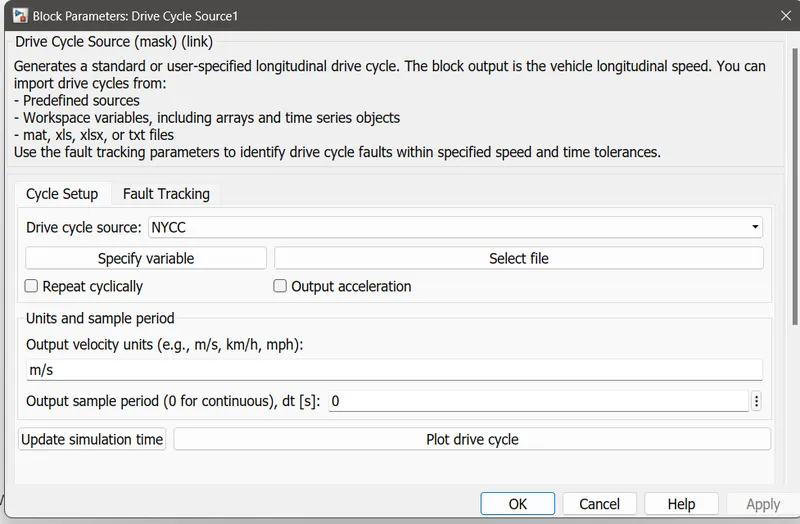
- The NYCC drive cycle parameters choosen as follows
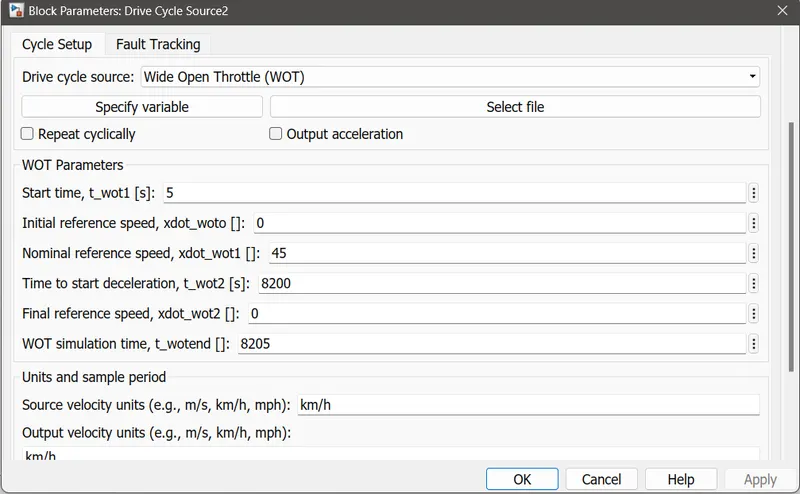
- The WOT drive cycle parameters choosen as follows
- Three drive cycle connected to a multiport switch and output connected to reference speed input of driver block
- Switching between drive cycles can be obtained by selecting selection switch accordingly
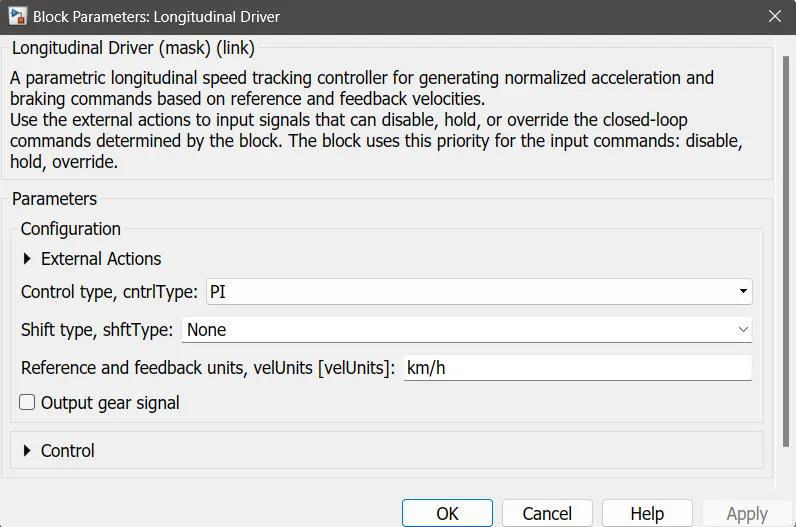
- The longitudinal driver block parameters choosen as follows
- The final speed output of the model is feeded back to the longitudinaldriver block
- The output of driver block is acceleration command and decceleration command
- The acceleration command given to the PWM generator through controllled voltage source
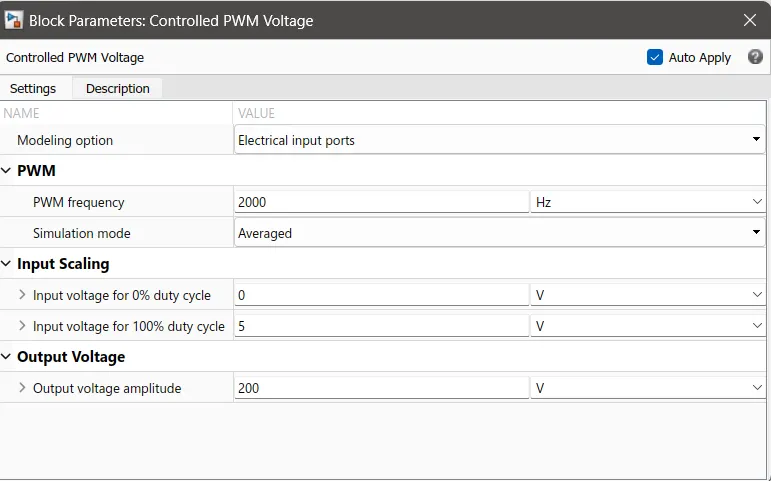
- The PWM voltage block parameters choosen as follows
- The decceleration command of driver block given to break port of H-bridge converter
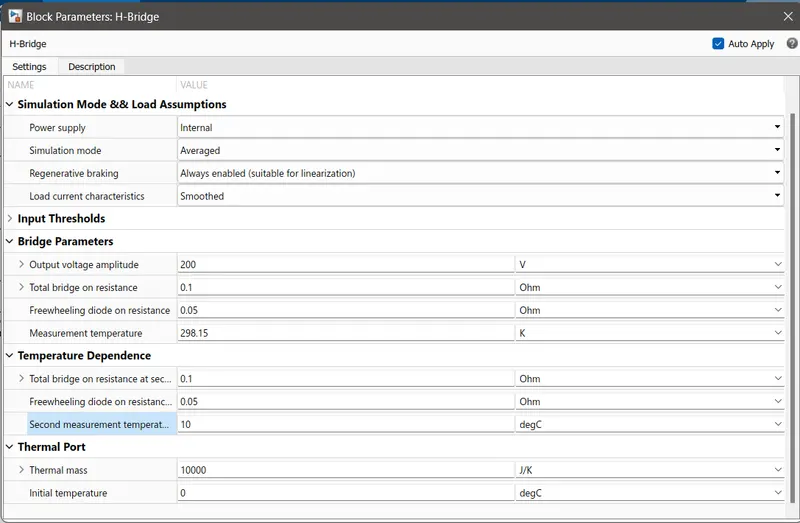
- The H-bridge converter parameters choosen as follows
- A temperature sensor connected inorder to read the temperature inside the converter
- The output of the converter is connected to the PM DC motor through a current sensor
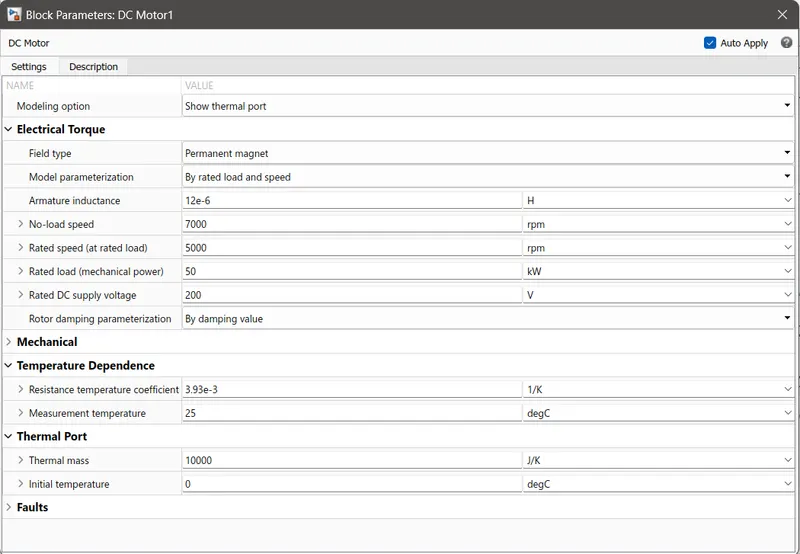
- The PM brushed DC motor parameters choosen as follows
- A temperature sensor connected to read the temperature of motor while operation
- The mechanical output of motor given tothe gear system
- The current sensor output given to battery through a current controlled source
- The battery used in the model is li-ion type ,and its parameters are
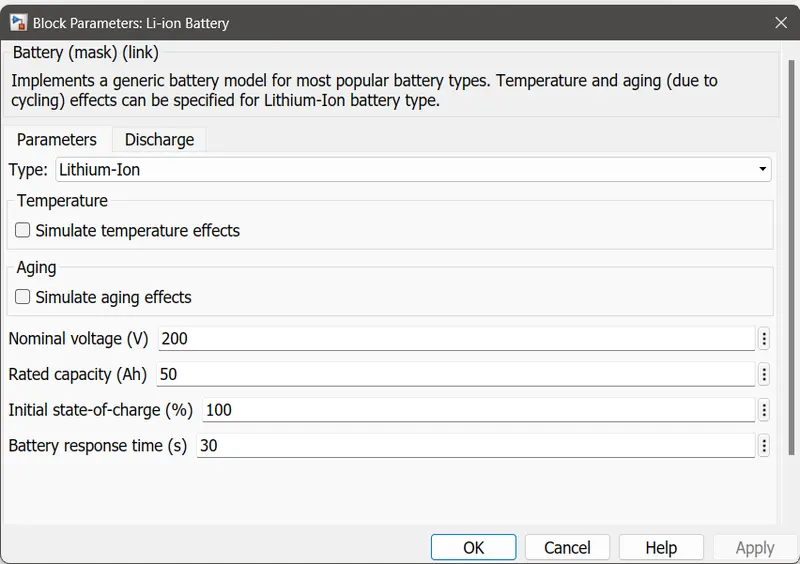
- The battery SOC,current and energy conumption obtained and plotted in scope
- The mechanical output from the motor connected to simple gear block
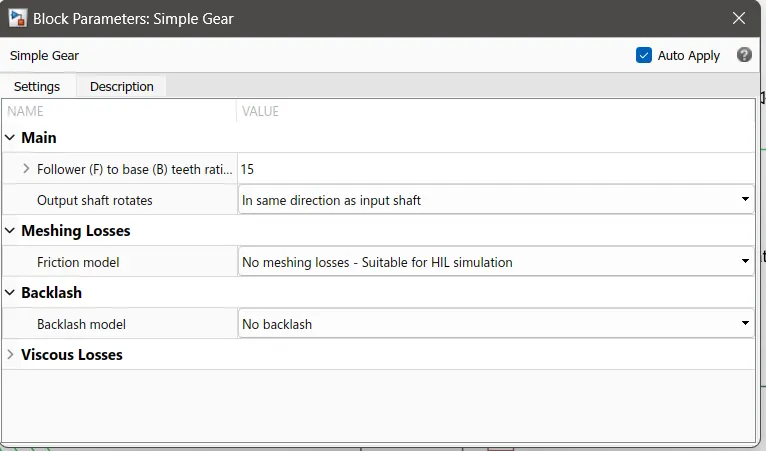
- The gear output given tothe rear wheel axle of the rickshaw
- A three wheel configuration choosed to represent a rickhaw
- The wheel block parameters choosen as
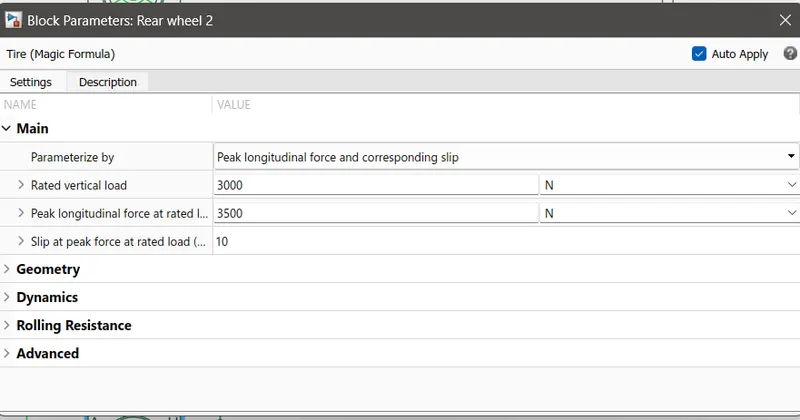
- The force to wheels provided by the vehicle body block and hub port connnected to hub port of all three wheels
- The vehicle body parameters choosen as follows
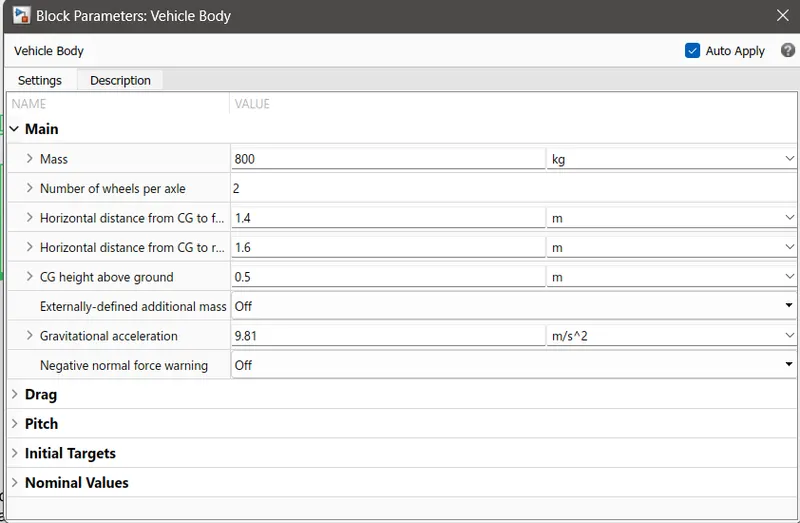
- The output of vehicle bodyis velocity which converted to km/h and feeded back to driver block
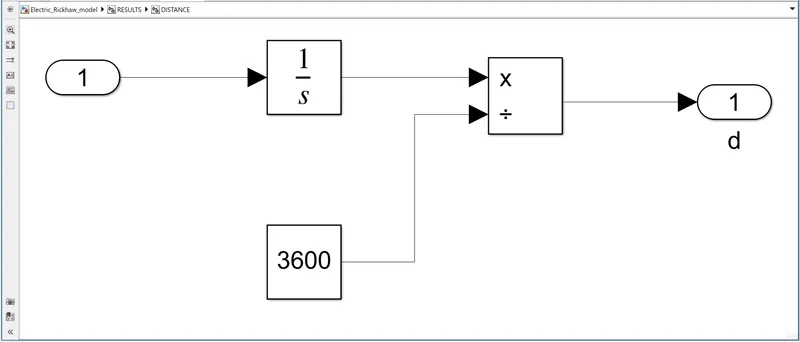
- The distance travelled by the vehicle is calculated as
- All outputs and results displayed and plotted using scope block
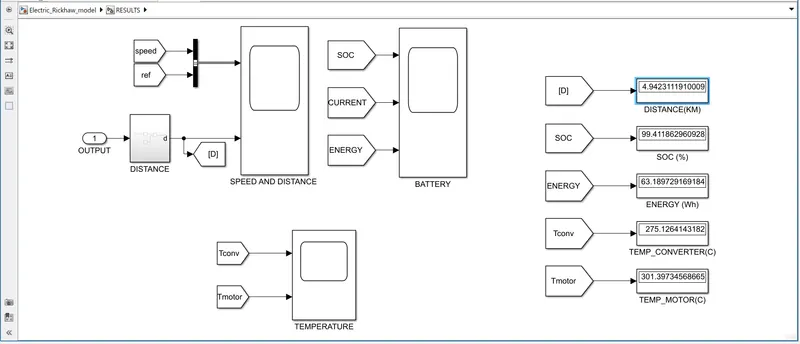
- The model simulated for three drive cycles and the results plotted
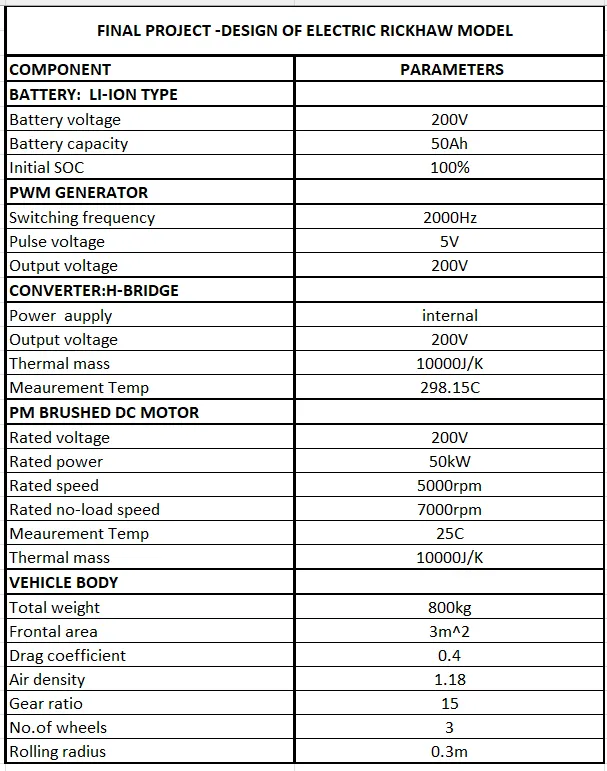
- Assumed parameters in the model is shown below
RESULTS:
- The vehicle performance in three different driving cycles isshown below
- DRIVE CYCLE FTP75:
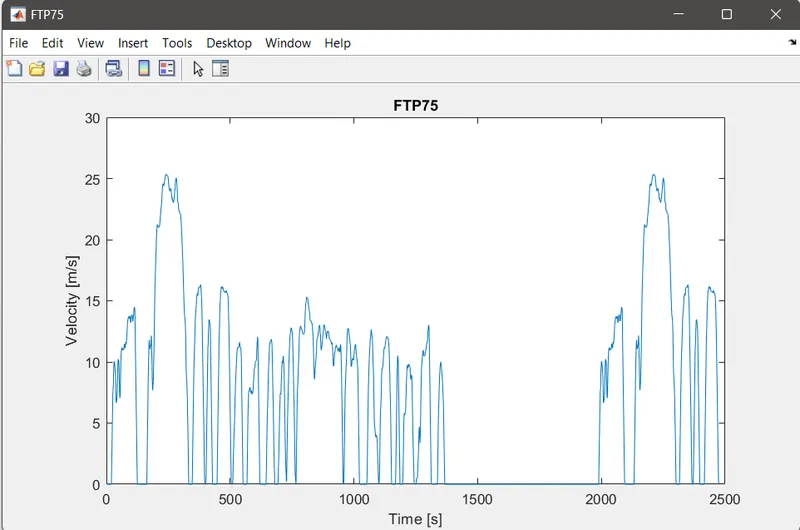
- The FTP75 drive cycle is shown below
- The vehicle speed performance is shown below
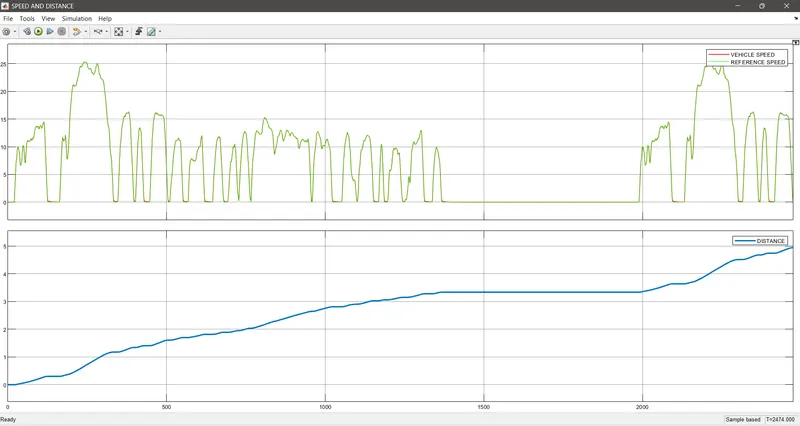
- Graph 1:The speed of the vehicle with respect to the reference speed ,its observed that vehicle tracking the reference speed well
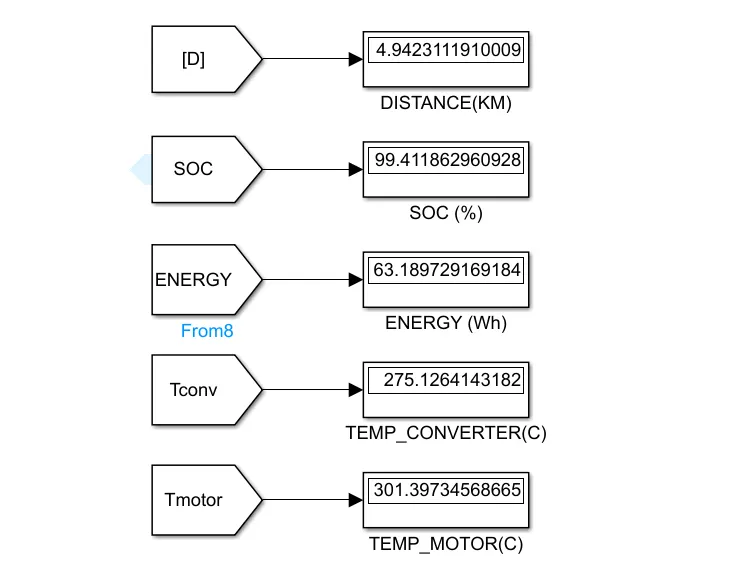
- Graph 2:The distance travelled by the vehicle for given drive cycle,It oberved the distance is around 5km
- The battery performance ishown below
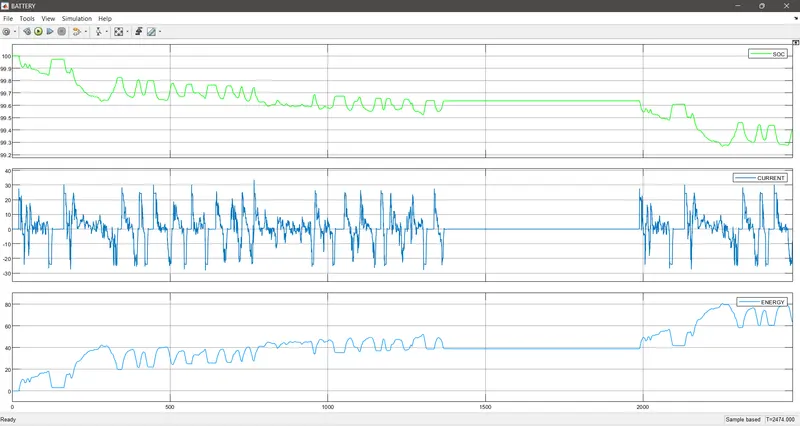
- Graph 1:The SOC of battery.Its observed that 99% of charge remains in the battery after the executing thedrive cycle
- Graph 2:The motor current ,The polarity of current changes according to acceleration and decceleration command
- Graph 3:The energy consumption,its observed that forthe given drive cycle 63Wh energy consumed
- The temperature rise in the ystem is shown below
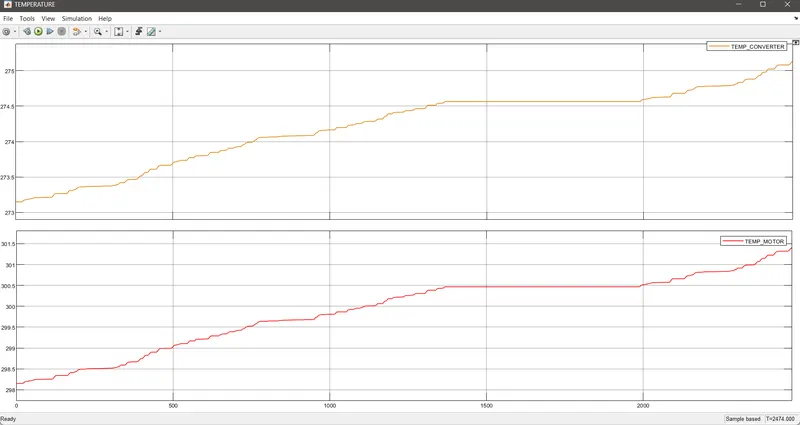
- Graph 1:The temperature in converter ,its observed that the temperature steadily increasing upto 275C
- Graph 2:The temperature in motor,its observed that temperature steadily increasing upto 301C
- Summary of the vehicle performance with repect to this drive cycle is shown below
- DRIVE CYCLE NYCC:
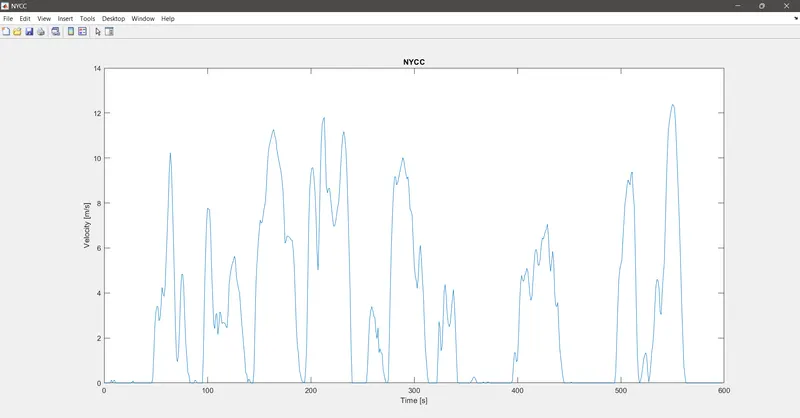
- The NYCC drive cycle is shown below
- The vehicle speed performance is shown below
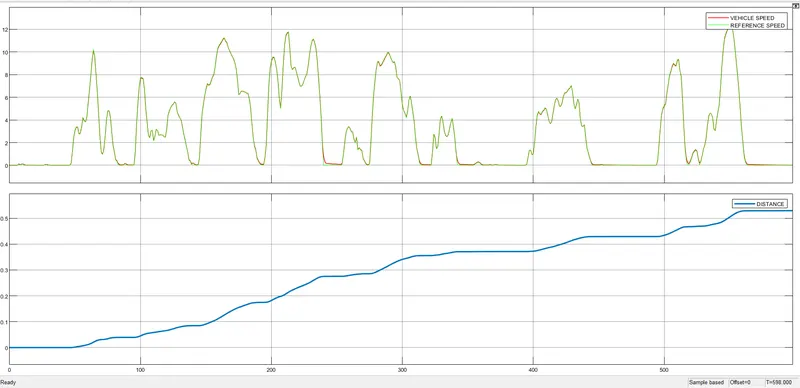
- Graph 1:The speed of the vehicle with respect to the reference speed ,its observed that vehicle tracking the reference speed well
- Graph 2:The distance travelled by the vehicle for given drive cycle,It oberved the distance is around 0.5km
- The battery performance is shown below
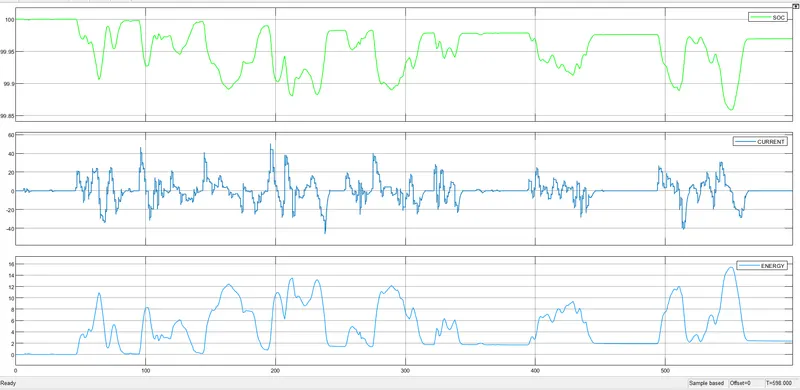
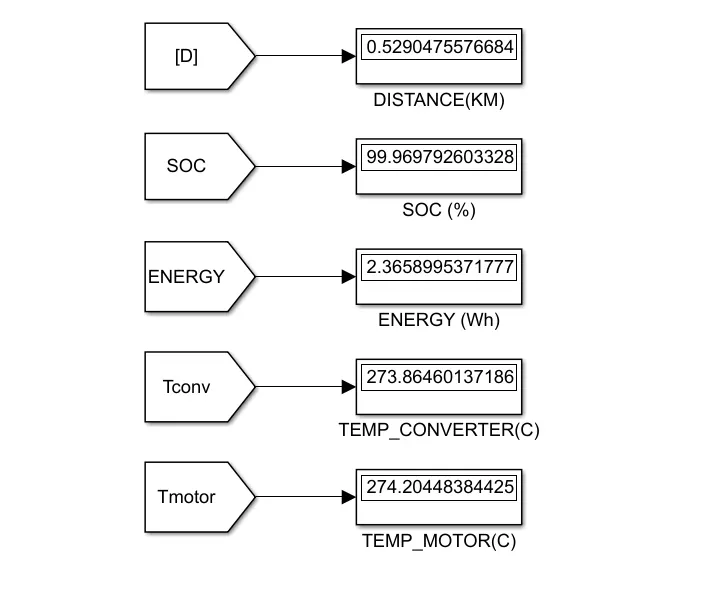
- Graph 1:The SOC of battery.Its observed that 99% of charge remains in the battery after the executing the drive cycle
- The regerative braking makes the battery charging ,when the vehicle decceleraitng
- Graph 2:The motor current ,The polarity of current changes according to acceleration and decceleration command
- Graph 3:The energy consumption,its observed that forthe given drive cycle 2.3Wh energy consumed
- The temperature rise in thesystem is shown below
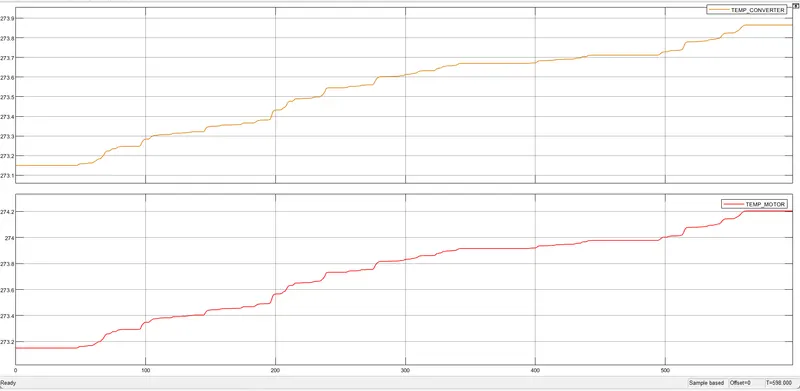
- Graph 1:The temperature in converter ,its observed that the temperature steadily increasing upto 273C
- Graph 2:The temperature in motor,its observed that temperature steadily increasing upto 274C
- Summary of the vehicle performance with repect to this drive cycle is shown below
- DRIVE CYCLE WOT (45KMPH-100KM):
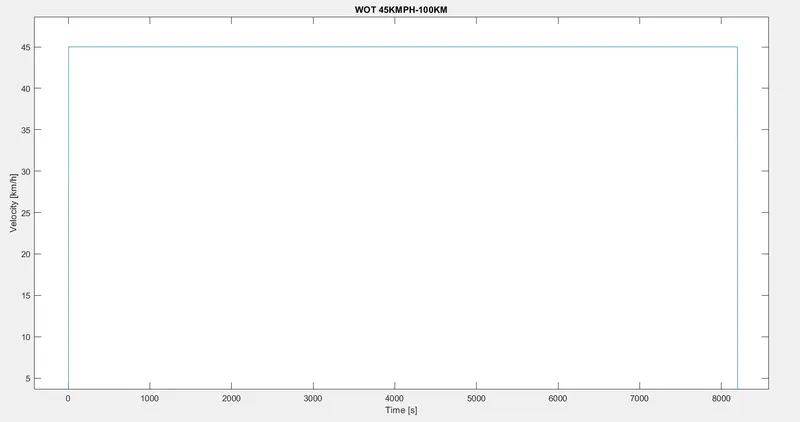
- The WOT drive cycle is shown below
- The vehicle speed performance is shown below
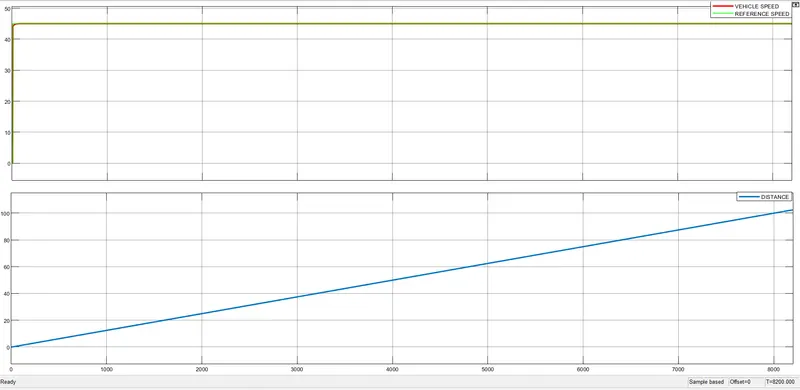
- Graph 1:The speed of the vehicle with respect to the reference speed ,its observed that vehicle tracking the reference speed well
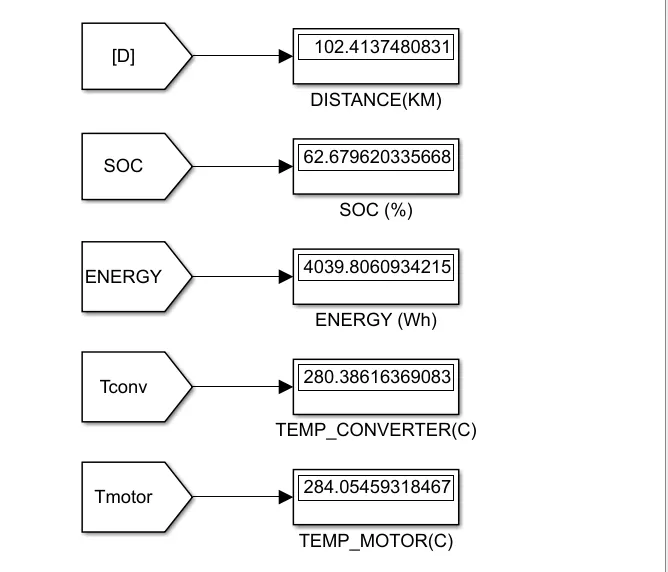
- The vehicle moving with 45kmph speed for 100km
- Graph 2:The distance travelled by the vehicle for given drive cycle,It oberved the distance is around 100km
- The battery performance is shown below
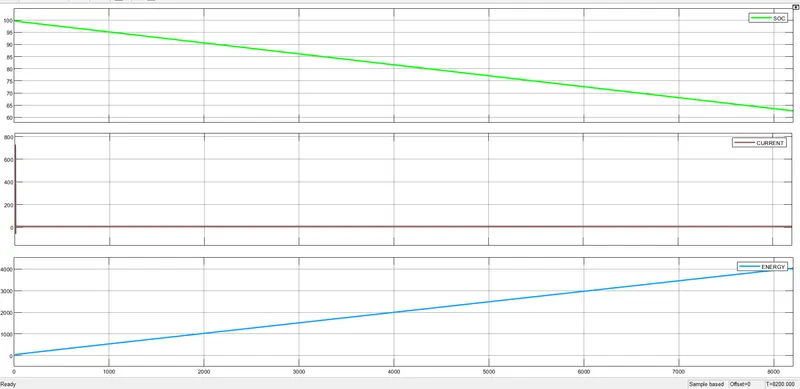
- Graph 1:The SOC of battery.Its observed that 62% of charge remains in the battery after the executing the drive cycle
- For a constant accelerating ,we can observe there is no regenerative acton in the battery
- Graph 2:The motor current ,The current almost constant for the constant speed of 45kmph
- Graph 3:The energy consumption,its observed that forthe given drive cycle 4040Wh energy consumed
- The temperature rise in the motor drive system is shopwn below
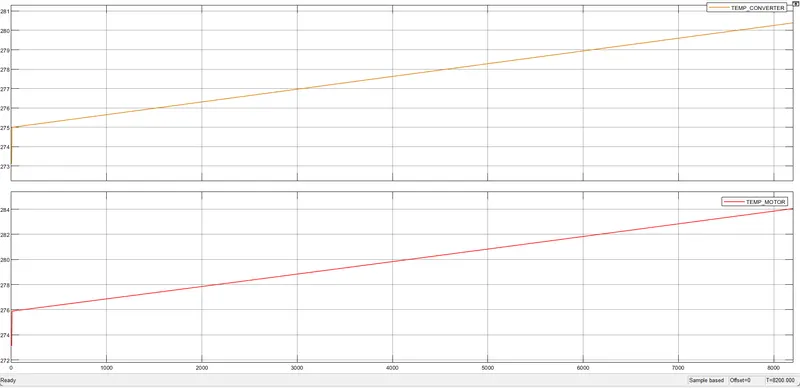
- Graph 1:The temperature in converter ,its observed that the temperature steadily increasing upto 280C
- Graph 2:The temperature in motor,its observed that temperature steadily increasing upto 284C
- The summary ofvehicle performance is shown below
CONCLUSION:
- Simulink model of an electric rickshaw is designed
- The model simlated for three different drive cycles and results were plotted
- The energy consumption ,temperature ofconverter and motor obtained for three driving cycles
- Its concluded that the model working and tracking all three driving cycles