Electric Rickshaw modelling- SIMULINK
PROJECT:-Create a Detailed MATLAB model of an electric rickshaw (three wheel passenger vehicle)
Aim) The main aimis to Design of Electric Rickshaw by using the MATLAB and SIMULINK Tools.
ABSTRACT: -
In this project, we work to create the MATLAB model of the "Electric Rickshaw" by using a "PM brushed type DC motor" and a suitable Lithium-Ion battery for this motor.
Firstly we will remember what is Electric Rickshaw , how it's functioning of Electric Rickshaw.
My main Aim is to examine "how my Electric Rickshaw performs for any three standard driving cycles showing energy consumption, the temperature rise of motor and controller for vehicle cover around 100 km at constant speed driving 45 kmph.
Objectives:-
- Rear wheels driven by PM brushed type motor.
- Assume efficiency points of motor controller and motor.
- Make an excel sheet of all input and assumed data.
- Results: For any three standard driving cycles show energy consumption, temperature rise of motor and controller for 100 km constant speed driving at 45 kmph.
Key points:-
The main key points to remember while desigining an Electric Vehicle / Ricksha are as followes
- Identify the How much amount of propulsion power is required.
- Which type of suitable motor for Required propulsion power. and finally
- which type of battery and How much capacity battery is Required for reaches to requirements of range.
Electric Rickshaw:-
Electric E-Rickshaw is also known as an electric tuk-tuk, E-rickshaw and auto which are going more popular after 2017 in the Indian market.
This E-rickshaw is the best alternative to petrol/CNG auto-rickshaw and human or horse-pulled rickshaws because of their low fuel cost, zero emissions and less human efforts.
The electrical frive system used in the Indian version is 48VDC can run 90-100 km/full charge, top speed 25 km/hour and this electric motor power ranging from 650-1400 Watts: the battery takes 8-10 hrs to become fully charged. Basic seating capacity is driver plus 4 passengers total of 5 persons
To operate an e rickshaw, the driver simply presses down on the accelerator pedal. The e-rickshaw will then begin to move forward. Braking is done by releasing the accelerator pedal and applying pressure to the handbrake.
Parts of an Electric Rickshaw:-
The Ev-Rickshaw contains maily the following parts:-
1)Vehicle Body
2)Electric Motor
3)Inverter
4)Drive train
5)Battery system
6)Charging
` 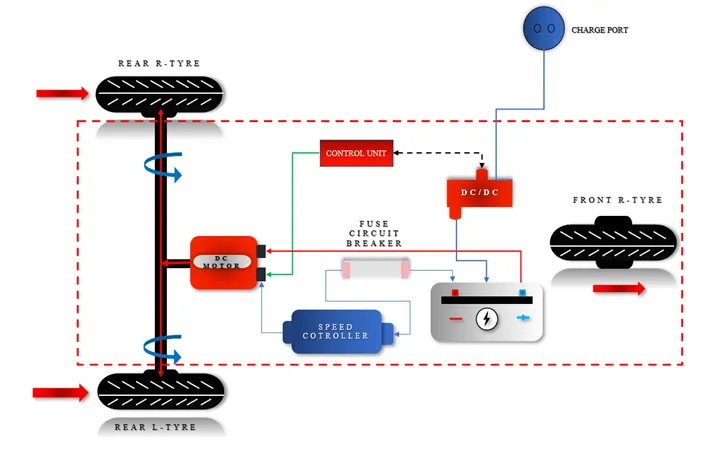
Fig--> Basic parts of EV-Rickshaw
1)Vehicle body:-
The bodyweight of the E- rickshaw is extremely light and the lithium-ion batteries have a good tenure.
2)Electric Motor :-
The electric system mainly designed in the indian is 48v Dc which can run 90-100km/full charge .
3)Inverter:-
Converts the electric current in the form of Direct Current (DC) into Alternating Current (AC)
4)Drivetrain :-
EVs have a single-speed transmission which sends power from the motor to the wheels.
5)Battery system :-
The Range of the battery generally varies from 650w to 1250 and the power supply is around 48V..
6)Charging :-
Plug into an outlet or EV charging point to charge your battery.
Schematic Diagram :-
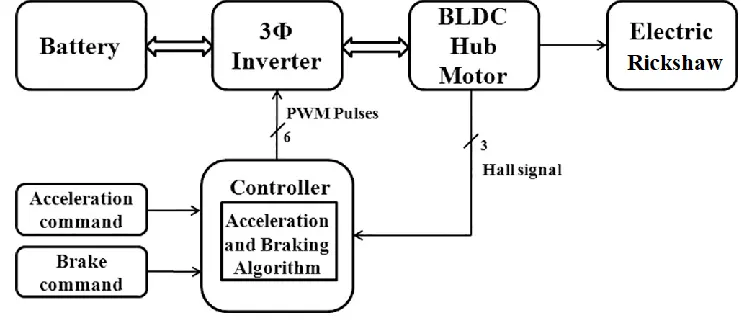
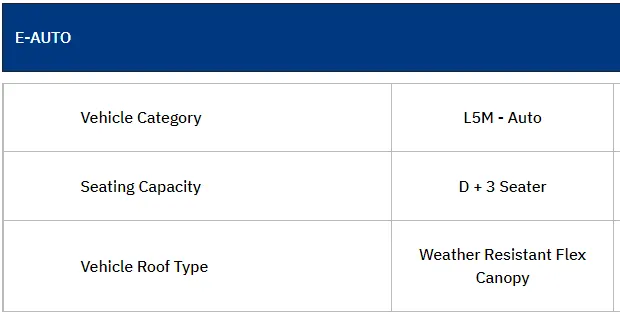
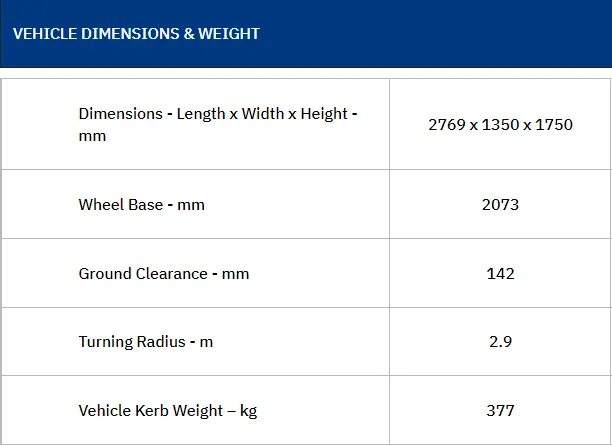
Fig--> Basic View Image of E -Rickshaw(MAHINDRA TREO)
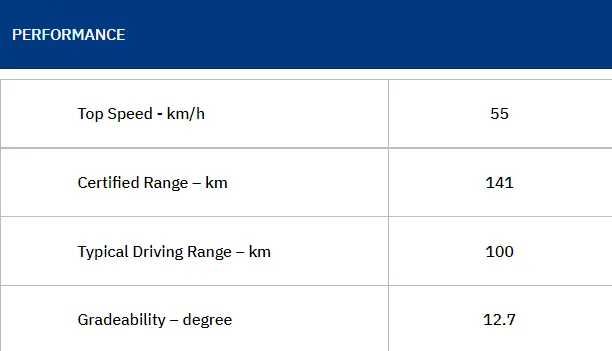
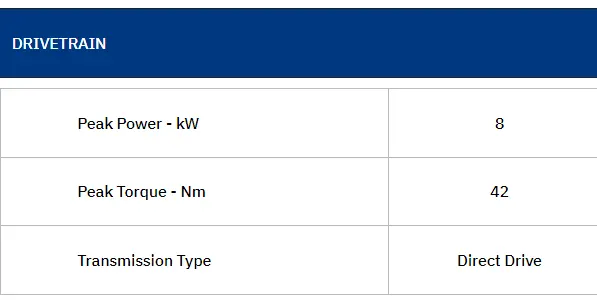
Power requirement Calculation:-
Load power requirement is calculated based on the drive cycle and vehicle dynamics. Battery source sizing is depend based on this power requirement.
Drive Cycle:-
The Drive Cycle Source block generates a standard or user-specified longitudinal drive cycle. The block output is the specified vehicle longitudinal speed. The load power requirement was calculated for the driving cycle. Battery was sized based on this power requirements.
Modelling of vehicle dynamics is explained in detail As followes.
Vehicle dynamics:-
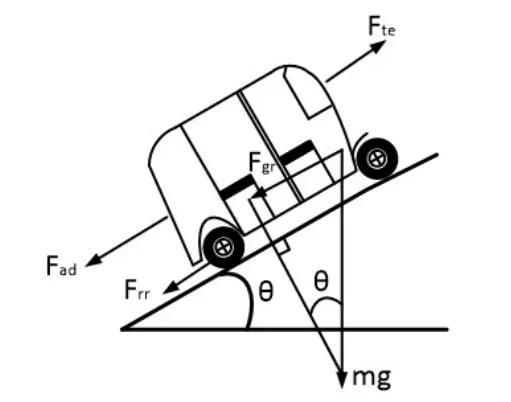
The forces acting on a vehicle needs to be understood for an effective modelling of vehicle dynamics. The forces acting on an auto-rickshaw while hill climbing is shown in Figure.
The tractive force generated by the electric motor of the vehicle has to experience and overcome followeing forces:-
(a) Rolling resistance force
(b) Aerodynamic drag force
(c) Grade resistance force and
(d) Acceleration force
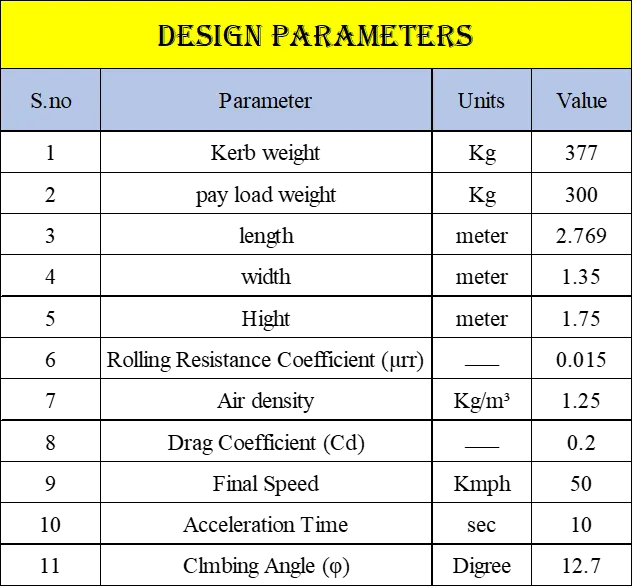
These forces are calulated by using following table:-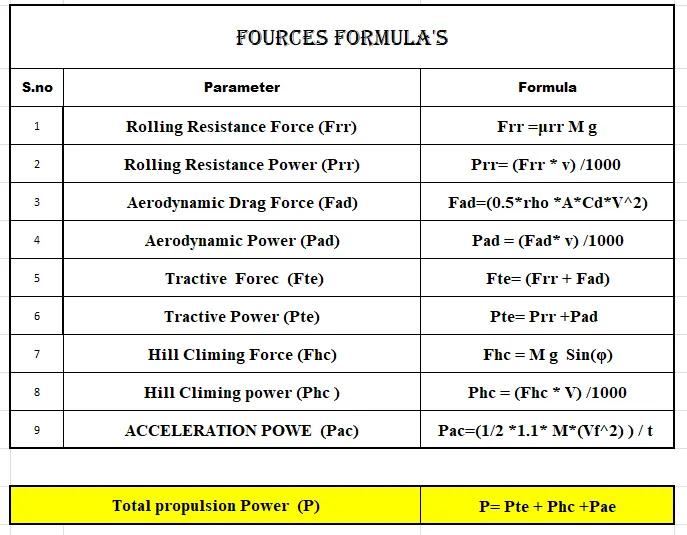
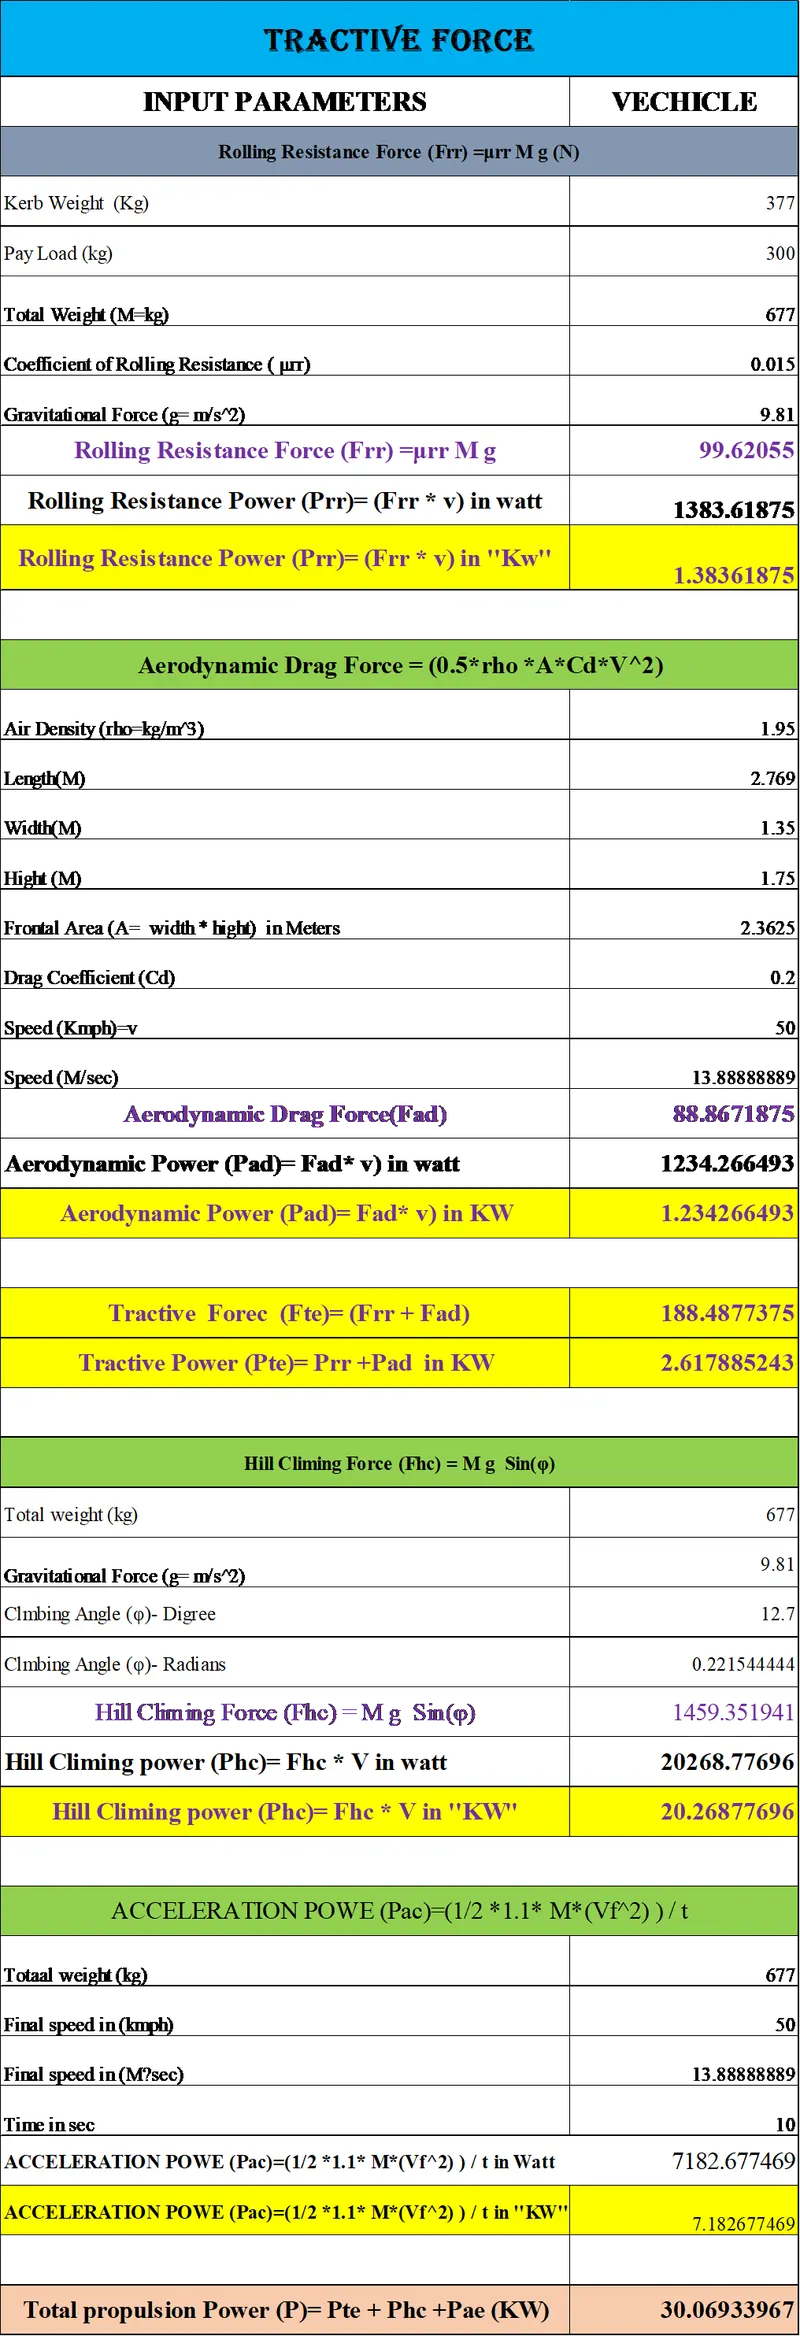
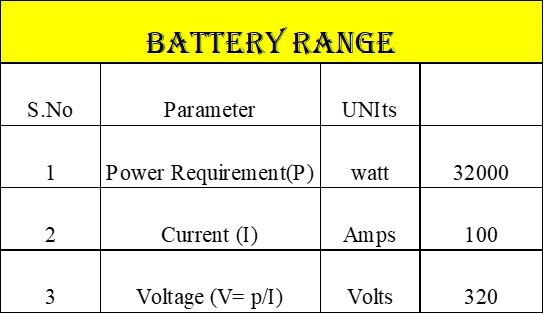
For creating the Simulink model of an electric Rickshaw we are using the following blocks:-
- Vehicle body
- Tire
- Simple gear
- Dc motor
- H-bridge
- drive cycle
- Logitudinal driver
- bus selector
- Multy port switch
- Controlled PWM voltage
- controlled Voltage Source
- Current sensor
- Battery
- Gain
- Electrical reference
- Constant
- inport
- outport
- scope
- Integrator
- Add
- Display
- Splver Configaration
- Powergui
Total Simulink model:-
Here I was attached the total simulink model of Ev-Rickshaw:-
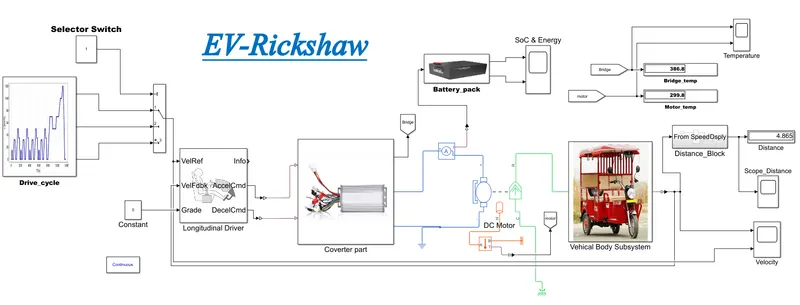
Fig--> Electric-Rickshaw Simulink Model
Procedure for model creating with Each block parameters data explanantion:-
Procedure:-
This Electrica car model is created with following subsystem blocks:-
- Vehicle body subsystem
- Dc-Motor
- Power Coverter unit subsystem
- Driving block
- Reference Drive Cycle
- Battery pack with SOC %
- Energy Consuption
- Output results Plots
1)Vehicle body subsystem:-
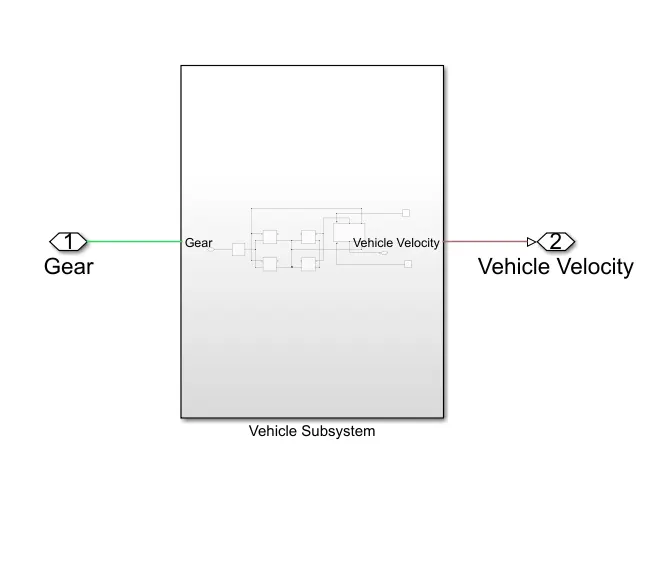
This Subsystem Contains following Blocks :-
For creating the Vehicle body we ar used the following blocks:-
Vehicle body:-
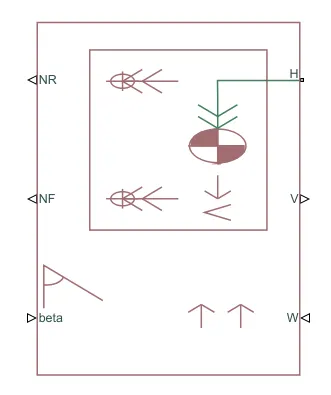
This block contain 6 ports which can be used to model various aspects of the vehicle body. The ports are mentioned below;
H- port :-
This port stands for "Hub" and is used to connect the hub port of the wheels to the main body of the vehicle.
V-port :-
Physical signal output port which stands for 'velocity' and is used the output the velocity of the vehicle.
W- port :-
Physical signal input port and allows us to model a "wind velocity" that acts aginst the vehicle.
NR-port :-
Physical signal output port to connect to connect the rear wheels(NR-Normal Rare)
NF-port :-
Physical signal output port to connect the front wheels of the vehicle.(NF-Normal Front)
Beta- port :-
Physicall signall input port which allows the vehicle to undergo an inclination of hill climbing force.
Vehicle body parameters block:-
If we click on the vehicle body block, the pop-up window appears with default values. We need to change the values depending on the requirement of the model to achieve accurate results.
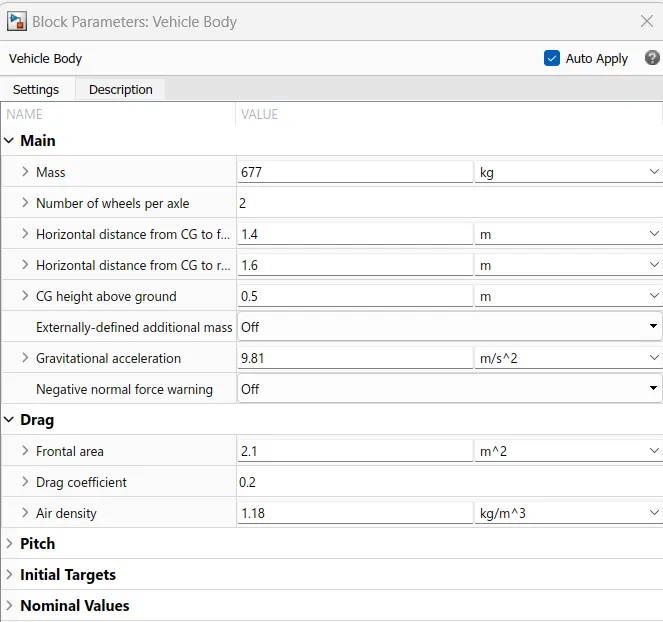
The parameters changed As below :-
Mass -677 kg
Frontal Area- 2.1m²
Drag coefficient-0.2
Tire Block :-
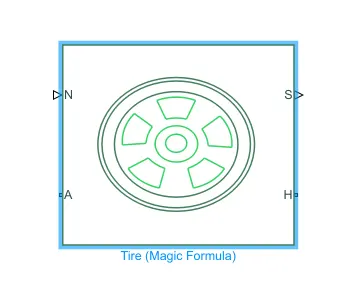
A -Port :-
It is the mechanical rotational conserving port for the wheel axle.
H-Port :-
It is is the mechanical translational conserving port for the wheel hub through which the thrust developed by the tire is applied to the vehicle.
N-port:-
It is a physical signal input port that applies the normal force acting on the tire. The force is considered positive if it acts downwards.
S-Port :-
It is a physical signal output port that reports the tire slip.
Tire -Block parameters :-
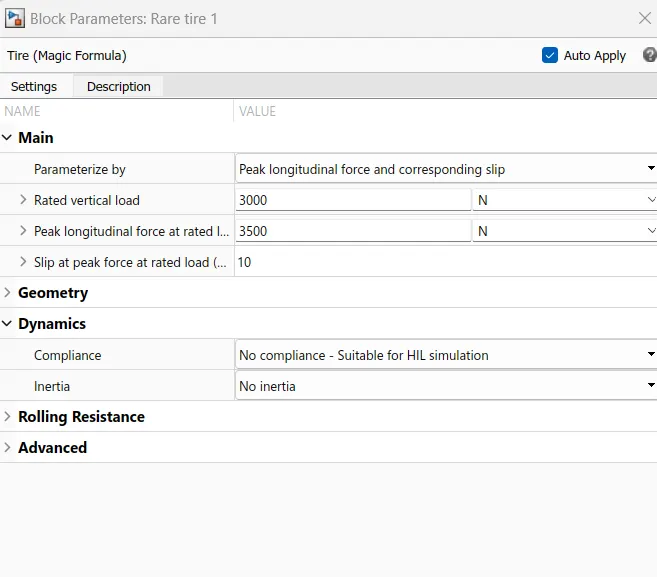
For the tire block, I was use the all default values are considered for this model.
Gear Block :-
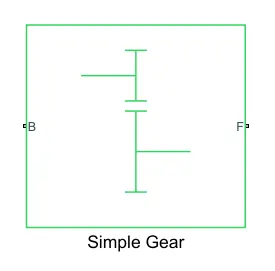
This block represents fixed-ratio gear.
It has two terminals B and F. B represents base and F represents the Follower of the gear and are mechanical rotational conserving ports.
The "F" terminal is connected to the rear axle and the B terminal is connected to the DC motor.
Gear block Parameters:-
This torque is provided to the rear axle of the vehicle to increase the propulsion.
Electrical vehicles transmission is much simpler as the motor provides motion from zero speed upwards.
i.e.by just connecting a simple gear Box.
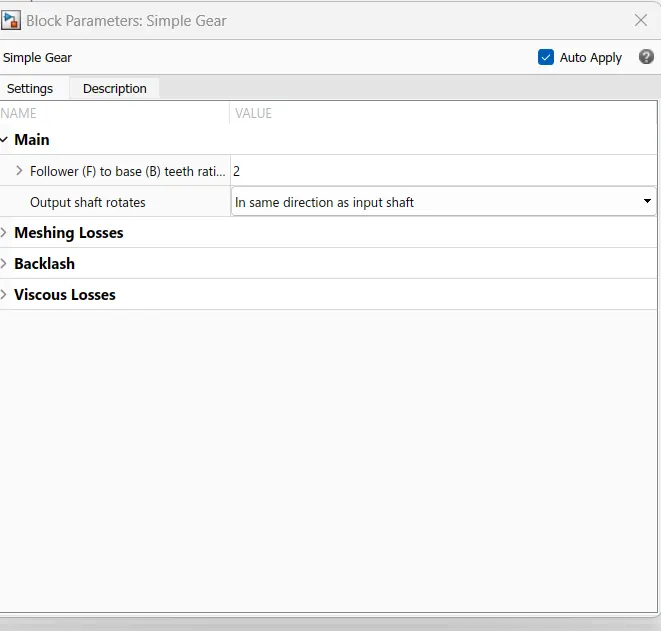
THis Block parameters Gear Ratio is changed to 2 to increase 2 times the torque produced by the motor.
Output shaft Rotation :- In the same direction of input shaft
Vehical body Subsystem Simulink Model :-
Vehicle Bode Constriction Procedure:-
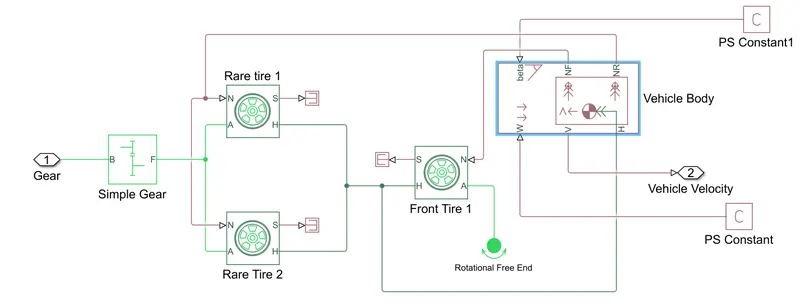
- The above subsystem of vehicle body is created by using the Three tires are connected , In this right two tires are the Rear wheels and the Left one is the Front wheel.
- The right side two tire are interlinked by using the "A(Axle)-Port" with each other.In the same way the left side tire is interlinked the "A(Axle)-Port" with using the "Rotational Free end Block"
- Finally These Three tires are interconnected By usingH-port in each tire with to "vehicle body" block by using the "Hub Port" in vehicle body.
- From the Vehicle body, the both NR and NF are Connected to the "N-Port" Of Rear and Front tires respectively.
- In the Vehicle body reming ports ,wind velocity port and Beeta ports are connected to physical constant blocks which is kept as zero.
- And the "V (Velocity) port is Used as reference feedback to the driver Block.
- In this model we are assuming the "vehicle is Rear wheel driving'' ,that way we are Using the gear system or transmission system connection to the Rear wheel of vehicle.
- Here we are used the "A simple gear" with ratio is 2 For transmission purpose. In this gear "F" ort is connected to the Rear wheel set of axle port(A-port) Of tires.
- From above steps we are created the body of vehicle.
2)Dc-Motor-With Thermal port:-
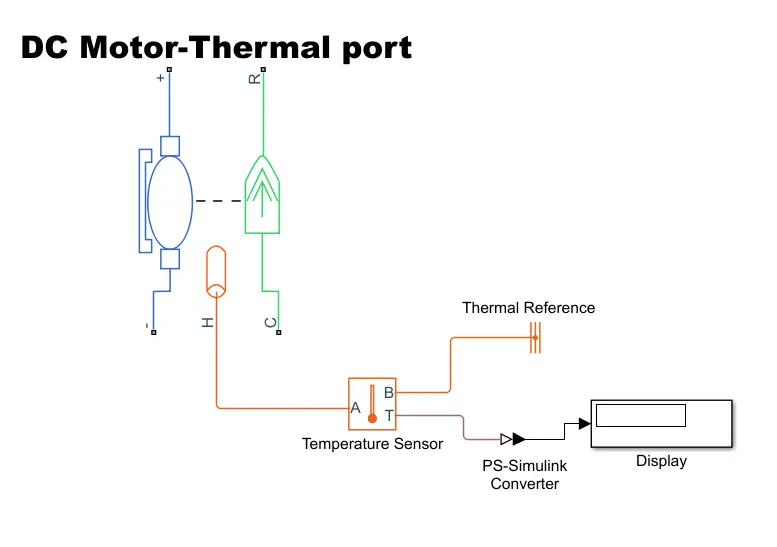
This block represents the electrical and torque characteristics of a DC motor. while using this block we assume that no electromagnetic energy is lost and hence the black emf and torque constants have same numerical values.
Motor parameters can be either be specified directly or derived from no-load speed and torque. when a positive current flows from the electrical + to - port, a positive torque acts from the mechanical C to R ports.
C-port :- Stand for Casing
R-port:- Stands for Rotor
H-port :- Thermal port
Procedure :-
In this DC-Motor
>> R-port is connected to theBase -Port Og the "Simple gear "Blcok
>> C-port :- It is connected to the Mechanical rotational Reference Block , That means This part is remains Constant part
>> (+) -Port is connected to the (+)- Port of the H-bridge Block.
>> And (-) -Port is connected to the (-)- Port of the H-bridge Block
>>Thermal port (H) is connected to the temperature sensor block "A- port"
>>And from themperature Sensor B port is connected to the thermal reference
>>And The temperature is diplaed by using the "Displace block connected to the "T-port " of the temperature sensor with using the Ps- Simulink Converter.
Dc motor Block parameters:-
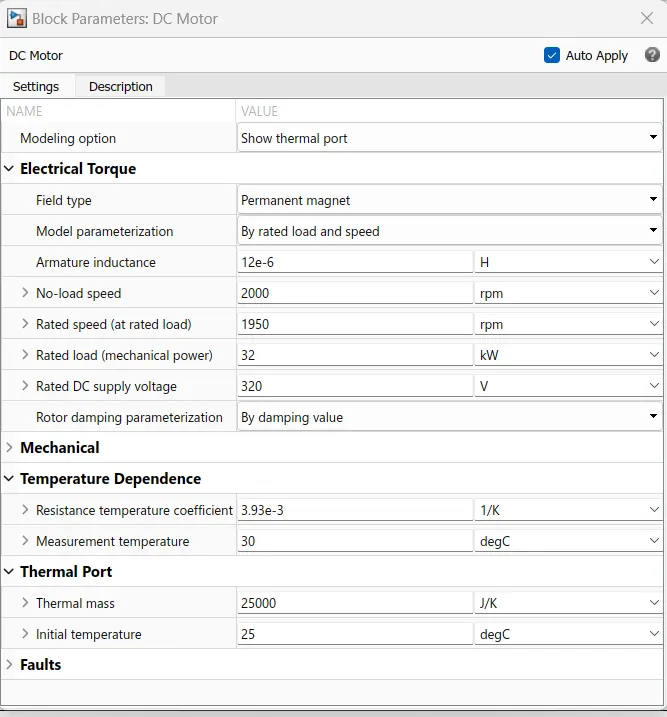
For thIs Dc-Motor i was used the following parameters:-
Field Type :- Perminent Magnenet
Model Parameterization:- By rated load and speed.
No-load speed:-2000 RPm
Rated Speed (at rated load) :-1950 RPM
Rated load(mechanical power) :-35KW
The Rated DC supply voltage :-320
Thermal measuring temperature :-30 °C
3)power Converter Unit subsystem:-
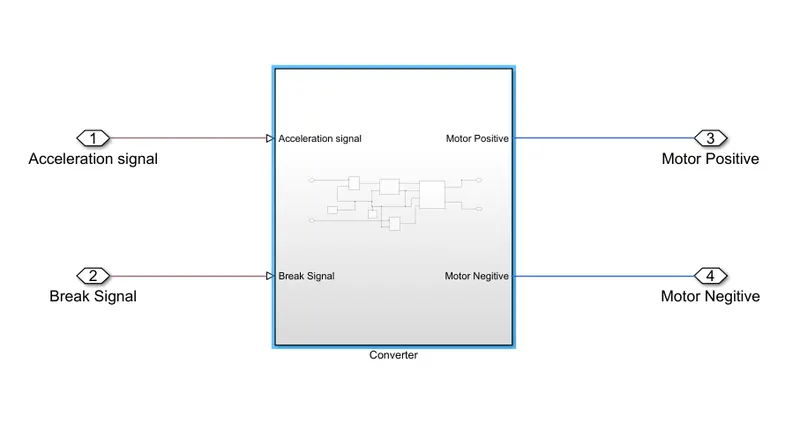
This Subsystem Contains following Blocks :-
For creating the Vehicle body we are used the following blocks:-
H-Bridge:-
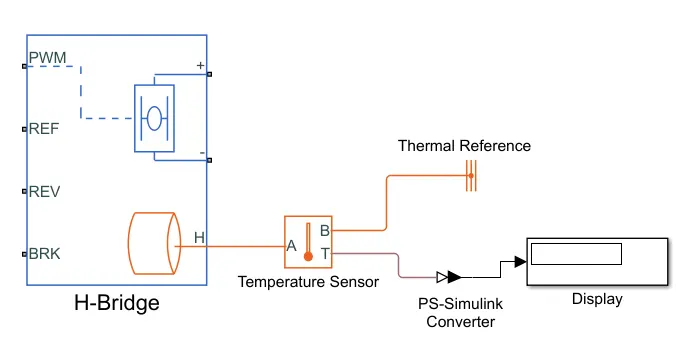
This block represents an H-bridge motor drive. The block can be driven by the Controlled PWM Voltage block in PWM or Averaged mode.
In PWM mode, the motor is powered if the PWM port voltage is above the Enable threshold voltage.
In Averaged mode, the PWM port voltage divided by the PWM signal amplitude parameter defines the ratio of the on-time to the PWM period. Using this ratio and assumptions about the load, the block applies an average voltage to the load that achieves the correct average load current.
The Simulation mode parameter value must be the same for the Controlled PWM Voltage and H-Bridge blocks.
If the REV port voltage is greater than the Reverse threshold voltage, then the output voltage polarity is reversed.
If the BRK port voltage is greater than the Braking threshold voltage, then the output terminals are short circuited via one bridge arm in series with the parallel combination of a second bridge arm and a freewheeling diode.
Voltages at ports PWM, REV and BRK - ports are defined relative to the REF port.
Thermal port (H) is connected to the temperature sensor block "A- port"
And from themperature Sensor B port is connected to the thermal reference
And The temperature is diplaed by using the "Displace block connected to the "T-port " of the temperature sensor with using the Ps- Simulink Converter.
Parameters Block :-
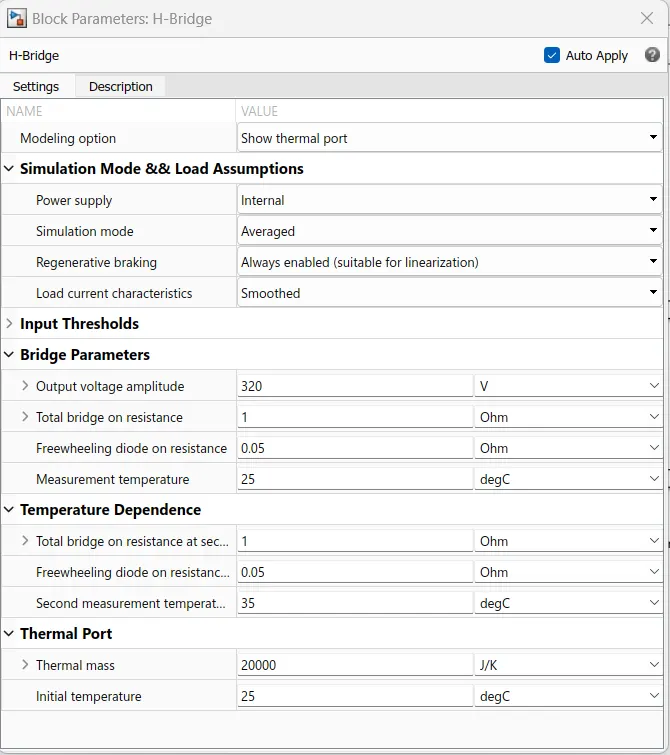
The H_Bridge Parameters are changed as followes :-
Power Supplu:- Internal
Simulation mode :- Averaged
Enabled Threshold Voltage :-0.1 V
PWM Signal Amplitude :- 1 V
Reverse Threshold Voltage:-0.1
Braking Threshold Voltage :-0.1 V
Output Voltage Amplitude:-320 V
Thermal measuring temperature keep as initial conditions.
Controlled PWM Voltage:-
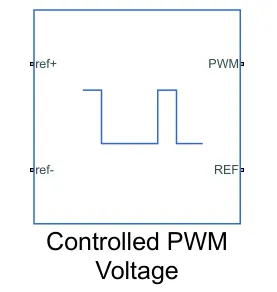
This block creates a Pulse-Width Modulated (PWM) voltage across the PWM and REF ports.
The output voltage is zero when the pulse is low, and is equal to the Output voltage amplitude parameter when high. Duty cycle is set by the input value.
At time zero, the pulse is initialized as high unless the duty cycle is set to zero or the Pulse delay time is greater than zero.
The Simulation mode can be set to PWM or Averaged:-
In PWM mode, the output is a PWM signal.
In Averaged mode, the output is constant with value equal to the averaged PWM signal.
Parameters Block :-
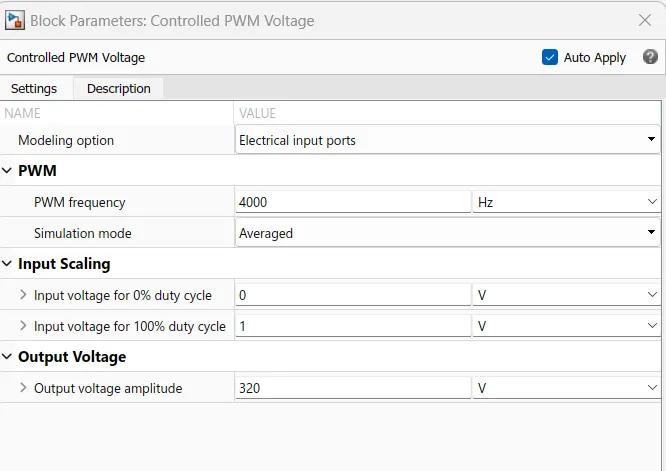
Parameters changed As followes :-
Pwm frequency :-4000 Hz
Simulation mode:- Averaged
Input Voltage for 100% duty cycle:- 1 v
Output voltage amplitude:-320 V
Controlled Voltage Source:-
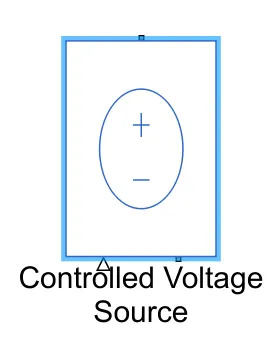
The block represents an ideal voltage source that is powerful enough to maintain the specified voltage at its output regardless of the current passing through it.
The output voltage is V = Vs, where Vs is the numerical value presented at the physical signal port
Converter Part Subsystem Total Simulink Model :-
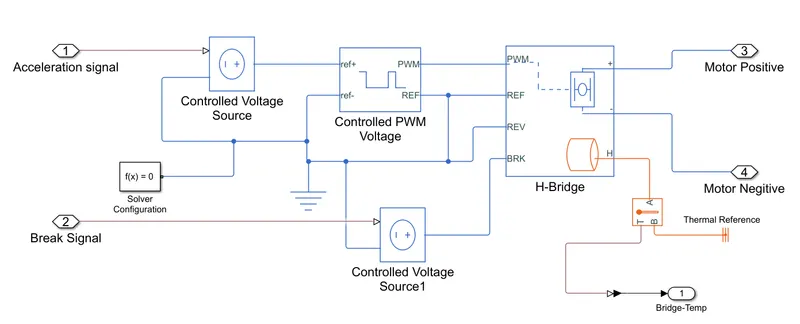
Procedure for creating this power converter Block :-
For creating this model the H-bridge is used as Coverter for in both motering and regerative breaking purpose. this bridge acts as motering condition while its Pulses from the Controlles PWM Voltage Source.
And This H-Bridge Acts as (generator )- while breaking Condition and at this time the given battery is charged throug the gates semiconducter switches used in it.
This H-Bridge Converter both Positive and negative poprts are connected to Motor positive and negative terminals respectively.
From the "Controlled PWM Voltage "Source Block H-brige Gets the signals for acceleration .
The reference Of the "Controlled PWM Voltage "Block is conncted to the refernce port of H-Bridge.
ref + And Ref- Ports are connected to the Controlled voltage source block and Electrical reference block respectvely.
brk " port of the H-bridge is connected to the Controlled voltage source block for getting the Deseleration Break command from the driver block.
Thermal port (H) is connected to the temperature sensor block "A- port"
And from themperature Sensor B port is connected to the thermal reference
And The temperature is diplaed by using the "Displace block connected to the "T-port " of the temperature sensor with using the Ps- Simulink Converter.
4)Longitudal driver:-
A parametric longitudinal speed tracking controller for generating normalized acceleration and braking commands based on reference and feedback velocities.
Use the external actions to input signals that can disable, hold, or override the closed-loop commands determined by the block. The block uses this priority for the input commands: disable, hold, override.
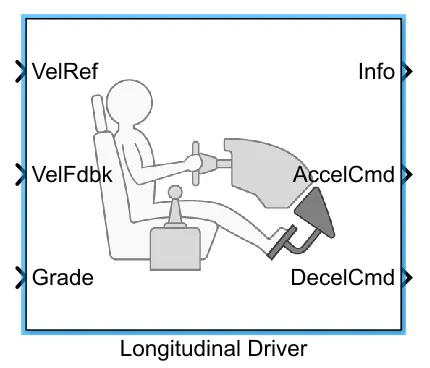
This block consistes 6 port, In these Ports 3 are input comanding ports and ather 3 ports are output signals ports
3 input poerts are :-
velref:-
This port Stands for Velocity Reference " for this port we are assigned the input signal as pre defined Drive cycle velocity by using the "Drive cycle Sorce " block
Velfdbk:-
This port Stands for Velocityfeedback " for this port we are assigned the input signal From the beed back of vehicle velocity port.
Grade:-
This port is used for gradient values allows movement of the vehicle on the vertical curves smoothly. The gradient also helps to drain off rainwater from the surface of the roads. Gradients are very helpful on curved roads in flat terrain where drainage problem arises.
For this model we are assigned the Grade value as -Zero(0) by using the constant block.
3 output poerts are :-
Info:-
This port will gives the total information recarded after completion of drive cycle.
AccelCmd:-
This port stand for Acceleration command ,This command gives to vehicle through converted by using the Controlled Voltage source.
DeseCmd:-
This port stand for Deseleartion or break command ,This command gives to vehicle through converted by using the Controlled Voltage source.
Parameters Block :-
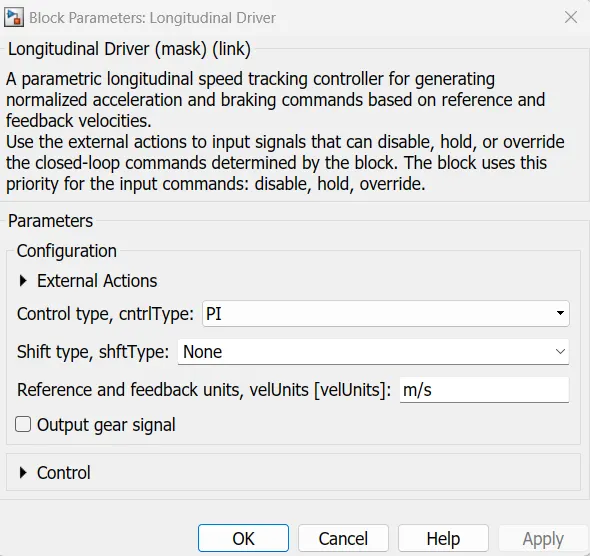
All the default data provided in the driver block is considered as input to the simulation.
5)Drive Cycle Subsystem:-
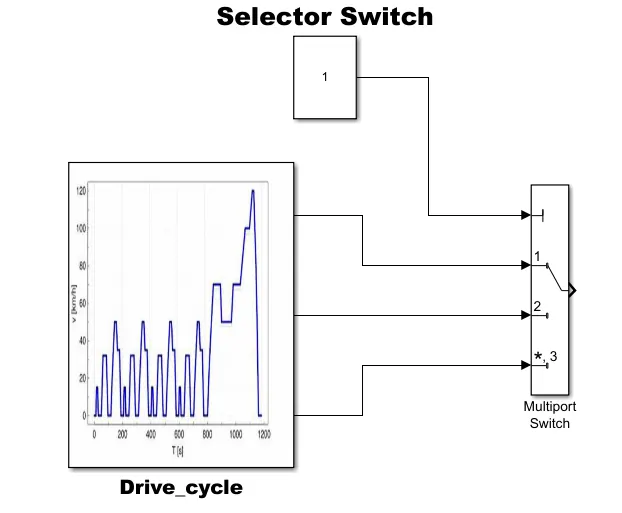
The range of electric vehicles is the major problem faced by the automobile industry because storing electrical energy efficiently is a very tough task for engineers. This is a critical issue in the design of any electrical vehicle. For that what we can do is test the vehicle by driving in reality or in simulation through a profile of ever-changing speeds. These test drive cycles have been developed to provide a realistic and practical test for the emissions of vehicles.
Drive Cycle Subsystem total Model :-
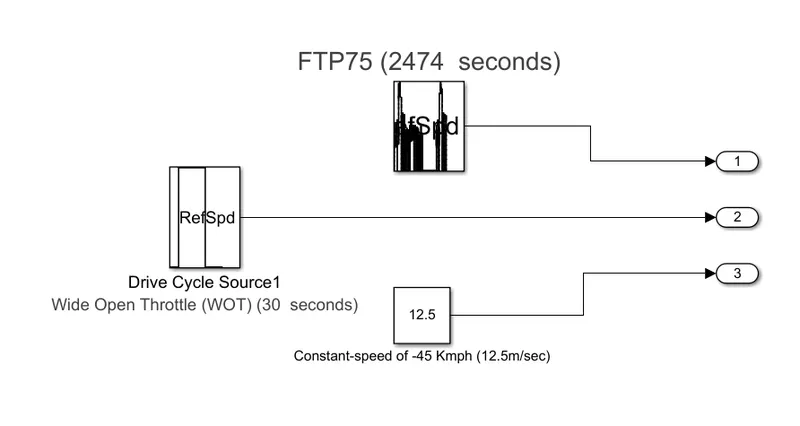
Now for this model, I was used three drive cycles are as followes :-
1) "FTP75-2474 sec" drive cycle
2)Wide open Throttle -30 sec drive cycle
3)Constant :- For assiging the constant speed driving at 45 kmph - 12.5 meter /Sec
These drive selection is done by using the multiport switch with using the constanet Block. And this drive cycle are used for reference to the driver Block for moving as this reference values of velocity with Reference feed back signal as veleocity from vehicle.
With this simulation, the distance traveled by the vehicle at the end of this cycle is calculated using MATLAB software And display the valuse by using The Display block.
In this drive cycle, the condition or the velocity of the propelling vehicle is noted at each second. The important data that needs to maintain as a record is the amount of charge removed from the battery.
The depth of discharge of the battery, and the distance traveled. By taking these velocities as input and is fed to the longitudinal driver block.
It calculates acceleration and thus the tractive effort, and thus the motor power, torque, and speed. Using this data motor efficiency can be found and also the electrical power going into the motor. This calculation is repeated every one second till the end of the cycle.
Parameter Block :-
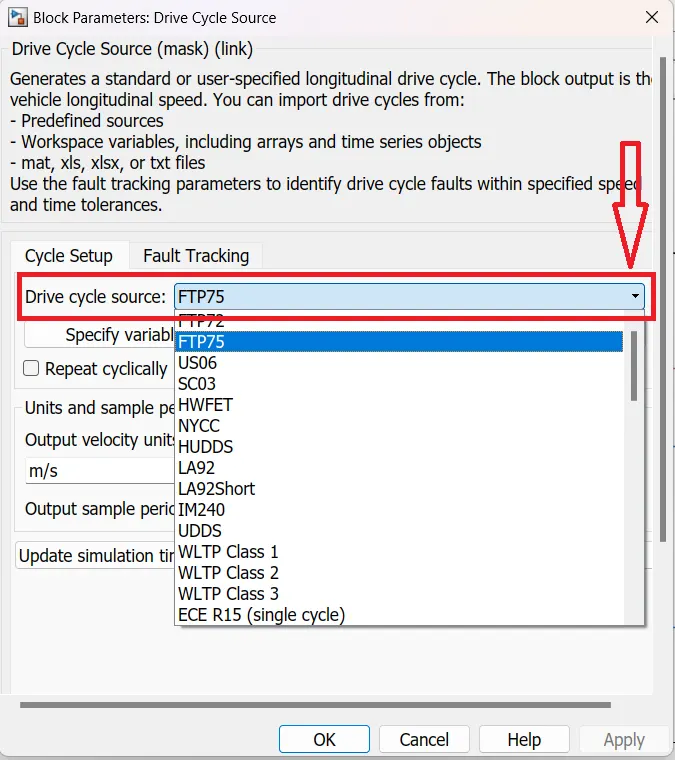
This Drive cycle source having a number of pre-defined drive cycle.
We can select the required drive cycle from scroll down the arrow button. Shown in above parameters block.
6)Battery and SOC %
For this model i was used the following Battery model
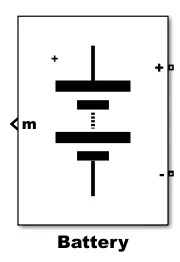
Using this battery block, the state of charge (SOC) , current across the battery can also be calculated. these valus are plotted by using the Scope Block.
Parameter Block :-
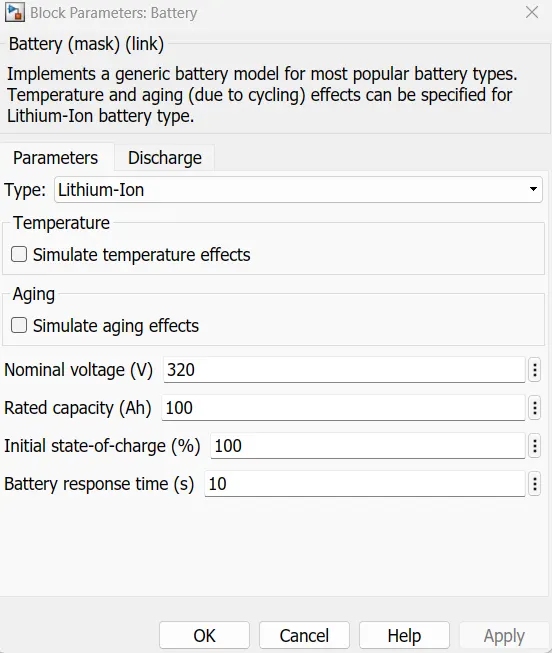
For this model i was used following parameters :-
>>Nominal Voltage :-320 V
>>Rated capacity:-100 Ah
>>initial state of charge:-100 %
>>Battery Responce Time=10 sec
Bus selector :-
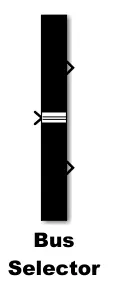
This block accepts a bus as input which can be created from a Bus Creator, Bus Selector or a block that defines its output using a bus object. The left listbox shows the elements in the input bus. Use the Select button to select the output elements. The right listbox shows the selections. Use the Up, Down, or Remove button to reorder the selections. Check 'Output as virtual bus' to output a single bus.
Bus selector parameter Block:-
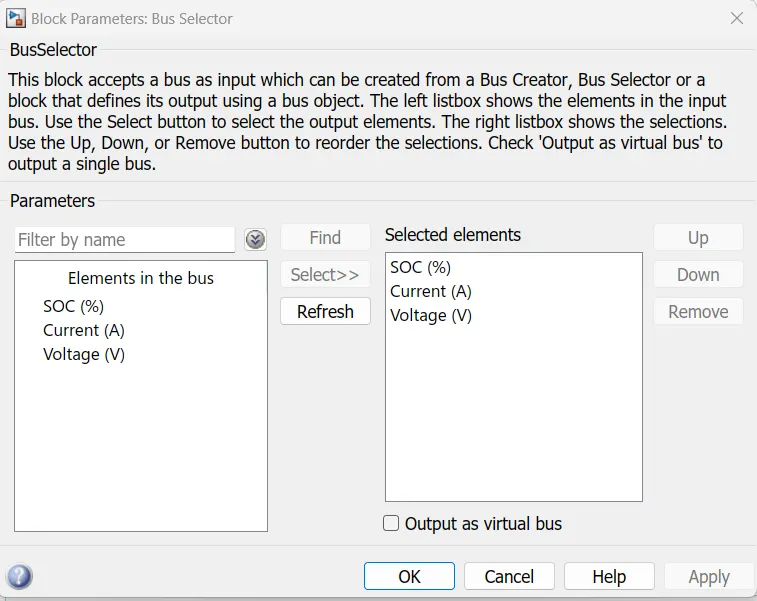
>>This Bus selector is used for knowing the Battery Current ,Volatage and estimate the % of SOC.
>>This battery % soc is for knowing the chargeble percentage of capacity of battery.
7) Energy Consuption Calculation.
We Know that the Energy is Nothing but the integral of Power with respect to time. This can be obtained by using the Below formula.
we know that the,


                        Power  p =Enenrgy * time
then,

                         Enengry = power / time


where,
 p= V* I
V= velocity
I=Current
This can be implementd by using simulink as followes :-
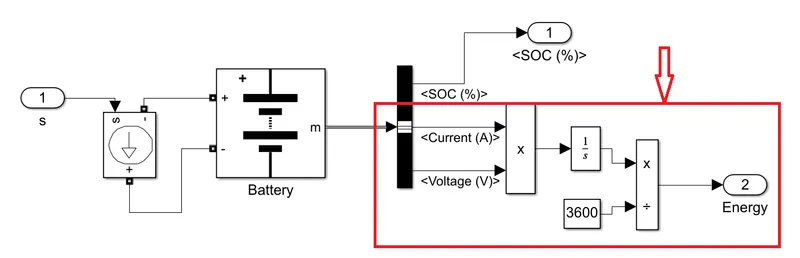
Procedure:-
>> From the above model we get the Energy from the integartion of product value of both Current and Voltage with using the product and integarl Blocks.
>>Then The obtained Values is deveid with (time-3600 sec) by using the divide block
>>Result will get in the form of graphical representation by using the Scope Block.
>>Finally at each case we get the energy consuption og the vehicle obtained.
Distance measuring Block :-
Distnace can be obtained by integarion of Velocity of vehicle ,And this can be implemented in simulink by using folloeing subsystem.
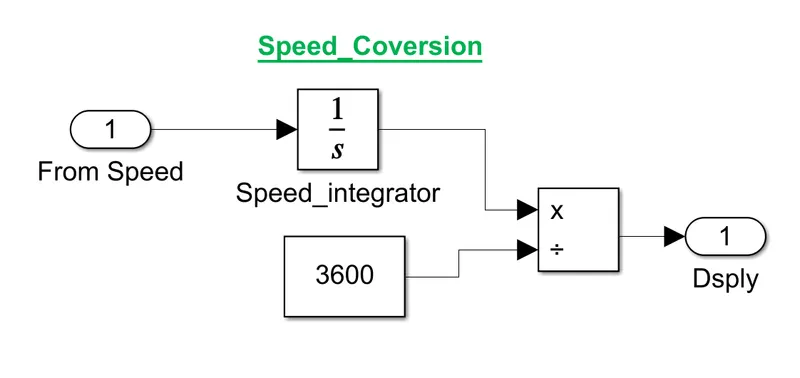
>> This Implemenatation of Speed model by using the converting the velocty(Speed) Kmph is integrated by using intergrator block and devide by 3600 sec (for converting to Hrs) using the devide blcok and fimallly the output of this sysytem given to the display blcok for knowing the Distance(KM) travlled by the vehicle.
Other Block details :-
Electrical Reference :-
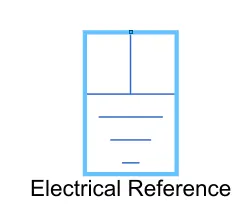
Electrical reference port. A model must contain at least one electrical reference port (electrical ground).
It is needed to discharge the excess charges flowing through the devices. so all the negative terminals of the devices are connected to the ground.
PS Terminator:-
Use this block to terminate physical signal outputs. Unconnected physical signal output ports do not generate warnings.
PS Constant: :-
This block represents a constant and is taken from the simscape library.
The Constant parameter accepts both positive and negative values. The block output is a physical signal port.
Scope :-
This block is used for getting the Output signal values in graphical represenatation.
Mechanical rotational Reference Block :-
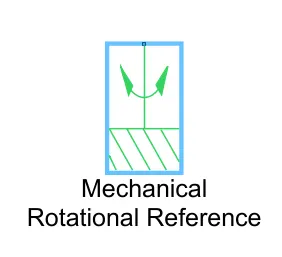
This block represents a mechanical rotational reference point, that is, a frame or a ground. Use it to connect mechanical rotational ports that are rigidly affixed to the frame (ground).
Controlled Current Source :-
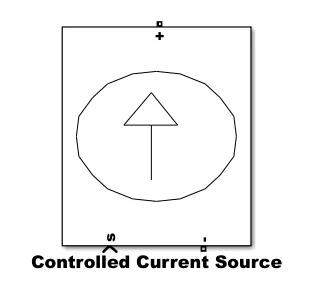
Converts the Simulink input signal into an equivalent current source. The generated current is driven by the input signal of the block.
Current Sensor :-
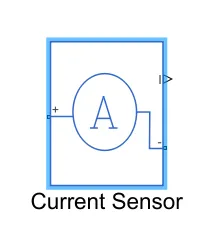
The block represents an ideal current sensor, that is, a device that converts current measured in any electrical branch into a physical signal proportional to the current.
Connections + and - are conserving electrical ports through which the sensor is inserted into the circuit.
Connection I is a physical signal output port that outputs current value.
Temperature Sensor:-
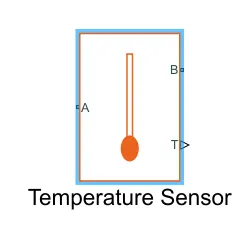
This block measures temperature in a thermal network. There is no heat flow through the sensor. The physical signal port T reports the temperature difference across the sensor.
The measurement is positive when the temperature at port A is greater than the temperature at port B.
Thermal Reference:-
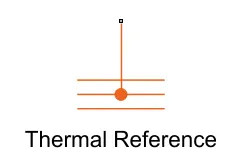
This block represents a reference point in a thermal network where the temperature is equal to absolute zero.
Solver Configaration :-
This block is used to Defines solver settings to use for simulation.
Powergui:-
This block is used to Set simulation type, simulation parameters, and preferences.
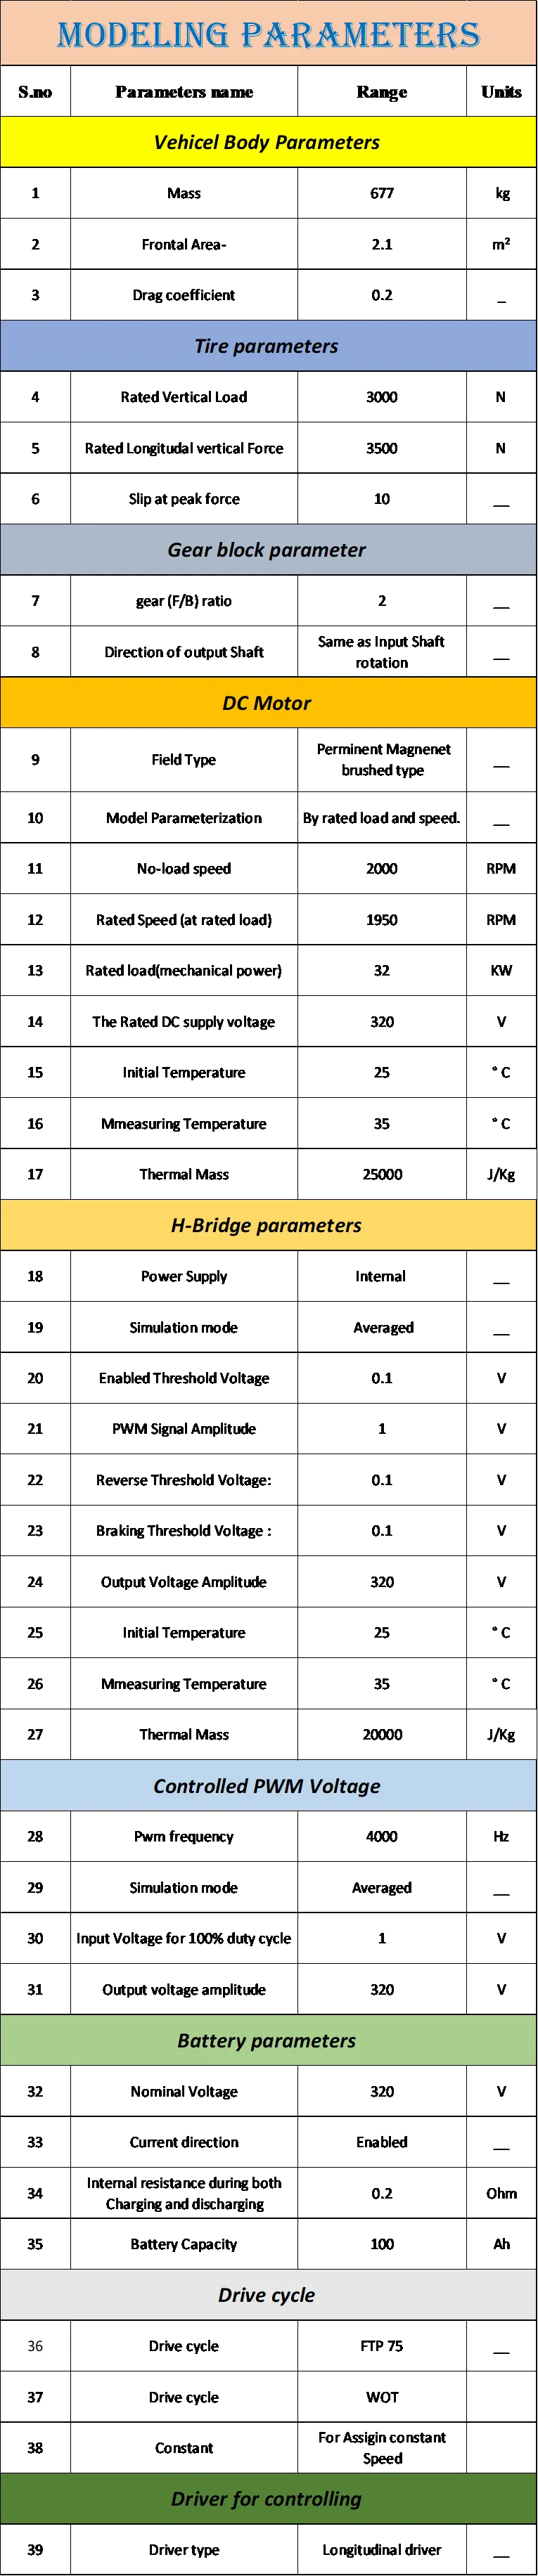
Modeling Parameters List :-
I was created this electric Model by using the follwing assumption parameters.
Design parameters Excel-sheet Link :-E_Rickshaw_Parameters.xlsx
8)Output Results Plots :-
This Results of EV-Rickshaw will explained by using the 3 drive cycle (2- Standard Drive Cycle and 1 is constant user defined Drive cycle with 45 Kmph ) as followes:-
Outcomes from each drive cycle :-
1)Velocity graph
2)Distance Mesuring graph
3)Battery pack Graph
4)Energy Consuption
5)Temerature range
Drive Cycle :-FTP75-2474 sec
1)Velocity graph:-
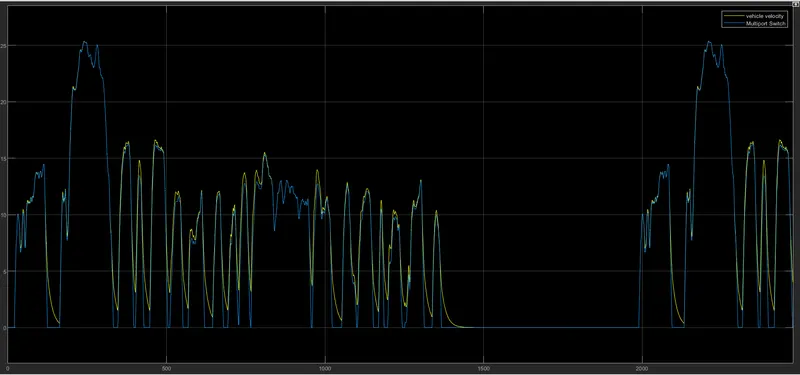
>> from the above Graph
yellow color plot is Vehicle Velocity and Blue color Plot is Reference Drive cycle velocity
>> From The above graph we conclude that, the vehicle velocity is Matched Alomost with Reference Drive cycle(FTP75) Velocty ,that means Both velocity graphs are 90 to 93 % is overlapped each other.
>>From this Graph we can Conclude That the " Vehicle controlling was achived " Properly by using the various Types of vehicle parameters used with in this modelling of Electric Rickshaw.
2)Distance Mesuring graph:-
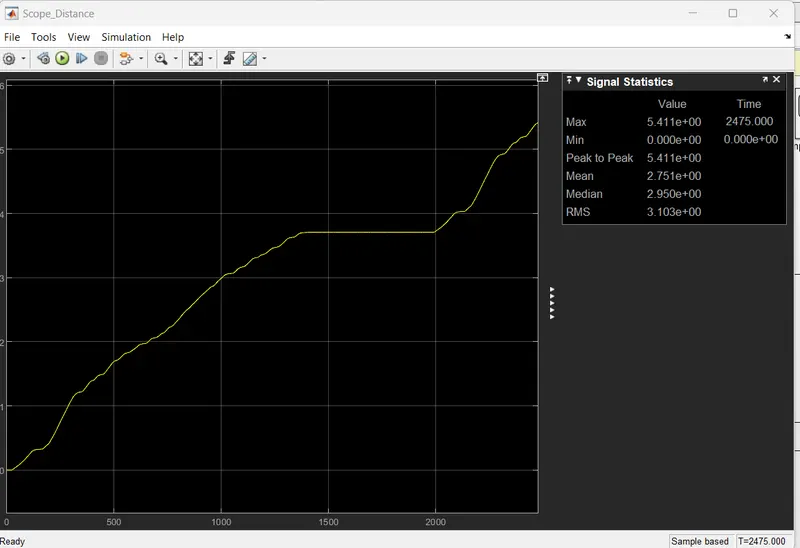
>>Total Distance covered by the vehicle is plotted along the time using distance measuring Subsystem blck connected with vehicle Veclocity Blcok.
>> The distance Travelled By vehicle during the (2474 sec) period of time is around 5.41 kms.
3)Battery pack SOC %Graph:-
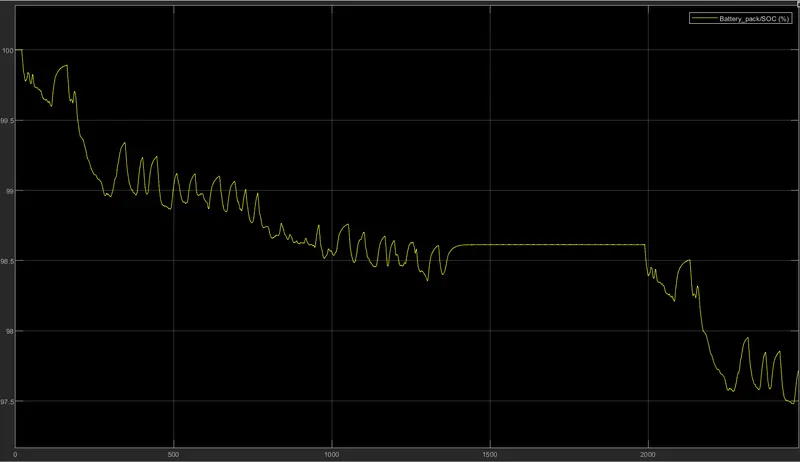
>>The above graph is show the Battery SOC % by using the drive cycle as FTP75 with 2474 sec time duration.
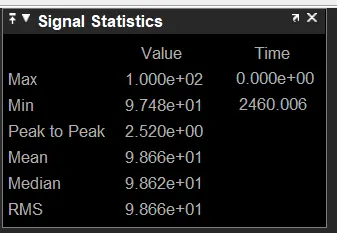
>> From the Above signal statistics of SOC % measurments with the vehicle travelled distance is 5.41 Kms with the time 2474 sec the battery SOC % is allmost 97.4 % .
4)Energy Consuption
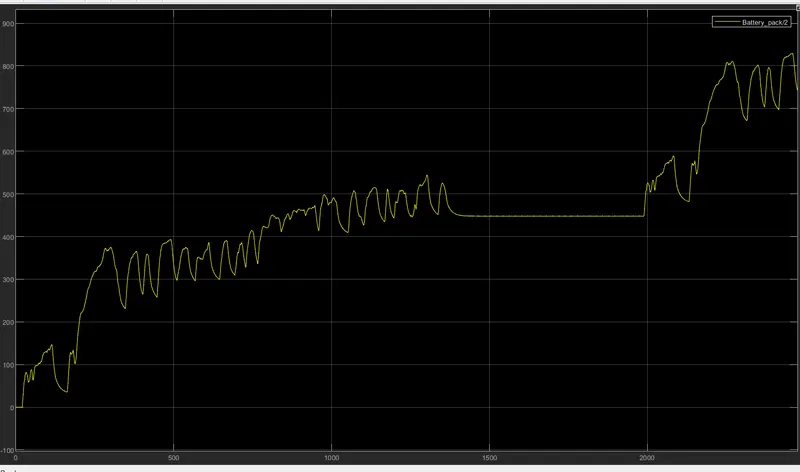
>>The above graph is show the Battery Energy consuption of vehicle by using the drive cycle as FTP75 with 2474 sec
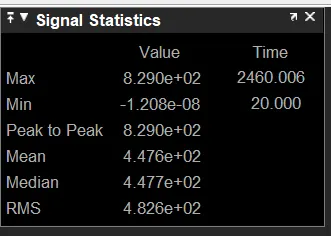
>> From the Above signal statistics of Enerygy graph measurments with the vehicle travelled distance is 5.41 Kms with the time 2474 sec the battery Energy consumption is allmost 8.29 kJ consumed.
5)Temerature range:-
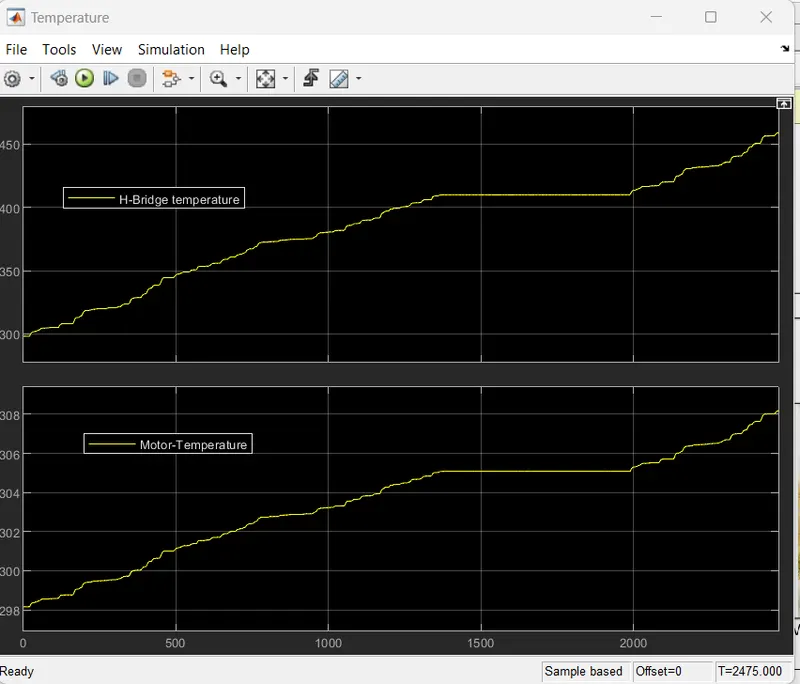
>> From the above graph
Top plot (H-Bridge temperature):-
>>By using the drive cycle as FTP75 with 2474 sec and distance covered by vehicle is 5.41 Km then the H-BRidge Temerature is almost raises from 300° c to 458 ° C i.e temperature is almost 158° c raises in H-Bridge.
Bottom Plot (Motor Temperature):-
>>By using the drive cycle as FTP75 with 2474 sec and distance covered by vehicle is 5.41 Km then the Motor Temerature is almost raises from 298° c to 308 ° C i.e temperature is almost 10° c raises in Motor.
Drive Cycle :-WOT Drive cycle -30 sec
1)Velocity graph:-
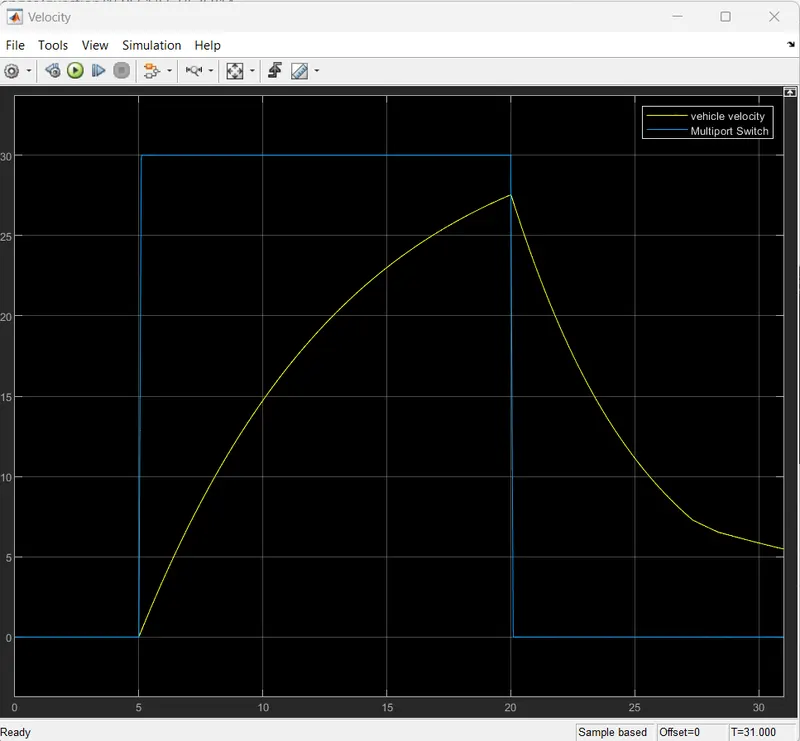
>> from the above Graph
yellow color plot is Vehicle Velocity and Blue color Plot is Reference Drive cycle velocity
>> From The above graph we conclude that, the vehicle velocity is reached maximum 28 kmph .tHos os maximum speed of vehicle .
>>By using the WOT condition we can determine the maximum Throttle range Of vehilce durng the time interval of 30 sec.
2)Distance Mesuring graph:-
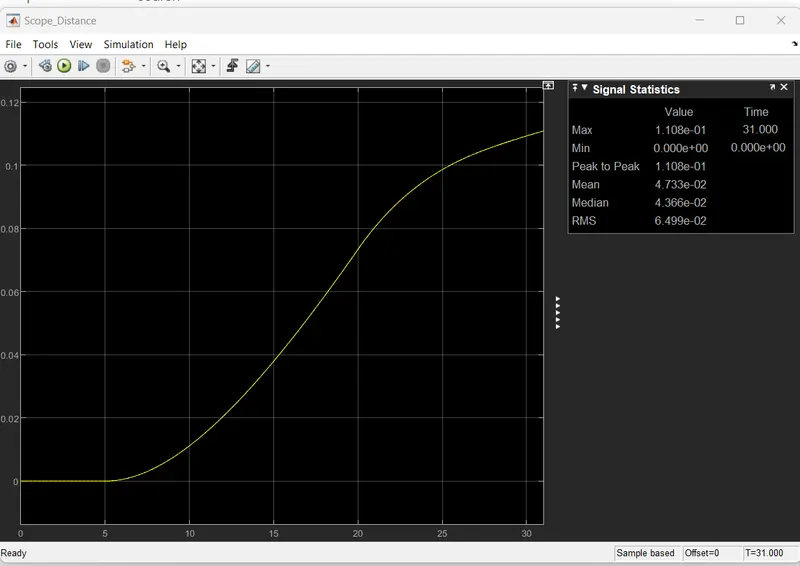
>>Total Distance covered by the vehicle is plotted along the time using distance measuring Subsystem blck connected with vehicle Veclocity Blcok.
>> The distance Travelled By vehicle during the (30 sec) period of time is around 0.114 kms.
3)Battery pack SOC %Graph:-
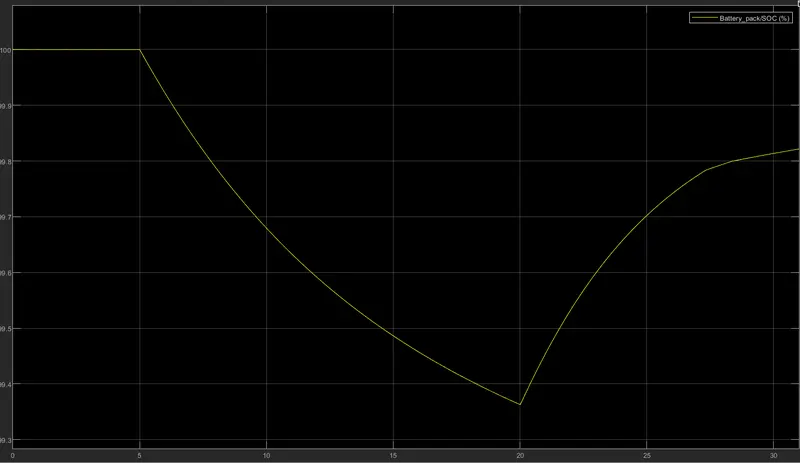
>>The above graph is show the Battery SOC % by using the drive cycle as WOT with 30sec time duration.
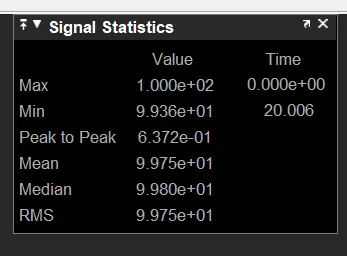
>> From the Above signal statistics of SOC % measurments with the vehicle travelled distance is 0.114 Kms with the time 30 sec the battery SOC % is allmost 99.36 % .
4)Energy Consuption:-
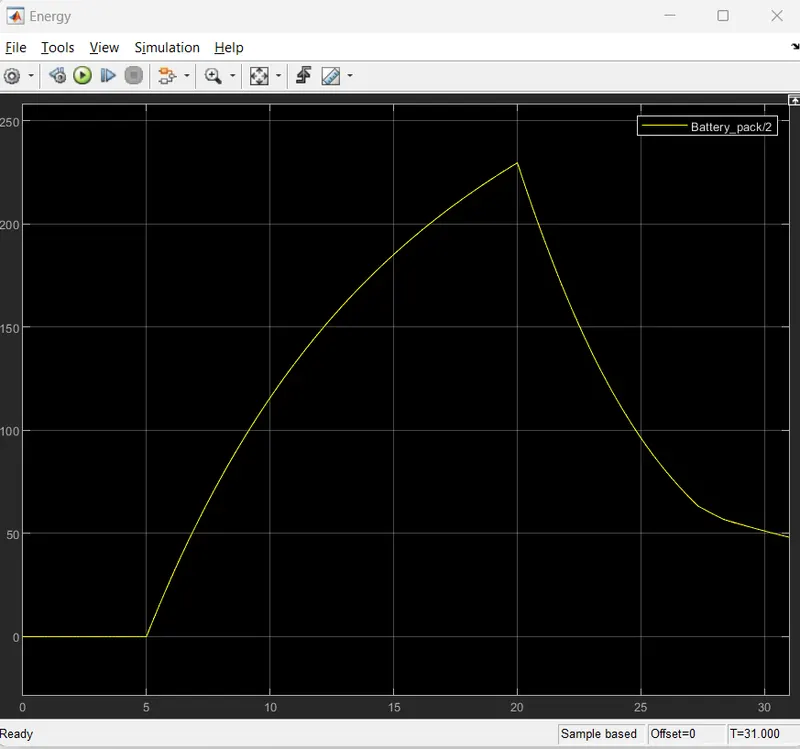
>>The above graph is show the Battery Energy consuption of vehicle by using the drive cycle as WOT with 30 sec time duration.
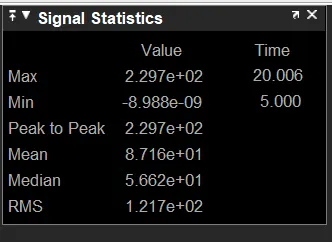
>> From the Above signal statistics of Enerygy graph measurments with the vehicle travelled distance is 0.114 Kms with the time 30 sec the battery Energy consumption is allmost 2.29 kJ consumed.
5)Temerature range:-
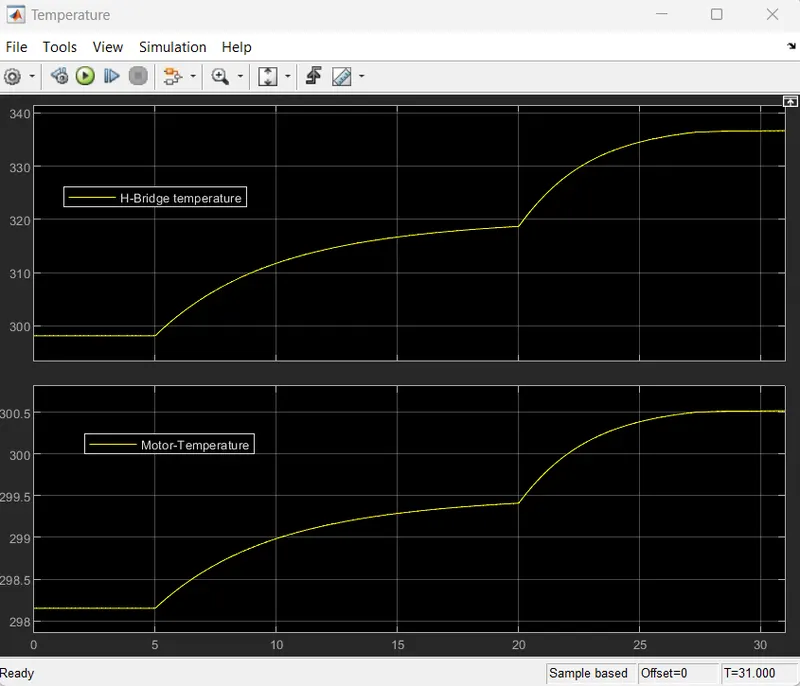
>> From the above graph
Top plot (H-Bridge temperature):-
>>By using the drive cycle as WOT with 30 sec and distance covered by vehicle is 0.114 Km then the H-BRidge Temerature is almost raises from 300° c to 338 ° C i.e temperature is almost 38° c raises in H-Bridge.
Bottom Plot (Motor Temperature):-
>>By using the drive cycle as FTP75 with 2474 sec and distance covered by vehicle is 5.41 Km then the Motor Temerature is almost raises from 298° c to 300.4 ° C i.e temperature is almost 2.15 ° c raises in Motor.
Drive cycle :- Constant 45 KMph -(12.5 m/sec)-time -28805sec
This drive cycle is for getting the require results for 100 km constant speed driving at 45 kmph.
For travelling distance covered upto 100 km by vehicle is travelling time in sec-28805
Actually the vehicle intially at 0 Kmph upto 4.5 sec
For travelling 100 km distance time required -->28805 sec

1)Velocity graph:-
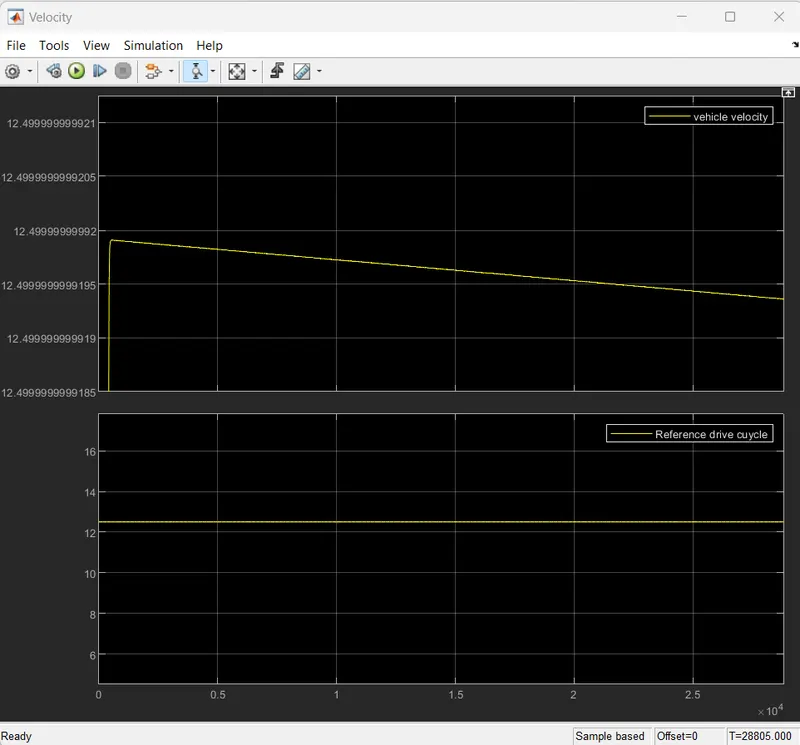
>> From the above graph
Top plot is vehicle velocity :-
>> In this drive cycle we are using the Constant speed maintaince as 45 kmph (12.5 m/sec).
>> The vehicle gets raised from 0-45 Kmph nearly takes 0.4 sec
>>After 0.4 sec the vehicle maintain the constant speed as 45 kmph (12.5 m/sec).
Bottom plot (Reference Velocity-45 Kmph):-
>>This plot showes the Reference velocity as 45kmph speed as constatnt by using the Constant block.
2)Distance Mesuring graph:-
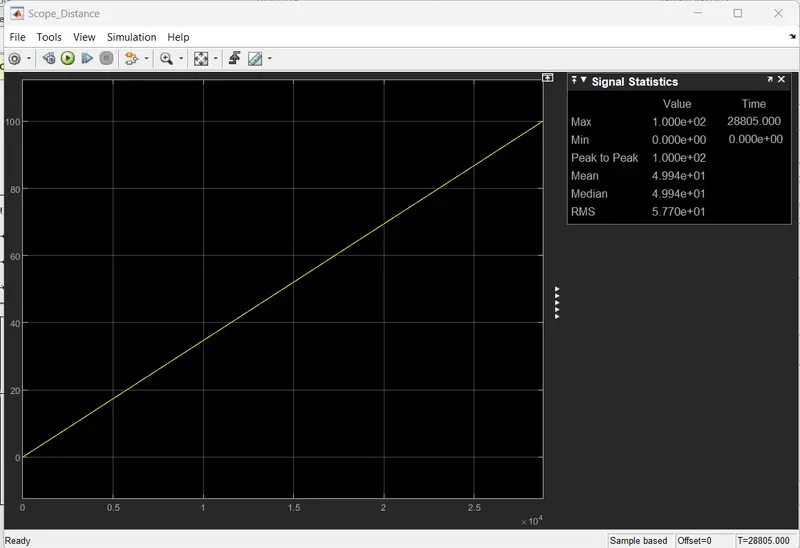
>>Total Distance covered by the vehicle is plotted along the time using distance measuring Subsystem blck connected with vehicle Veclocity Blcok.
>> The distance Travelled By vehicle during the (28805 sec) period of time is around 100 kms. with constant speed of 45 KMph(12.5 m/sec)
3)Battery pack SOC %Graph:-
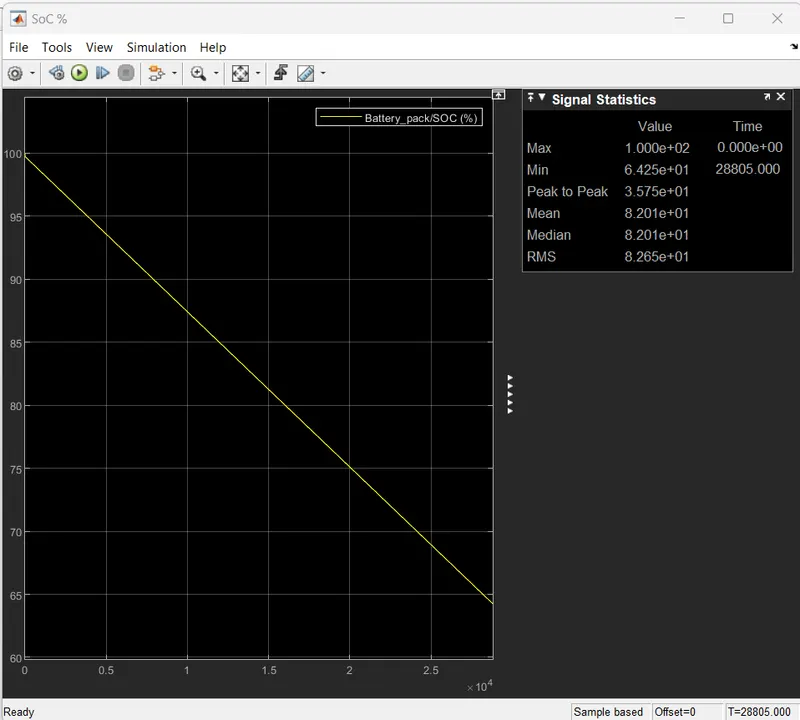
>>The above graph is show the Battery SOC % by using the drive cycle as User defined constant speed of 45 kmph with 28805 sec time duration.
>> From the Above signal statistics of SOC % measurments with the vehicle travelled distance is 100 Kms with the time 28805 sec the battery SOC % is allmost 64.25 % .
4)Energy Consuption:-
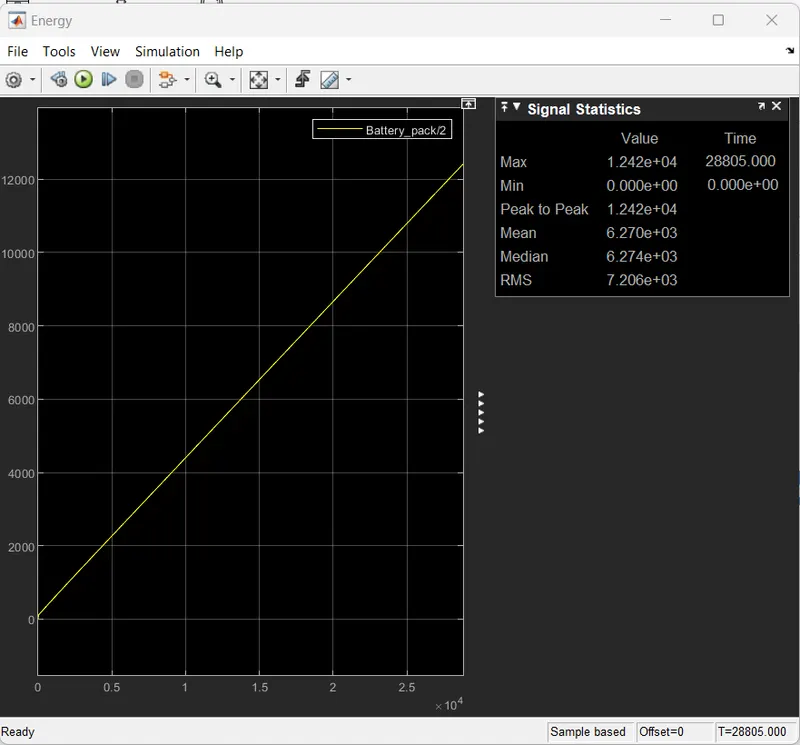
>>The above graph is show the Battery Energy consuption of vehicle by using the drive cycle as User defined constant speed of 45 kmph with 28805 sec time duration.
>> From the Above signal statistics of Enerygy graph measurments with the vehicle travelled distance is 100 Kms with the time 28805 sec the battery Energy consumption is allmost 12.24 kJ consumed.
5)Temerature range:-
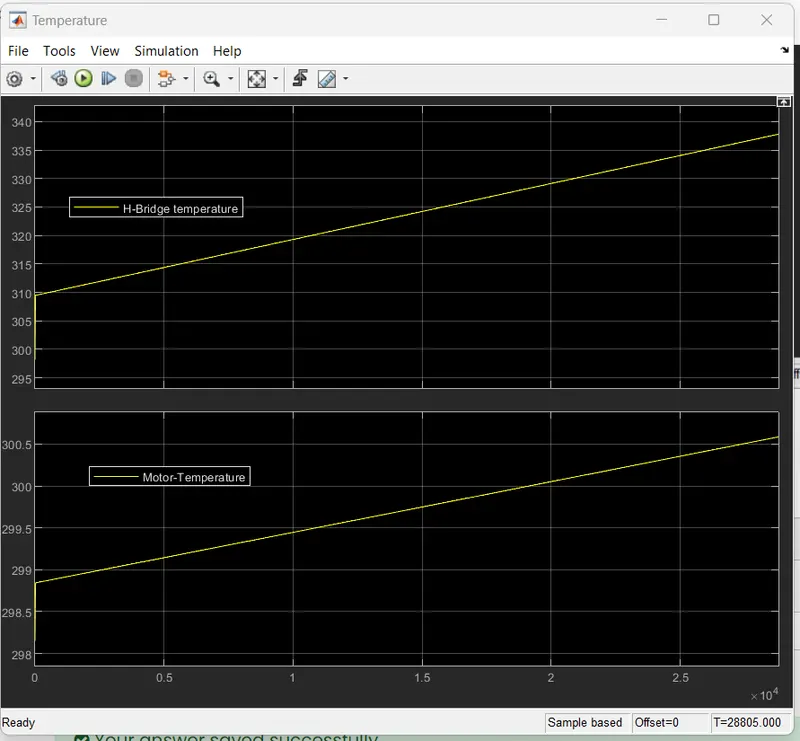
>> From the above graph
Top plot (H-Bridge temperature):-
>>By using the drive cycle as User defined constant speed of 45 kmph with 28805 sec time duration , and distance covered by vehicle is 100 Km then the H-BRidge Temerature is almost raises from 309° c to 338 ° C i.e temperature is almost 29° c raises in H-Bridge.
Bottom Plot (Motor Temperature):-
>>By using the drive cycle as User defined constant speed of 45 kmph with 28805 sec time duration, and distance covered by vehicle is 100 Kmthen the Motor Temerature is almost raises from 298° c to 300.52 ° C i.e temperature is almost 1.67 ° c raises in Motor.
Observations
The observations of Electric Rickshaw by using the three different drive cycles are as followes :-

Results :-
For using three driving cycles shown energy consumption, temperature rise of motor and controller for 100 km constant speed driving at 45 kmph. is explained with proper graphical and tabular representation.
Excell sheet link :-E_Rickshaw_Parameters.xlsx
Simulink model Link:- https://drive.google.com/file/d/1bYesQSF3GZOkB2ExXaTM1kXvghl0rjXI/view?usp=share_link
Conclusion :-
We can conclude that the requiremets for this EV-Rickshaw Simulink is Desigined By using of relevent Energy calculations and Matlab/ Simulink Tools.
---------------------------------------------------------------------------------------------------------------------------------------------
(The End)