Final Project: Electric Rickshaw modelling
Aim: To create a detailed MATLAB model of an electric rickshaw (three wheel passenger vehicle).
Objective: In this project we are going to create a full electric three wheel passenger vehicle model and observe all its performance parameters.
Introduction:
Let us first look at the layout and working of an electric rickshaw.
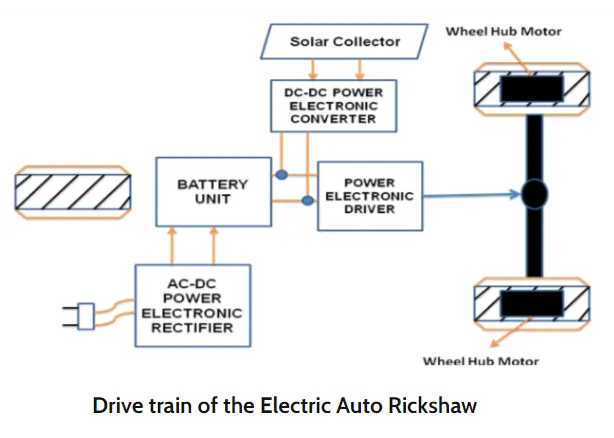
Electric rickshaws have the same principle as EV's. They also run on lithium-ion battery packs. The motors generally used here are DC motors. Mostly, electric rickshaws are rear wheel driven.
The drive train is seen above. The power for the battery pack goes via an AC charger circuit with a rectifier to convert them into DC power. After charging the battery pack, the signals are sent to the electronic control unit (power converters & motor controllers). The purpose of these ECU's is to control speed according to the driver input (accelerator & brake). These pulses are then sent to the DC motor which transfer power to the wheels.
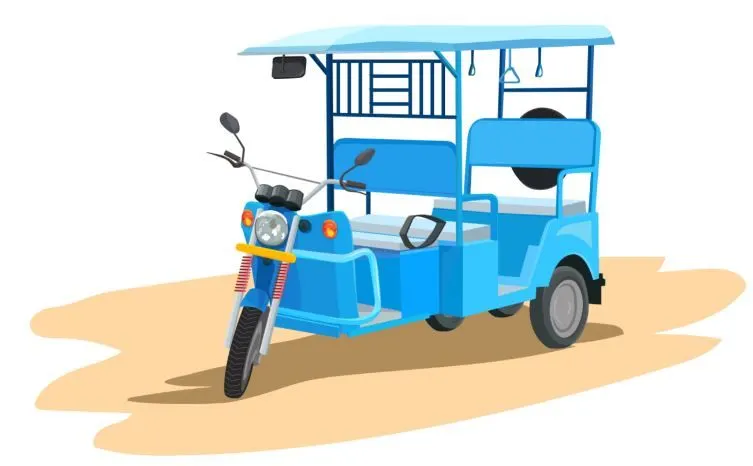
A picture of an electric rickshaw is seen below.
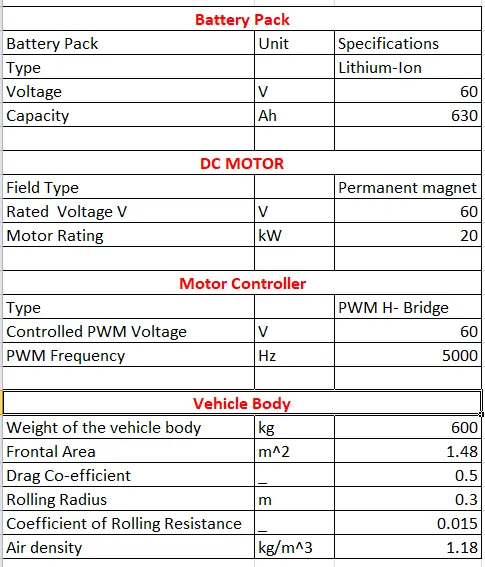
Now we will see the specifications of this electric rickshaw before proceeding to model them in MATLAB.
Inputs and assume data:
Simulation Model:
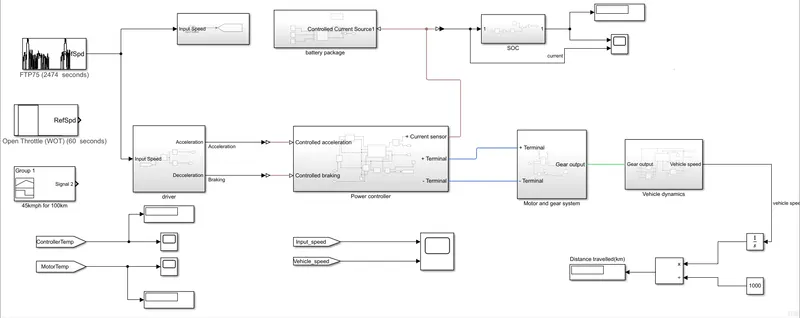
Model Parameters:
Simulink Model:
When working with a bigger models, it is good idea to create a subsystem. In order to group of component into a single block. You can easily create a subsystem. I have divided the simulation system into a Six subsystem.
-
We have 6 different sub-systems in the Model,
- First subsystem contains the Driver
- Second Subsystem contains the Power Controller
- Third Subsystem contains the Battery pack
- Fourth Subsystem contains the SOC(State of Charge)
- Fifth Subsystem contains the Motor and Gear System
- Sixth Subsystem contains the Vehicle Dynamics
We see one by one,
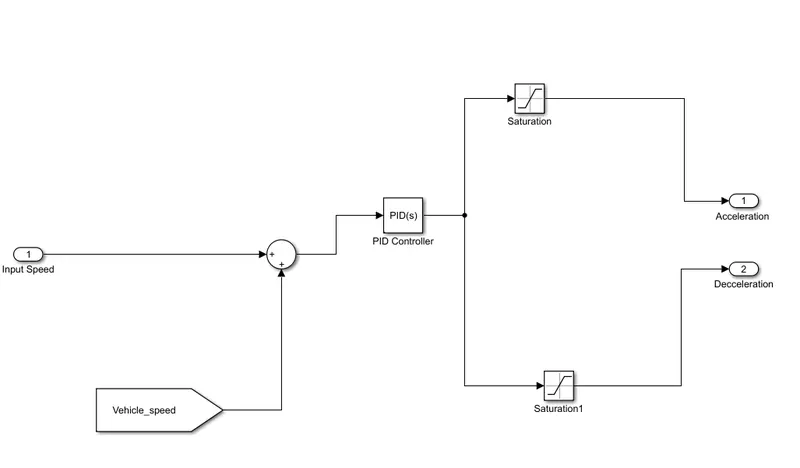
1-> Subsystem contains the Driver:
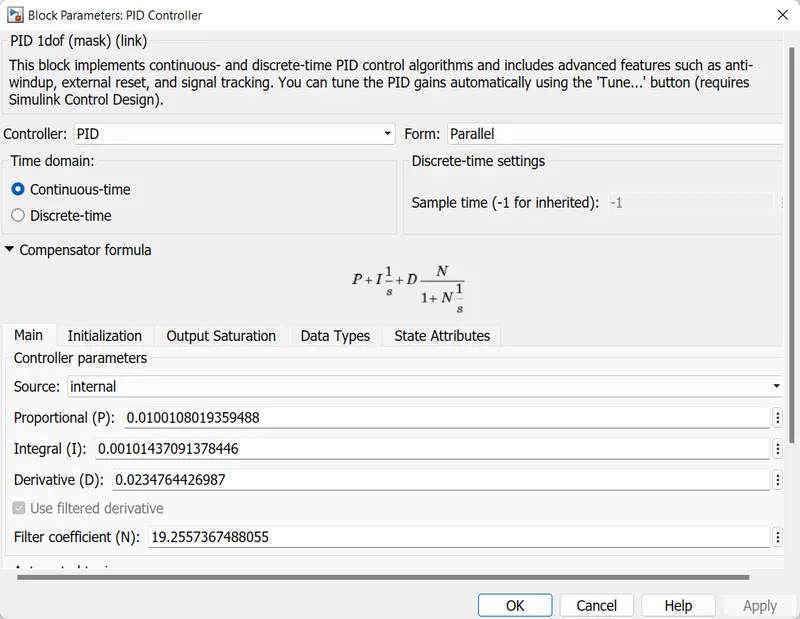
The input for the speed is taken from the drive cycle and is controlled by a PID Controller. The acceleration and deceleration of the vehicle with a saturation of 0.5 depends on the actual vehicle speed input into the system. The PID Values are set to default.
2-> Subsystem contains the Power Controller:
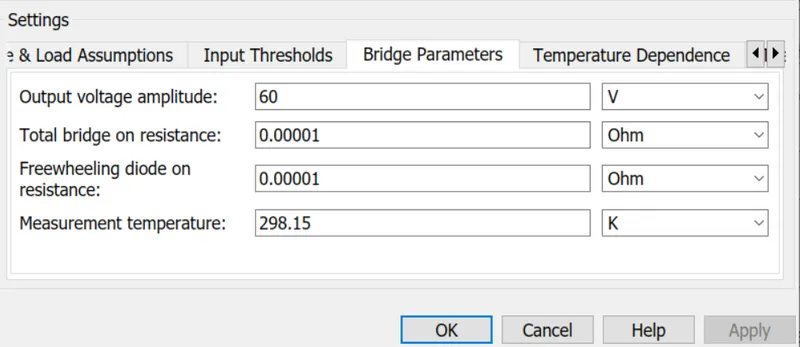
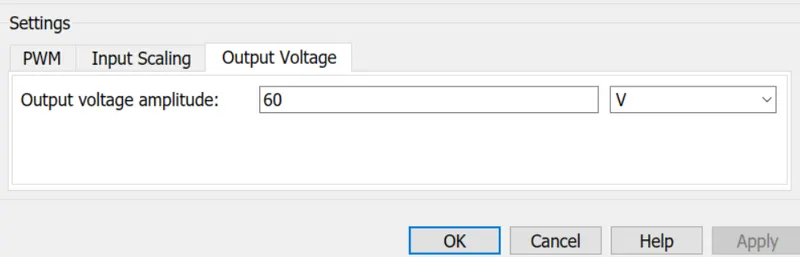
All the systems of the model are dependent of power and it has to be supplied in control. A power controller consists of a sine PWM voltage circuit, H-bridge circuit and a current sensor. The output voltage amplitude is set to 110V for PWM and the same is for H-Bridge.
The image shows of the Motor circuit and controlled subsystem.
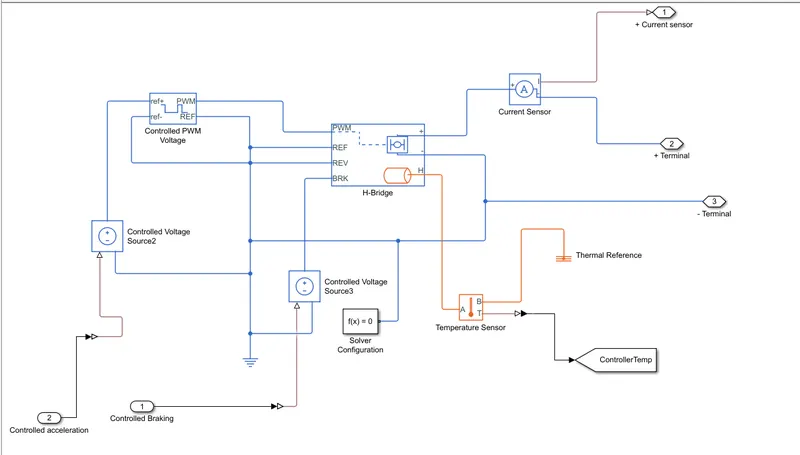
1) H-Bridge Motor Driver
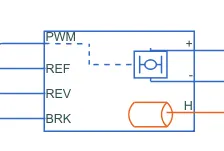
The H - Bridge with Thermal Port block is used to drive a motor. The H bridge two output ports
Positive Port
Negative Port
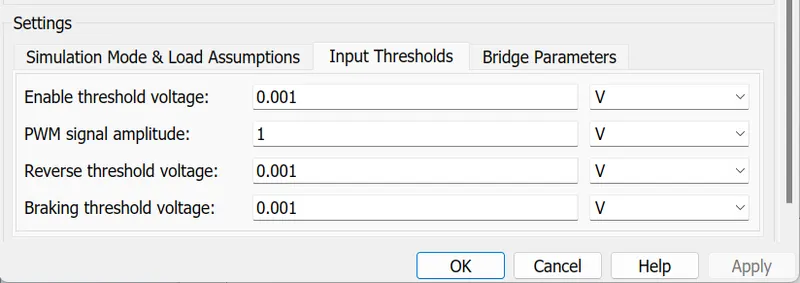
This port is directly connected to the motor that has to be controller. There is also a REV port.When the reverse threshold voltage is lower than the REV port voltage,the polariy of the motor is reversed, and if the BRK port voltage is greater than the value of breaking threshold voltage, it indicates that the vehicle is in braking condition.
The following image shows the H-Bridge Motor Driver block from Powertrain block set.
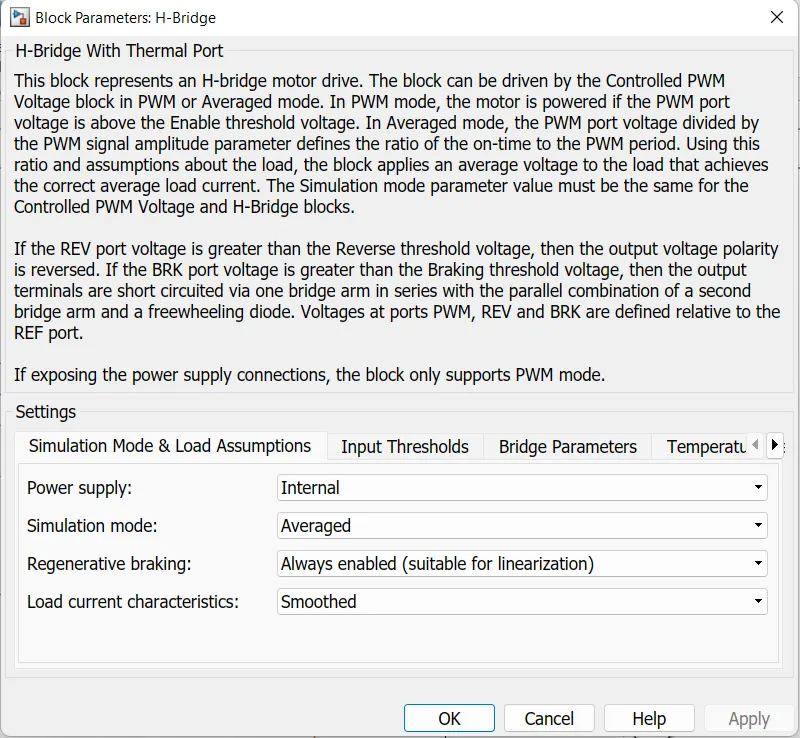
I Have changed the Input Thresholds as per our requirements
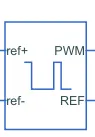
2) Controlled PWM Voltage Source
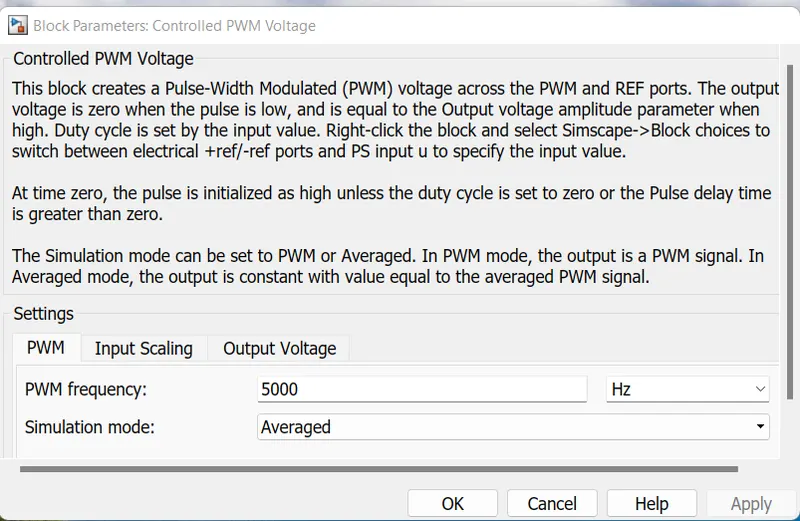
The PWM signal is used or controlling the speed of the traction motor. This block is used for providing a controlled PWM voltage output.
The Duty cycle is given by,
100*(Vref-Vmin/Vmax-Vmin)
Where,
Vref - is the reference voltage across the ref+ and ref- ports.
Vmin - denotes the minimum reference voltage.
Vmax - denotes the minimum reference voltage.
The following image shows the Controlled PWM Voltage Source block from Powertrain blockset.
3) Temperature sensor
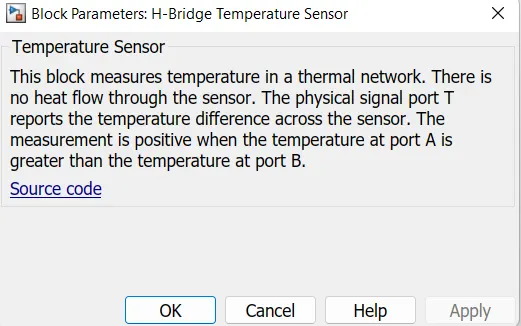
This block and its parameters are shown below, this block measure temperature in a thermal network. There is no heat flow through the sensor.

4). Current Sensor
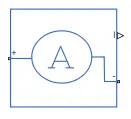
This block is used to measure the flow current through of circuit.
5). Controlled voltage Source
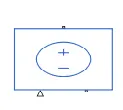
The controlled voltage source block is used to give a constant voltage output. It has two electrical conserving ports and a physical signal port. The output from the controlled voltage source is fed to the controlled PWM voltage source.
3-> Subsystem contains the Battery pack
The following image shows the Battery Pack Subsystem
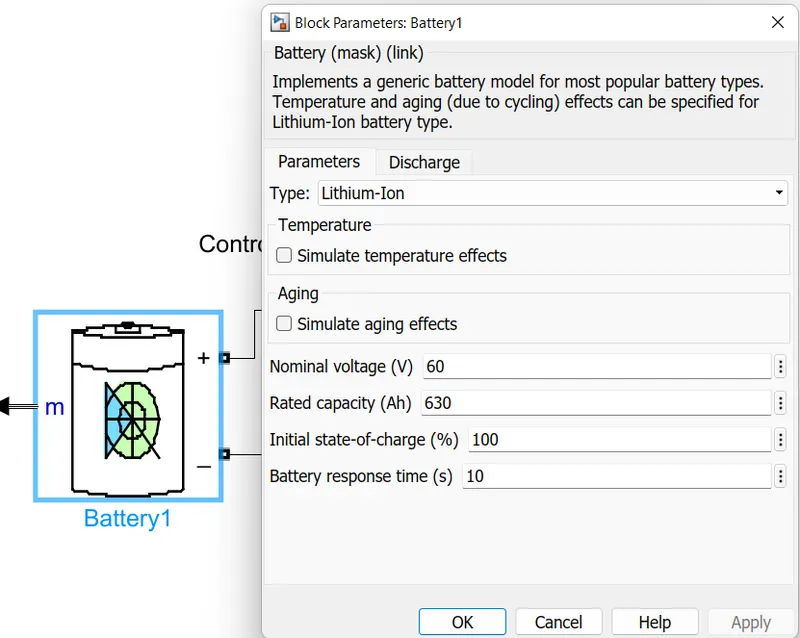
Lithium-ion battery is used for this model with a nominal voltage of 60V. The SOC of the battery reduces as the vehicle starts.
The power controller provides the input cuurent to the battery while charging. The SOC, current and Voltage are the parameters of the battery.
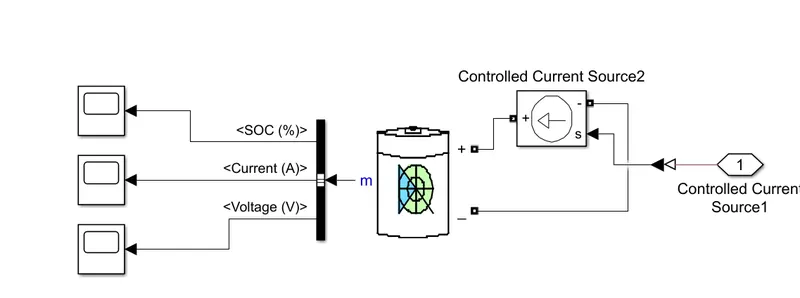
Subsystem Parameters are explained below.
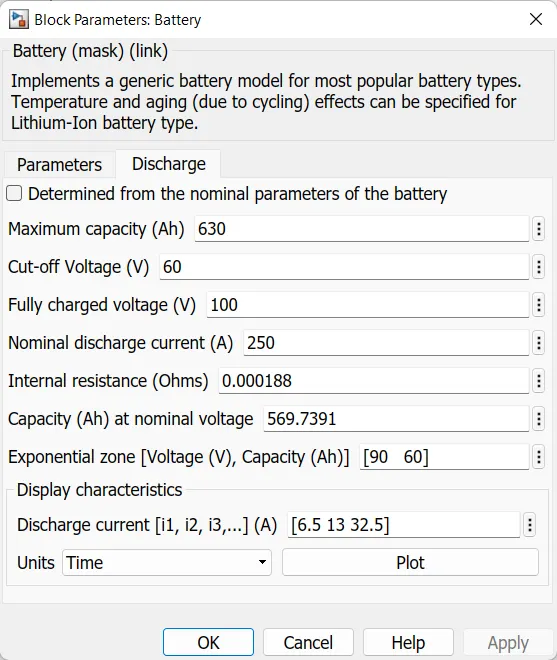
1. Li-ion Battery:
The Battery block implements a generic dynamic model that represent most popular types of rechargeable batteries.
The following image shows the Li-ion Battery block from powertrain blockset.
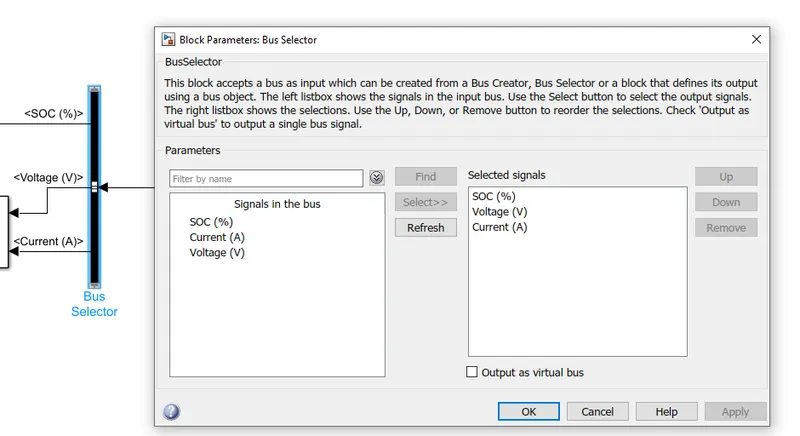
2) Bus Selector:
This block accept a bus as input which can be created from Bus creator, Bus selector. from the m port of the battery block , we get SOC,ampere and voltage values. These values are extracted using bus selector , which when connected to the m port , will show those values as shown below,
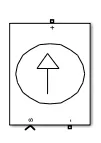
3) Current Controlled Source:
The Controlled Current Source block converts th Simulink input signal into an equvivalent current source The generated current is driven by the input signal of the block.
The following image shows the Current Controlled Source block from Powertrain blockset.
4-> Subsystem contains the SOC(State of Charge)
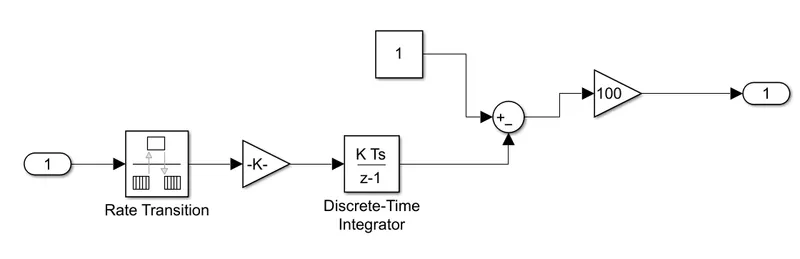
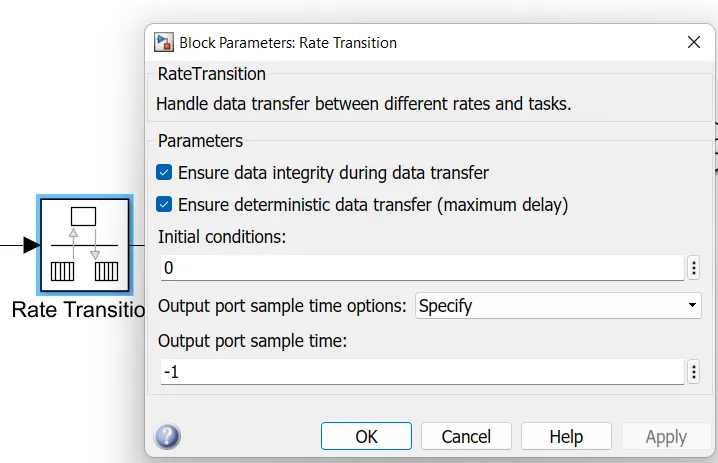
1) Rate transition
Rate transition handles data transfer between different rates and tasks. The SOC of the battery reduces as the vehicle starts and increase when the charger is connected.
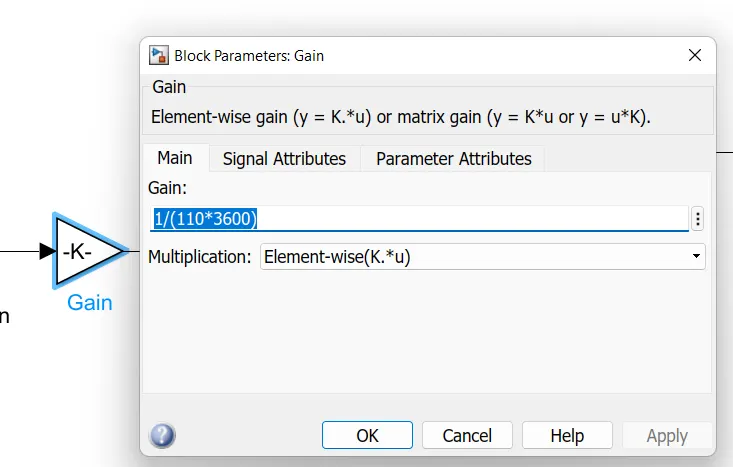
2) Gain
5-> Subsystem contains the Motor and Gear System
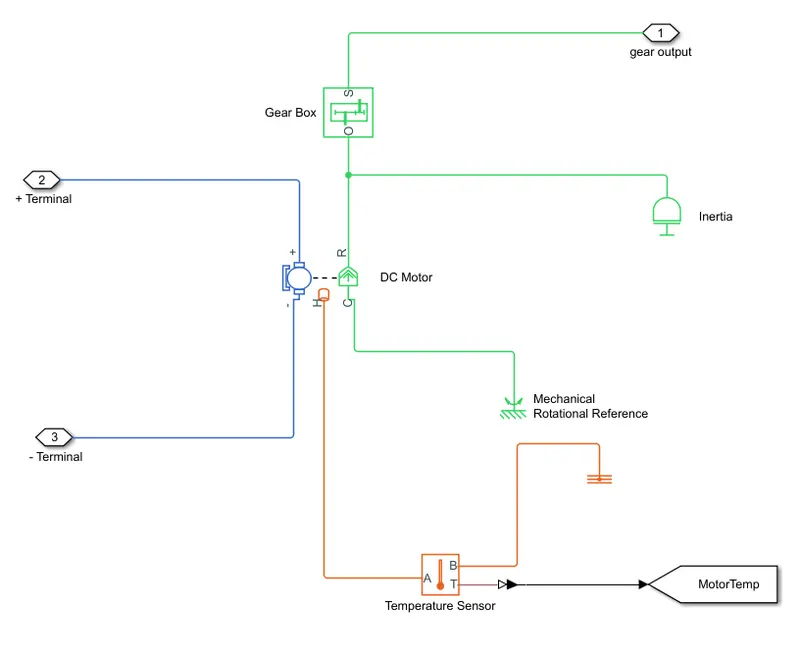
Subsystem Parameters are explained below.
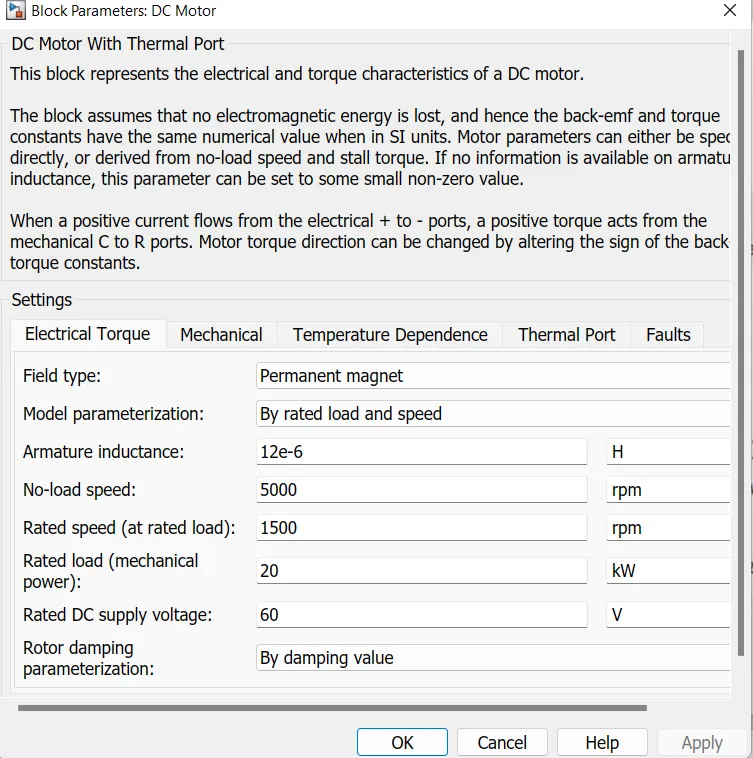
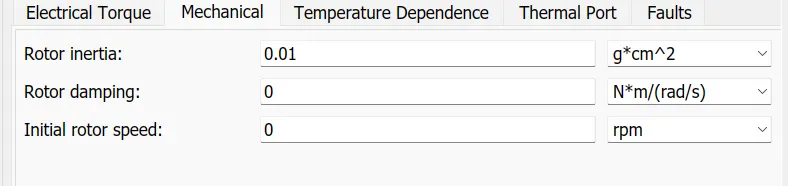
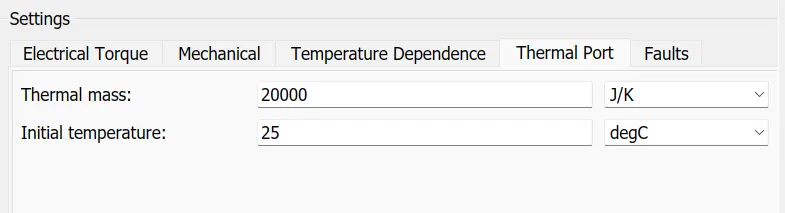
1. DC Motor
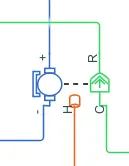
The Motor will take controller power from the battery and convert electrical energy to mechanical energy. Different types of motors can be used to drive the wheels. so we using the DC motor. The purpose of the dc motor in electric vehicle is to drive the tires/wheels.The one side of the DC motor block is connected to the vehicle body blocks, and the other side is connected to DC motor driver, which controls and rotates the motor.
The following image shows the DC motor block from Powertrain block set.

6-> Subsystem contains the Vehicle Dynamics
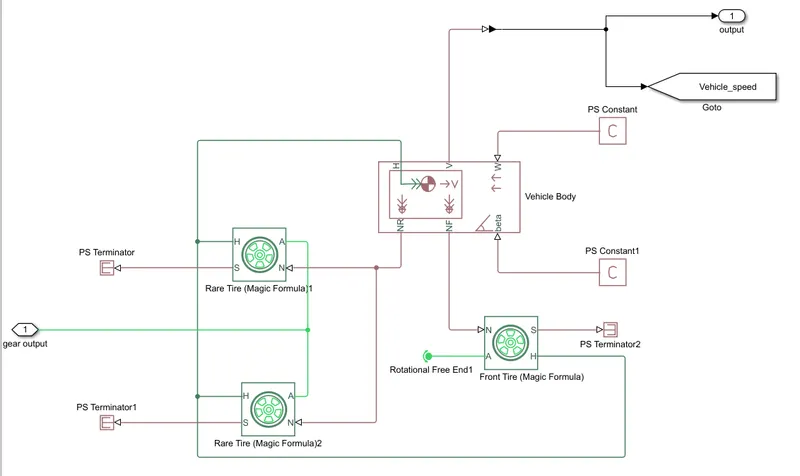
Below we can see the model of vehicle body. The Ev model is the combination of both Electrical and Mechanical parts. The mechanical parts in the system include tires, vehicle body, transmission(simple) gears, differential, and the motor. The tires and the vehicle body are formed into a subsystem to separatre the mechanical component from that of electrical components. We can change the block parameters as per our requirements.
The image of the subsystem is attached below.
Subsystem blocks are explained below:
1. Vehicle Body:
These is the block of vehicle body which represents a dual axel vehicle or a 4 wheeer. There are 6 ports.
The following image shows the Vehicle body block from Powertrain block set.
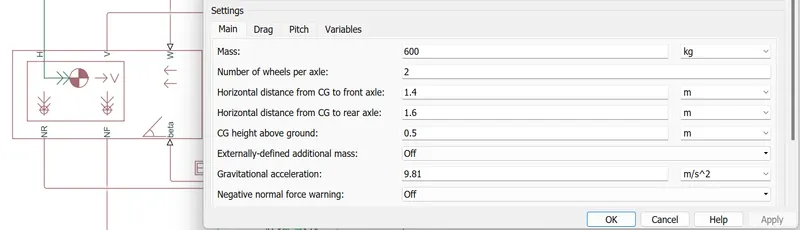
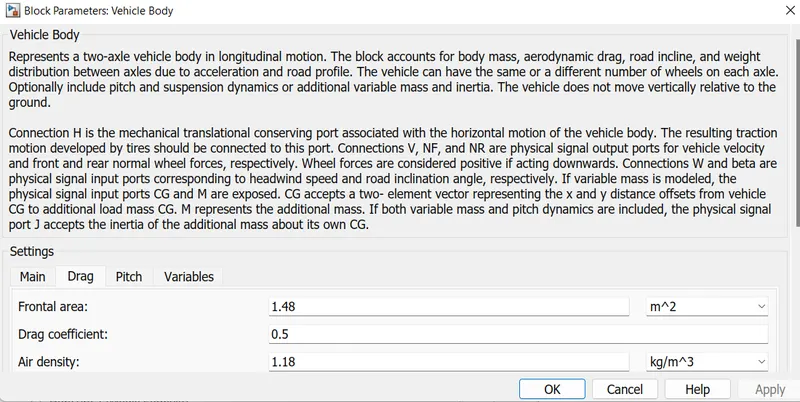
The Ports W and beta are physical signal input ports which are for wind speed and inclination of road respectively.
Connections to V, NF, and NR are physical signal output ports for the velocity of the vehicle.
Front axel and Rear axel it is a normal forces and the H is for Horizontal motion and the tie is connected to this port.
2. Tire (Magic Formula)
We have selected the tire(Magic Formula).
The following image shows the Tire block from Powertrain block set.
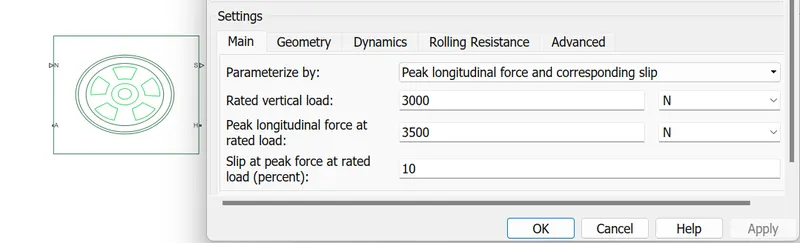
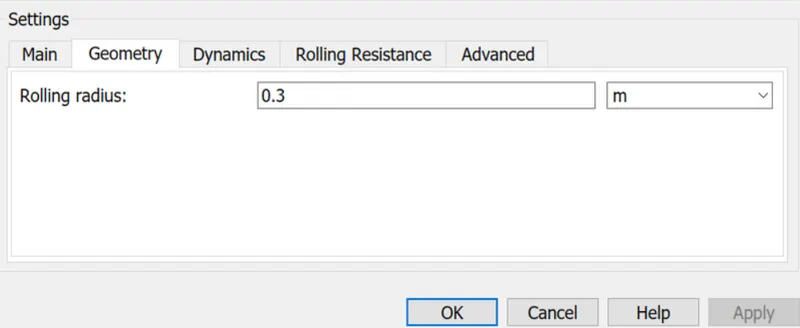
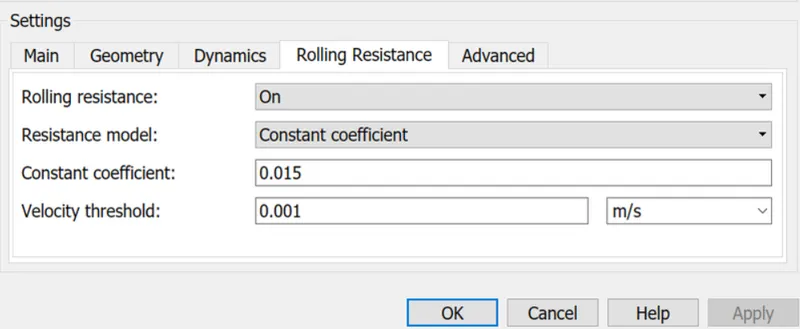
There are two connection ports.
connection N - is a physical signal input portthat applies the normal force acting on tire.
connection S - is a physical signal output port that reports the tire slip.
There are two conserving ports:
Connection A - Represent axel on which the tire are mounted.
Connection H - Represent wheel hub which transmits thrust generated by the wheel to the body of the vehicle.
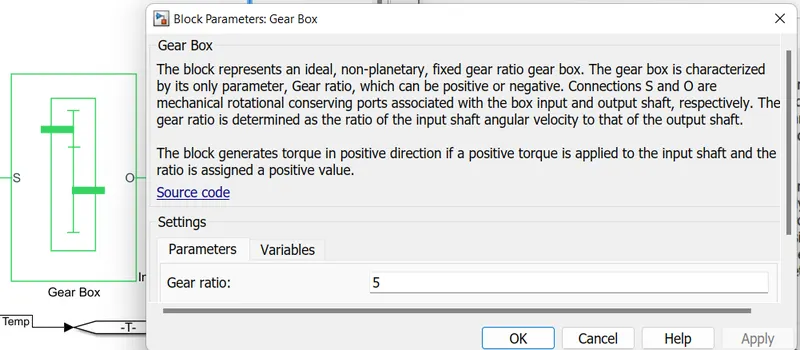
3. Simple Gear:
This block is used for giving a fixed gear ratio. This is a mechanical component and can be avoided, but it ives users the ability to adjust vehicle speed with respect to the rpm of the motor.
The following image shows the Simple gear Powertrain block set.
Drive Input :
The block is capable of taking feedback velocity of the ehicle and changing the speed by giving output signal, it can decide when the vehicle needs to be accelerated and when the break need to be applied.
1. Drive Cycle Source
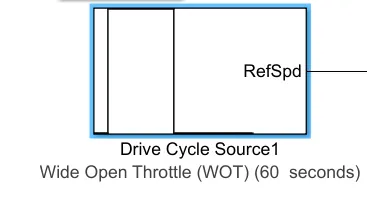
The Drive cycle source block is used to provide the refernence Speed of the simulation.
The following image shows the Drive Cycle Source block from Powertrain blockset.
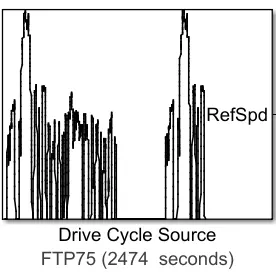
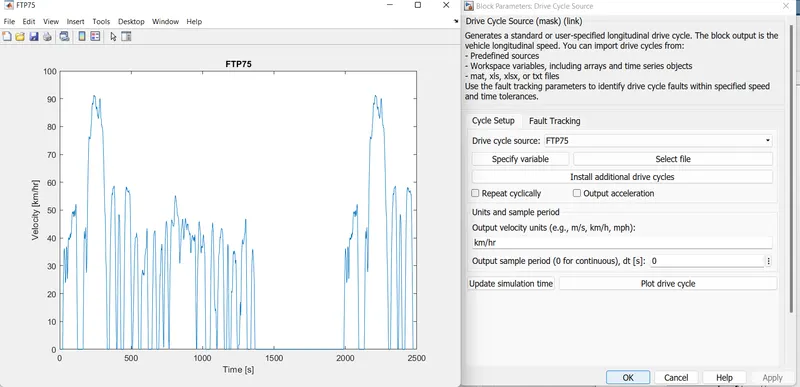
There are many Drive cycle sources as well as we can generate our own signal by using signal builder. So I used the FTP75 Drive Cycle Source block to create the Drive input.
(2) WOT Drive Cycle:
With the same drive cycle source block, the Wide Open Throttle or WOT is chosen instead of the FTP75 drive cycle.
In electronic control, the feedback between the factors can be finessed and exploited in countless ways, even to the extent that in drive-by-wire systems the operator's input (which is pedal position) is a completely separate concern from throttle position itself, and the computer constantly makes new decisions about how the two should be correlated when the state of the engine running changes from second to second. In the carburetion era, carbs had jets and fuel circuits arranged with a certain logic to overcome the transient differences between throttle position changes and their resultant effects on the engine's running (for example, jets to prevent hesitation). The parameters are given below for the same:
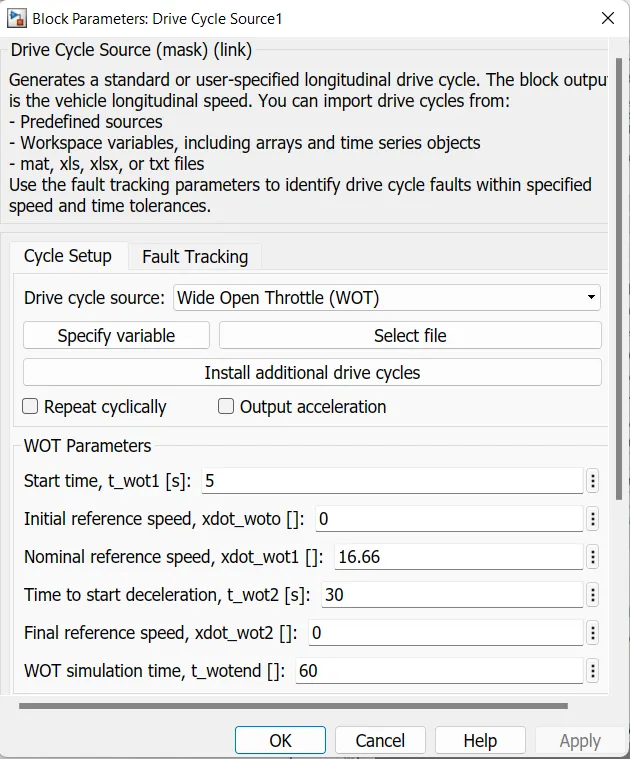
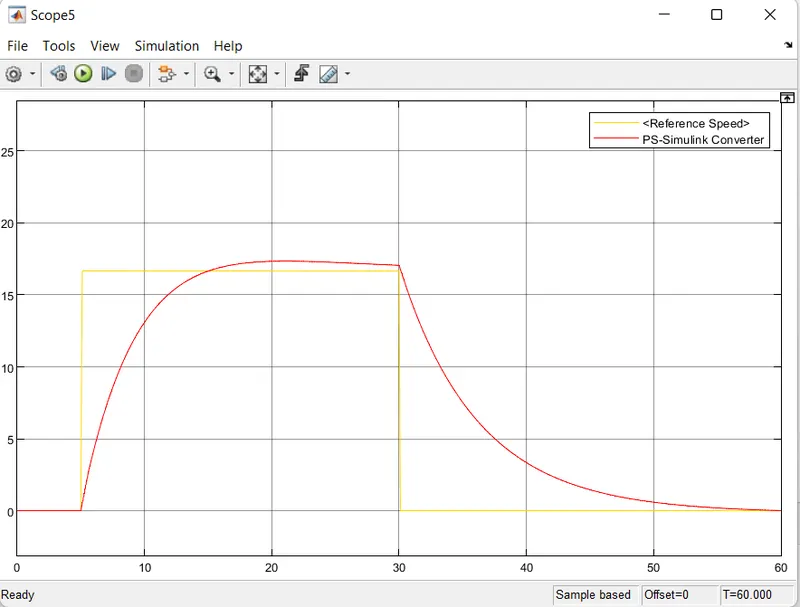
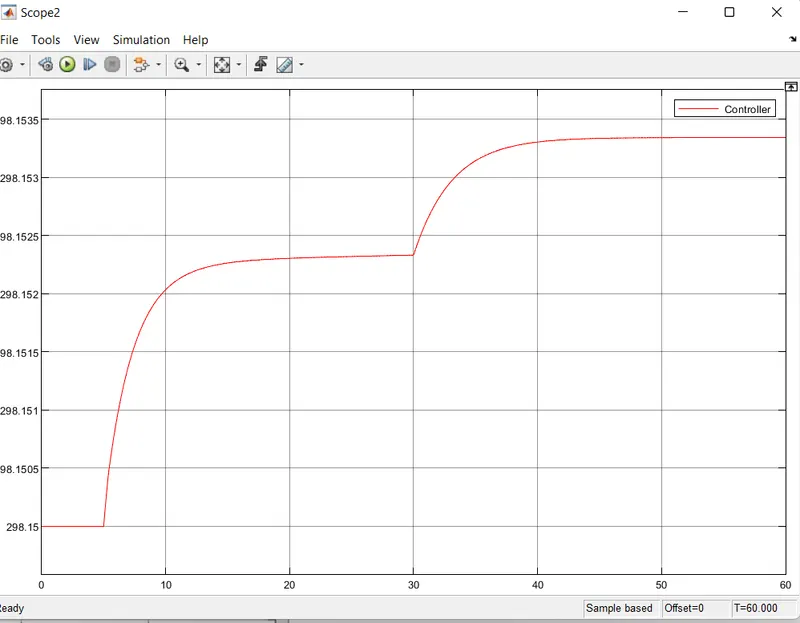
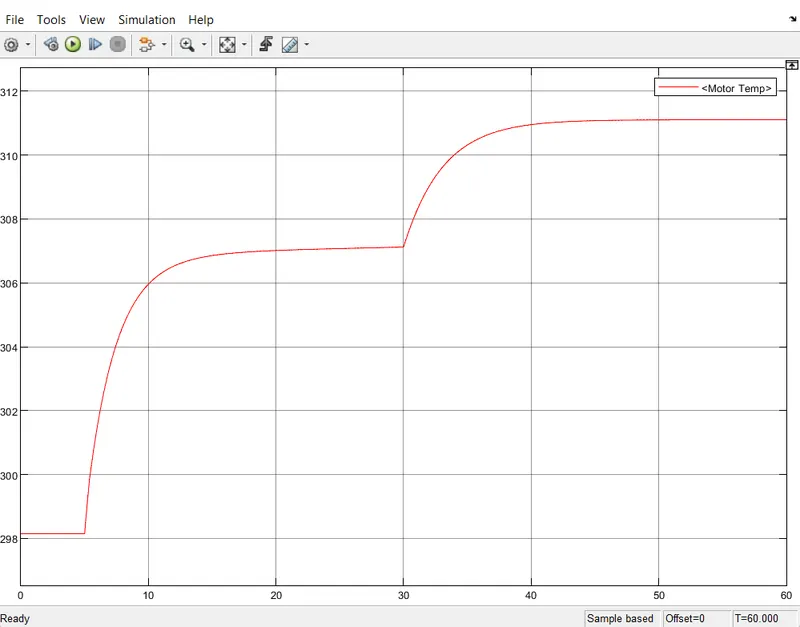
As it is clear from the parameters that the throttle or accelerator of the vehicle is pressed fully between 5-30 seconds time window.
(3) 45 Kmph for 100 Kms Drive Cycle:
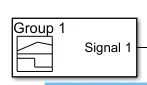
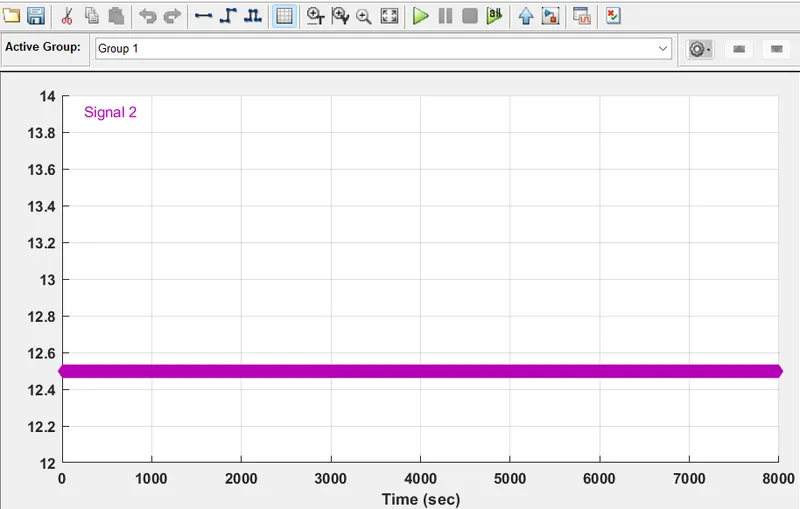
As per the problem statement, a customized drive cycle is made where the vehicle will run with a constant speed of 45 Km/hr and will cover a distance of 100 km approx. The same is implemented by using a signal builder block.
The second drive cycle used is Wide Open Throttle . this particular drive cycle is used to run the vehicle for 100Km at constant 45Kmph.
The parameters for this block is calculated as follows,
Time taken to cover 100Kms at constant 45 Kmph can be found as shown below,
Time = Distance / Speed
Time = 100 /(45/3600) to convert 45Kmph to Km/s we have divided it by 3600
= 8000s
Now the block parameters for this block is given as shown below,
4. Testing and simulation
After designing the circuit, all thet is left is testing the circuit. We usually need to put scope at any point in the circuit to measure the desired parameters. The scope module looks like the one shown below.
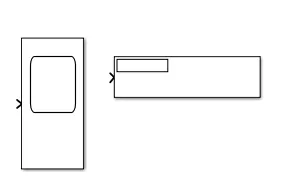
The scope can have multiple inputs, and the real time output is displayed when the simulation.
RESULT:
Drive Cycles:
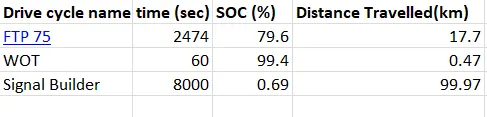
The model is made to run at 3 different drive cycles: FTP75, WOT and 45kmph for 100km drive cycles.
1. FTP75
First, with the aid of the Drive Cycle source FTP75. Each drive cycle has its own time duration.So the Drive Cycle source FTP75 has time duration is 2474 seconds.
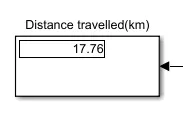
1. Distance travelled
The distance travelled by the vehicle is 17.76km
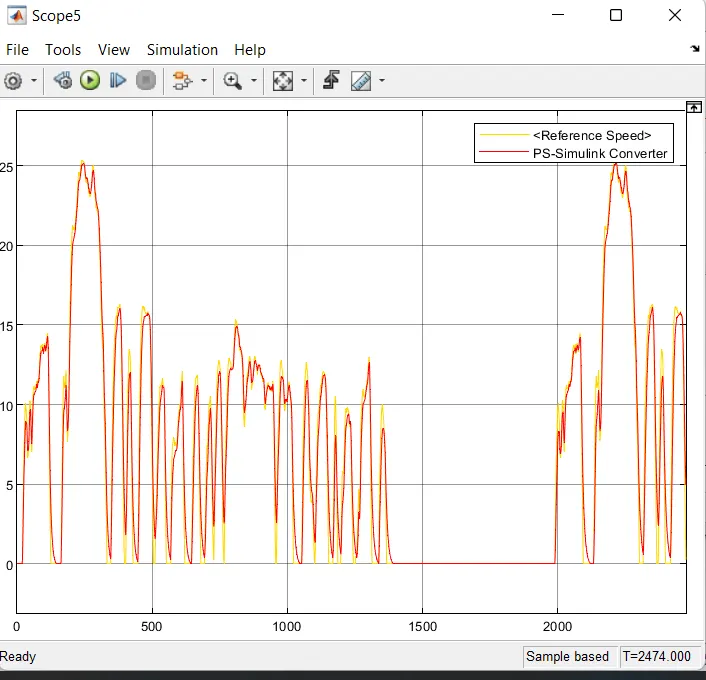
2. The plot for input speed and actual speed of vehicle:
Below the image shows the how the velocity of the vehicle actual speed is following the reference speed of the input drive cycle.
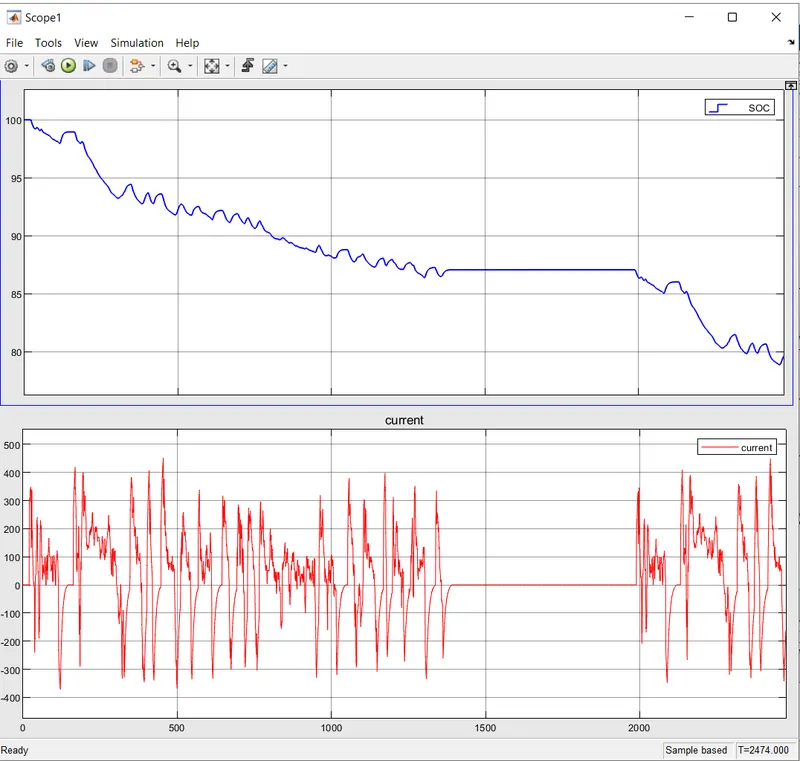
3. SOC
The graph of the SOC percentage.
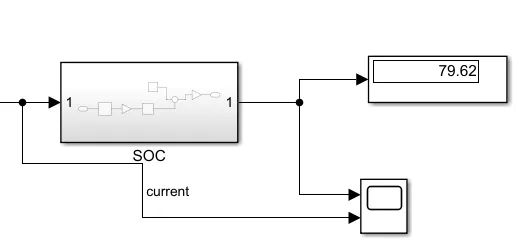
The SOC of vehicle after running for 2474 seconds the battery has changed intermittently from 100% to 79%. During this vehicle has travelled for 17.76 Km. Trend is decreasing but during some time it is increasing. The SOC increases beacause Regenerative breaking.
The SOC is dropped from 100% to 79%.
4. Temperature:
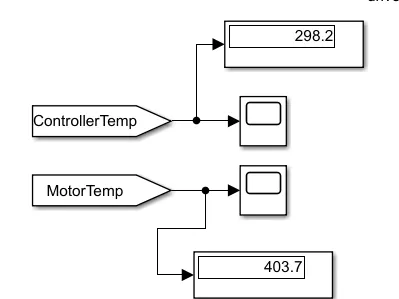
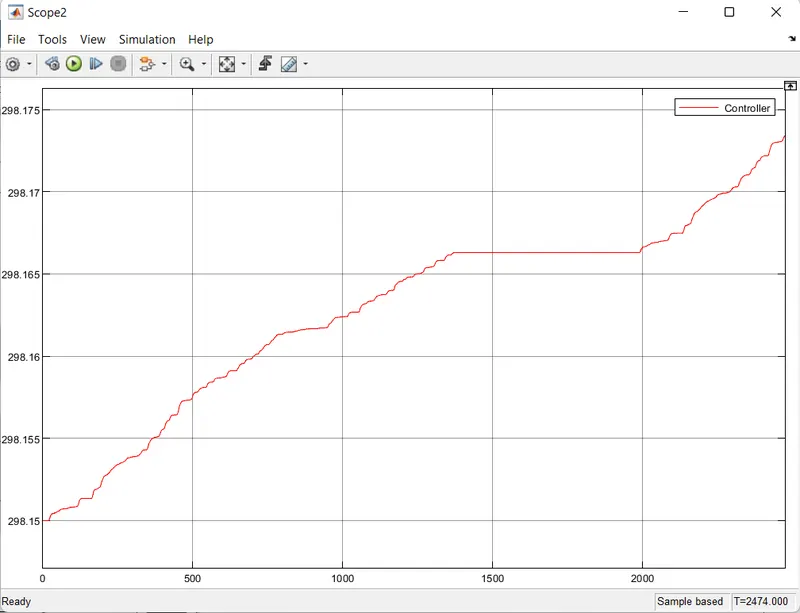
Controller Temperature:
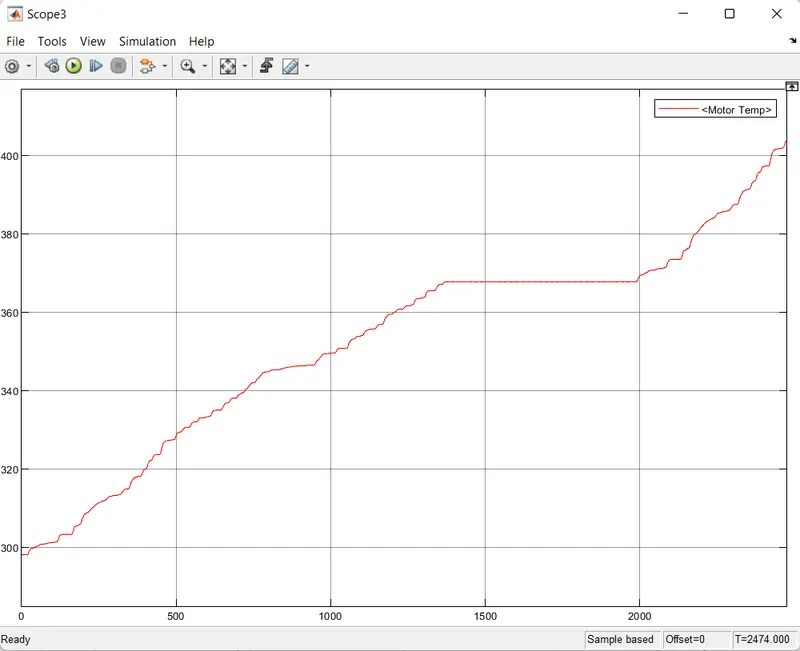
Motor Temperature:
2. WOT Drive source:
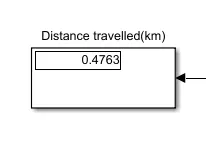
1. Distance travelled
The distance travelled by the vehicle is 0.47km at the end of drive cycle.
2.The plot for input speed and actual speed of vehicle:
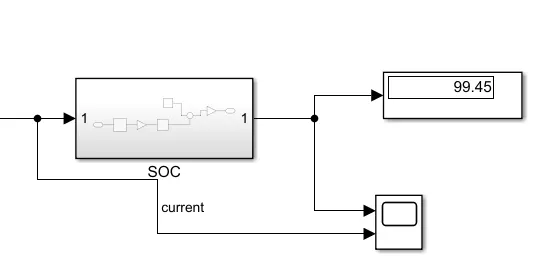
3. SOC
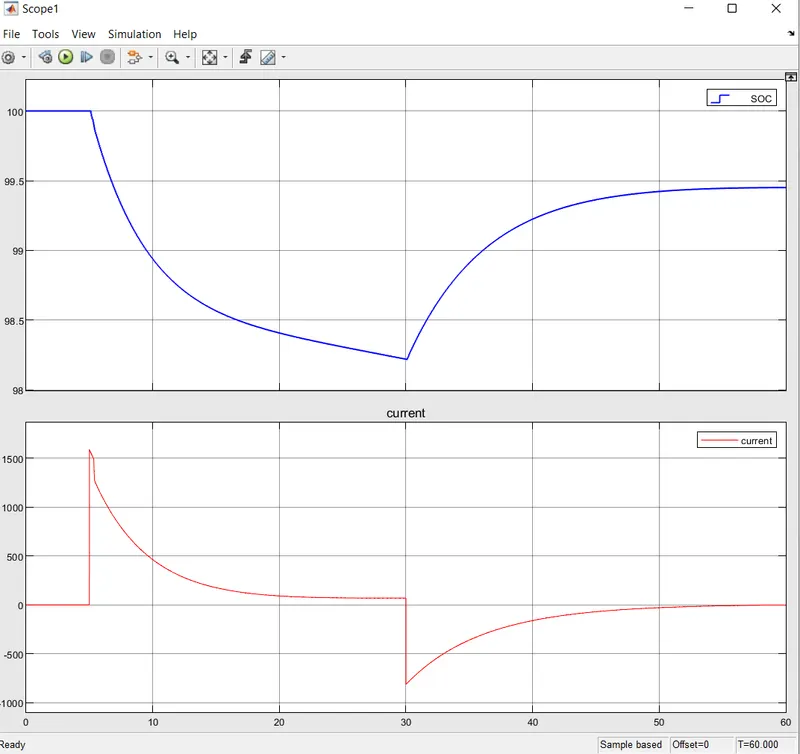
The graph of the SOC percentage.
The SOC of vehicle after running for 2474 seconds the battery has changed intermittently from 100% to 99.4%. During this vehicle has travelled for 0.47Km. Trend is decreasing but during some time it is increasing. The SOC increases beacause Regenerative breaking.
The SOC is dropped from 100% to 99.4 %
4. Temperature:
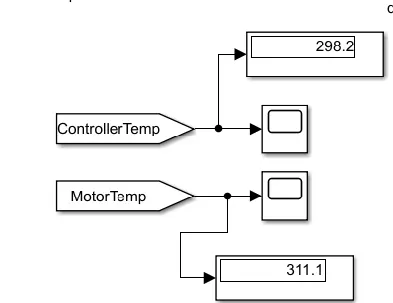
Conroller Temperature:
Motor Temperature:
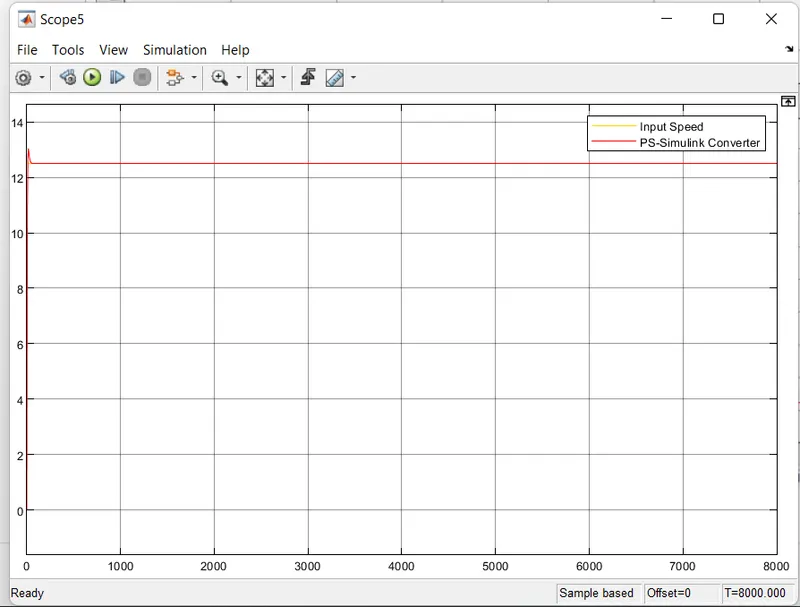
3. Signal Builder
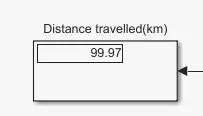
1. Distance Travelled
The distance travelled by the vehicle is 99.97km
2. The plot for input speed and actual speed of vehicle:
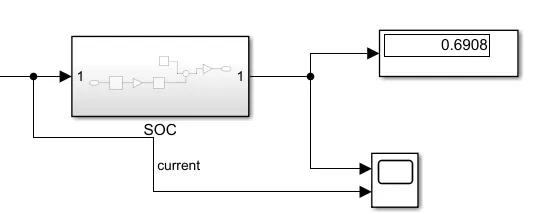
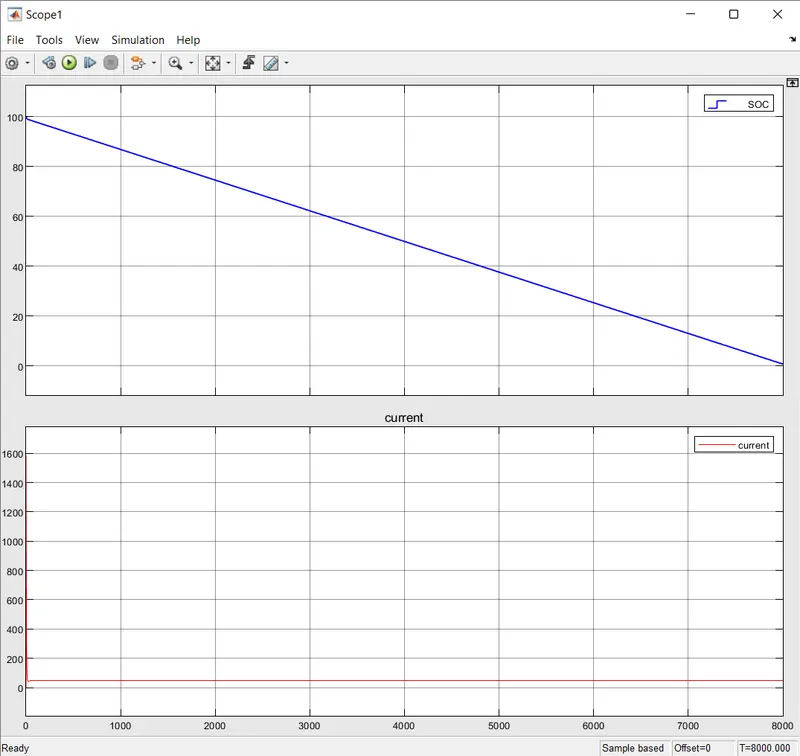
3. SOC
The SOC is dropped from 100% to 0.69%.
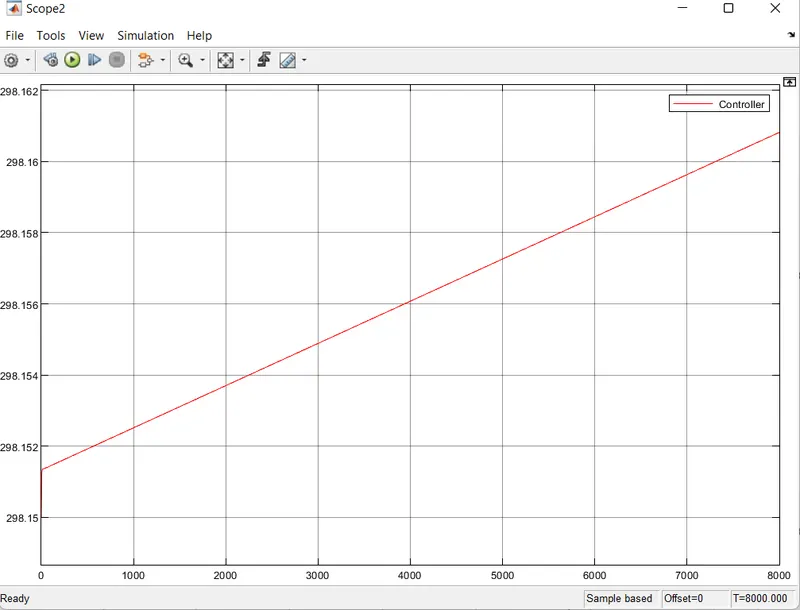
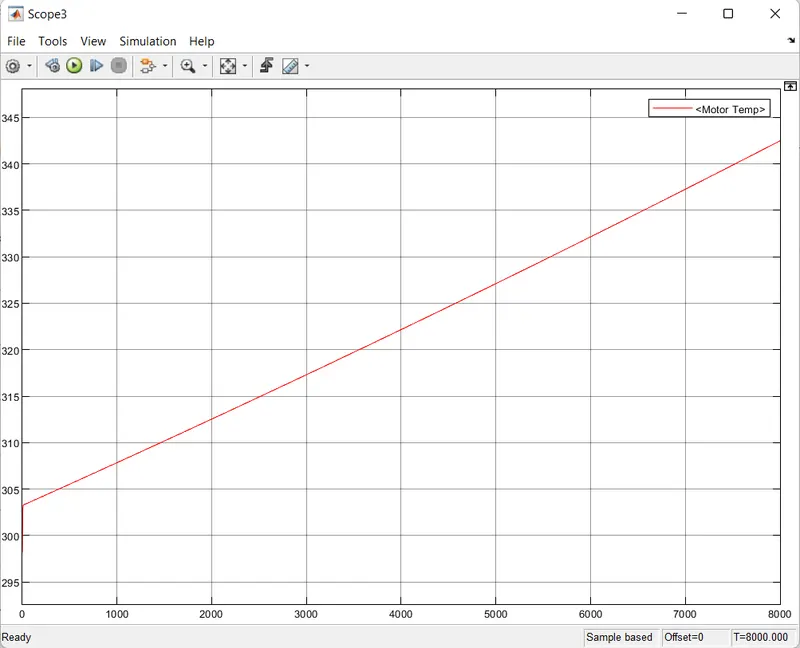
4. Temperature:
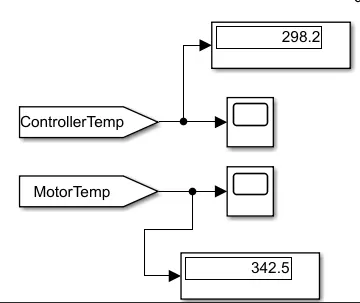
Conroller Temperature:
Motor Temperature:
Conclusion:
The Matlab model of an Electric rickshaw has been successfully made by choosing Suitable blocks from powertrain block set. We understand how to make the model of Electric rickshaw by using powertrain blockset.
So we conclude that the Vehicle speed and reference drive cycle were plotted. The SOC State was observed for the entire duration. as well as we observed the total distance travelled by the vehicle.