Final Project: Electric Rickshaw modelling
AIM
To create a MATLAB model of electric rickshaw which uses a Li-Ion battery and a PM brushed type motor.
OBJECTIVE
To model an electric rickshaw in MATLAB and for any three standard driving cycles show energy consumption, temperature rise of motor and controller for 100 km constant speed driving at 45 kmph.
DESIGN SPECIFICATIONS
To model the Electric Rickshaw, we have to figure out certain parameters like, Power, Energy, Range, Motor Rating, Battery Capacity etc. For Vehicle dimension data, let’s refer Mahindra Treo E-Ricksahw Specifications which is given below.
Mahindra Treo E-Ricksahw Specifications
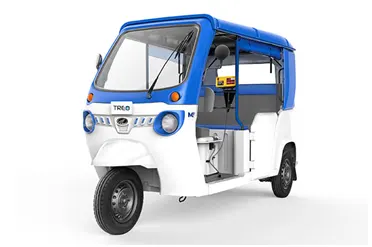
Figure 1: Mahindra Treo –SFT
Mahindra Treo is one of the best E-Rickshaw available in the market which is powered with Li-Ion battery and gives best mileage and performance.
To model, E-Rickshaw, let’s check the specifications of Mahindra Treo.
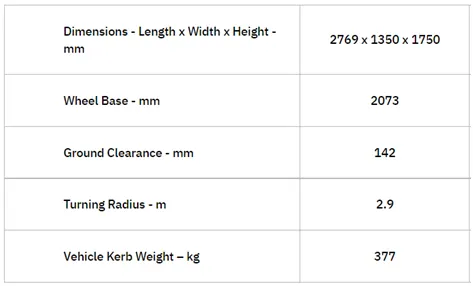
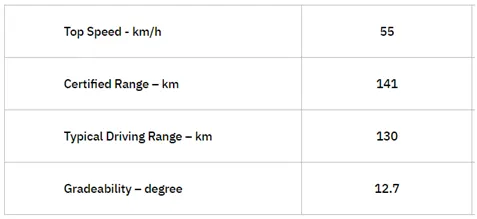
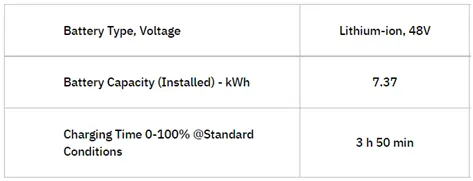
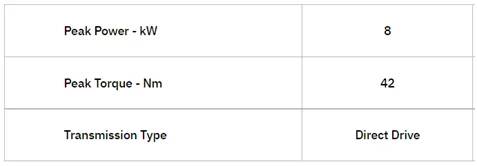
Table 1: Mahindra Treo – SFT Specifications
Drive cycle
Since we have to analyze the motor performance with three different drive cycles, let’s choose the suitable drive cycle for it. Since Auto rikshaw is a low power density vehicle, we have to choose drive cycles accordingly.
- WLTP Class 1 Drive Cycle
The WLTP procedure (world harmonized light-duty vehicles test procedure) is a harmonized standard for determining the levels of pollutants, CO2 emissions and fuel consumption of traditional and hybrid cars, as well as the range of fully electric vehicles.
The WLTP procedure relies on the new driving cycles (WLTC – Worldwide harmonized Light-duty vehicles Test Cycles) to measure the mean fuel consumption, the CO2 emissions as well as the emissions of pollutants by passenger cars and light commercial vehicles.
The test procedure WLTP (Worldwide harmonized Light vehicles Test Procedure) contains several driving cycles:
- Class 1 – low power vehicles with PWr <= 22
- Class 2 – vehicles with 22 < PWr <= 34
- Class 3 – high-power vehicles with PWr > 34
Where PWr [kW/Tonne] is the power-to-weight ratio, defined as the ratio between the rated engine power and kerb weight.
PWr=Pmax/mv
Since we are modeling TATA Nexon EV, Let’s take parameters from Table 1.
Pmax = 8kW , Kerb Weight = 0.7 Tonnes
PWr= 8/0.7 = 11.42
Since the vehicle’s PWr is less than 22, we are going to use the WLTC Class 1 driving cycle to calculate the energy consumption.
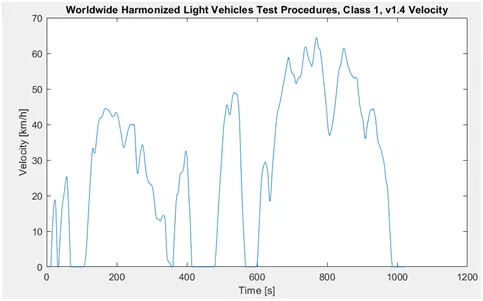
Figure 2: WLTP Class 1 Drive cycle
2. Extra-urban driving Cycle
The Extra-Urban Driving Cycle EUDC, has been designed to represent more aggressive, high speed driving modes. The maximum speed of the EUDC cycle is 120 km/h; low-powered vehicles are limited to 90 km/h.
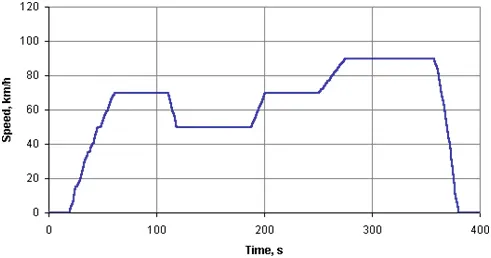
Figure 3: EUDC Drive cycle
3. 100 km distance with constant 45km/h velocity
Since we have to analyse the motor temperature and battery performance when the vehicle is running at a constant velocity of 45kmph for 100km, we have to make a drive cycle with 45km/h velocity on Y- axis and time taken to cover 100km in seconds is, T = (100 / 45) * 3600 = 8000sec.
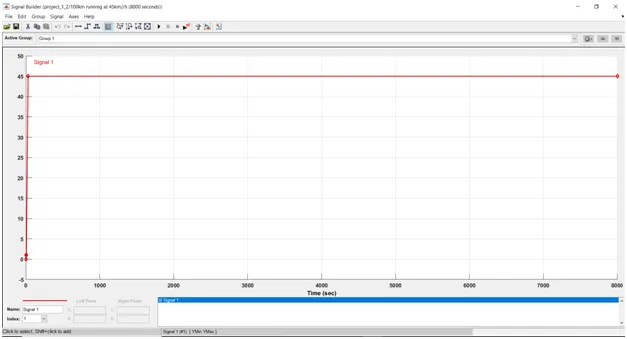
Figure 4: 100km distance with constant velocity of 45kmph made in signal builder
PM DC Motor
From table1, we can understand the following parameters of motor used.
Voltage – 48V
Peak Power – 8kW
Peak Torque – 42 Nm
From PMDC motor datasheet which is used in EVs, we got the values of following parameters.
Voltage:48V
Rated Power:8KW
Efficeincy: 91%
Phase Resistance (Milliohm): 3.1/48V
Phase Induction(100KHZ): 34uH/48V
Speed: 3855rpm at 8kW
Weight:17Kg(air),17.7kg(water); Casing: Aluminium
Length (height): 170mm Diameter: 206mm
Keyway size: 6.4mm(W) x 45mm(L) x 21.7mm(D:25.4mm
Li-Ion Battery Pack
From Table 1, we get the following battery parameters.
Battery Voltage = 48V
Power = 7.37kWh
Battery Capacity = 7.37*1000 / 48 = 153.54 Ah
SIMULINK MODELLING OF ELECTRIC RICKSHAW
The complete model of Electric Rickshaw is shown in figure 5. The drive cycle can be selected from multi port switch. Longitudinal driver will generate acceleration and brake commands which vary from 0-1 based on reference velocity and velocity feedback. Based on Accel and Brake commands, PWM generator will generate PWM signals to control the H-Bridge. Thermal port of H-bridge is used to measure temperature while operation. H-Bridge is connected to motor and battery pack through a controlled current source. Thermal port of motor is used to measure temperature while operation. Inside the vehicle subsystem, there is gear, tires, and vehicle body. The vehicle velocity is fed back to longitudinal driver.
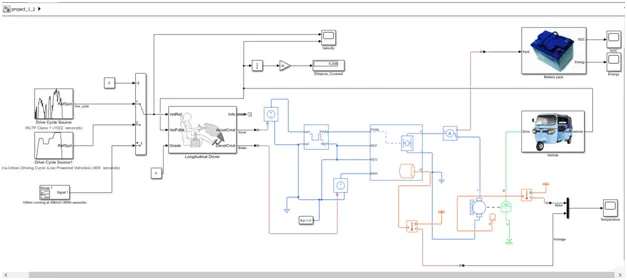
Figure 5: Electric Rickshaw Model
Each component to model this is given below.
- Longitudinal Driver
The Library to access Longitudinal Driver is given below.
Library: Powertrain Blockset / Vehicle Scenario Builder
Vehicle Dynamics Blockset / Vehicle Scenarios / Driver
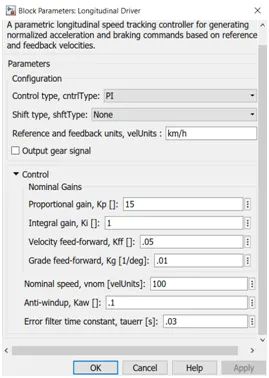
Figure 6: Longitudinal Driver parameters
The control parameters are kept same as shown above.
- Pulse-width modulated voltage source
The Library to access PWM source is given below.
Library:
Simscape / Electrical / Integrated Circuits
This block will generate PWM signals according to the reference signal given to it.
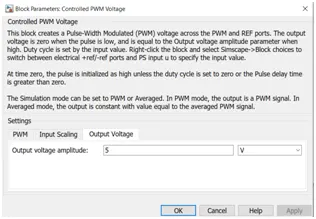
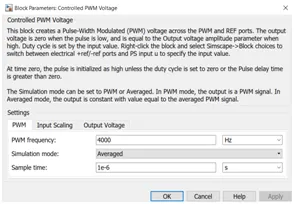
Figure 7: Controlled PWM voltage parameters
The PWM frequency is given as 4000Hz as shown below. The Output voltage of the PWM is set as 5V. The Input is coming from longitudinal driver Accel and Decel ports, and it will vary from 0 to1. Those signals are converted to equivalent voltages using controlled voltage source block.
- H-Bridge
The library to access H-Bridge is given below.
Library:
Simscape / Electrical / Semiconductors & Converters / Converters
The H-bridge can control the DC motor according to the PWM signals given to it. It can take supply from external power supply or internal one. Here I’ve choose internal power supply.
The H-Bridge block represents an H-bridge motor driver. The block has the following two Simulation mode options:
PWM — The H-Bridge block output is a controlled voltage that depends on the input signal at the PWM port.
Averaged — This mode has two Load current characteristics options:
Smoothed
Unsmoothed or discontinuous
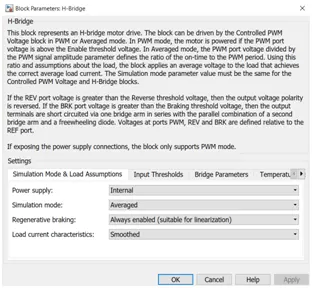
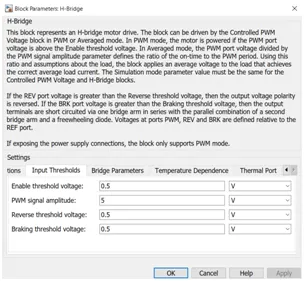
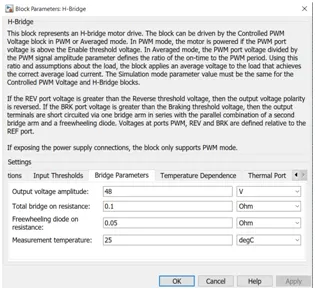
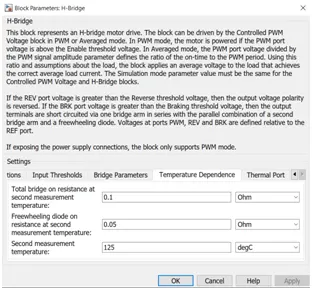
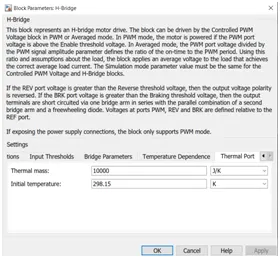
Figure 8: H-bridge parameters
The PWM signal amplitude is same as that of given in PWM Source. The output voltage is same for motor rated voltage and battery. Since the thermal port is enabled to measure temperature, we have to add Temperature dependence and thermal port values as shown above.
- DC Motor
The library to access DC Motor is shown below.
Library: Simscape / Electrical / Electromechanical / Brushed Motors
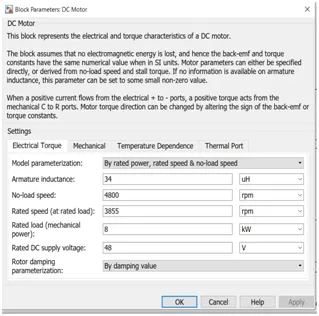
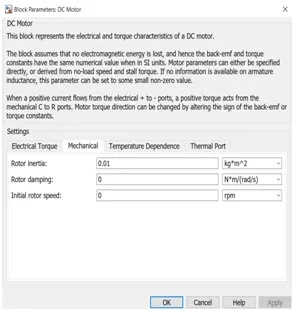
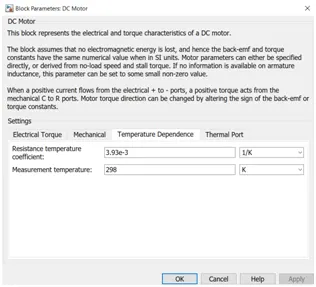
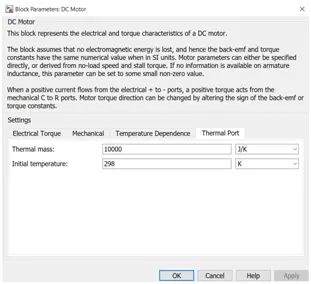
Figure 9: DC Motor Parameters
The DC motor parameters are given from the datasheet. Initial temperature is given as room temperature and Thermal port values were also given.
- Battery Subsystem
The battery subsystem consists of battery block, controlled current source and mathematical blocks to calculate energy consumed.
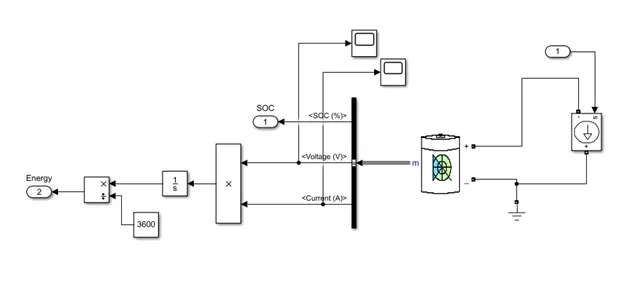
Figure 10: Battery Subsystem
- Battery
The battery model can be accessed from the following library.
Library: Simscape / Electrical / Sources
The Battery block represents a simple battery model. The block has four modeling variants, accessible by right-clicking the block in your block diagram and then selecting the appropriate option from the context menu, under Simscape > Block choices:
Uninstrumented | No thermal port — Basic model that does not output battery charge level or simulate thermal effects. This modeling variant is the default.
Uninstrumented | Show thermal port — Model with exposed thermal port. This model does not measure internal charge level of the battery.
Instrumented | No thermal port — Model with exposed charge output port. This model does not simulate thermal effects.
Instrumented | Show thermal port — Model that lets you measure internal charge level of the battery and simulate thermal effects. Both the thermal port and the charge output port are exposed.
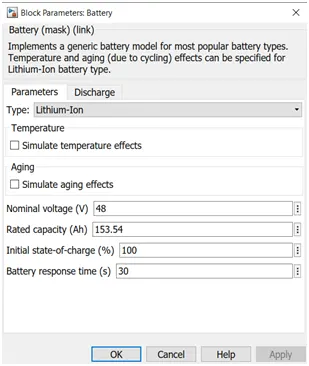
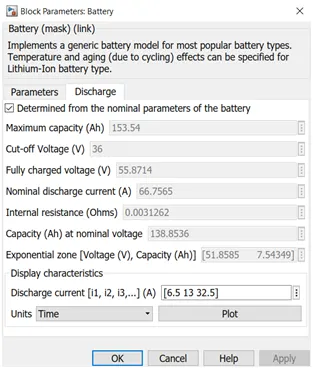
Figure 11: Battery Parameters
The battery type, nominal voltage, capacity, Initial SOC and response time are entered as shown above.
- Vehicle Subsystem
The vehicle model subsystem consists of the following blocks.
- Vehicle body
- Tire
- Gear
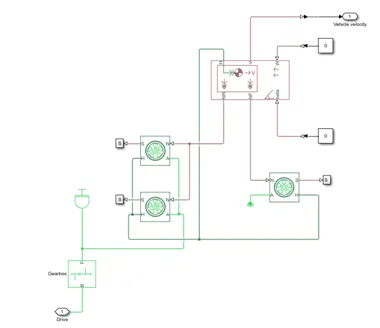
Figure 12: Vehicle Subsystem
- Gear
Simple gear of base and follower wheels with adjustable gear ratio, friction losses, and triggered faults. It can be accessed from the following library.
Library: Simscape / Driveline / Gears
The Simple Gear block represents a gearbox that constrains the connected driveline axes of the base gear, B, and the follower gear, F, to co rotate with a fixed ratio that we specify. We can choose whether the follower axis rotates in the same or opposite direction as the base axis. If they rotate in the same direction, the angular velocity of the follower, ωF, and the angular velocity of the base, ωB have the same sign. If they rotate in opposite directions, ωF and ωB have opposite signs.
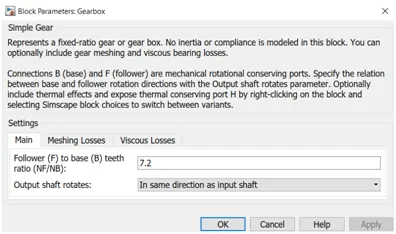
Figure 13: Simple Gear Parameters
The gear ratio has been selected using trial and error method.
- Tire
Tire with longitudinal behaviour given by Magic Formula coefficients.
Library:
Simscape / Driveline / Tires & Vehicles
The Tire (Magic Formula) block models a tire with longitudinal behaviour given by the Magic Formula, an empirical equation based on four fitting coefficients. The block can model tire dynamics under constant or variable pavement conditions.
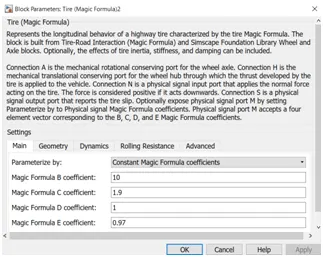
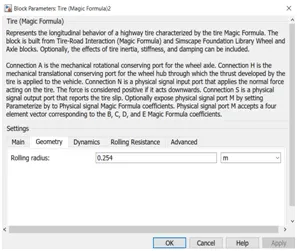
Figure 14: Tire Parameters
In order to reduce complexity, we can select constant magic formula coefficients for simulation.
- Vehicle Body
Two-axle vehicle with longitudinal dynamics and motion and adjustable mass, geometry, and drag properties.
Library: Simscape / Driveline / Tires & Vehicles
The Vehicle Body block represents a two-axle vehicle body in longitudinal motion. The vehicle can have the same or a different number of wheels on each axle. The vehicle wheels are assumed identical in size. The vehicle can also have a center of gravity (CG) that is at or below the plane of travel.
The block accounts for body mass, aerodynamic drag, road incline, and weight distribution between axles due to acceleration and road profile. Optionally include pitch and suspension dynamics. The vehicle does not move vertically relative to the ground.
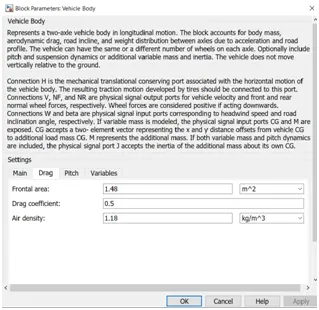
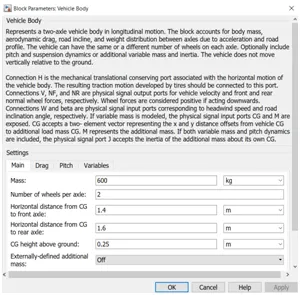
Figure 15: Vehicle Body Parameters
The parameters of the vehicle body were entered from the specification of Mahindra Treo in table 1.
RESULT ANALYSIS
The Results can be analyzed for three different drive cycles.
1. WLTC Class 1 Drive Cycle
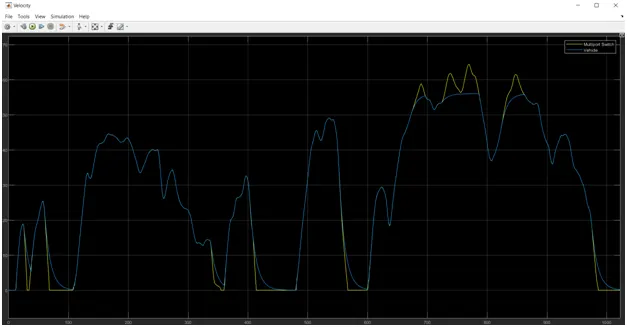
Figure 16: Vehicle velocity and WLTC Class1 drive cycle
The maximum speed of the vehicle is 55kmph. So greater than that speeds, it doesn’t follow drive cycle.
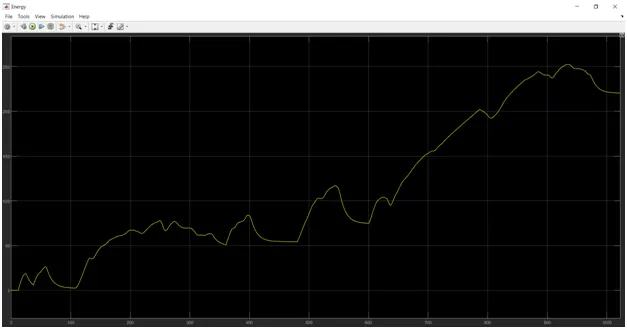
Figure 17: Energy consumed from the battery
The energy consumed in wh has been plotted above. From the plot, we can see that maximum energy is 250wh.
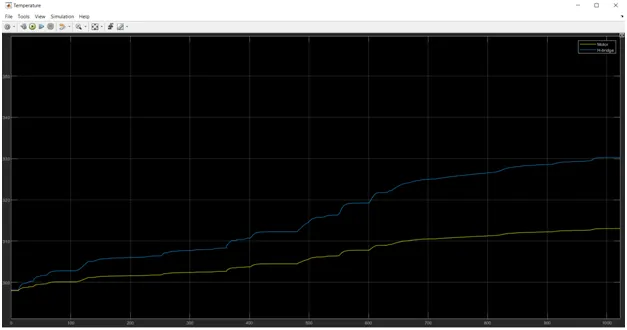
Figure 18: Temperature rise of motor and H-bridge in Kelvin
From the above plot we can understand that H- bridge temperature is more than that of motor. The maximum temperature of H-bridge – 330K,PMDC motor – 312K.
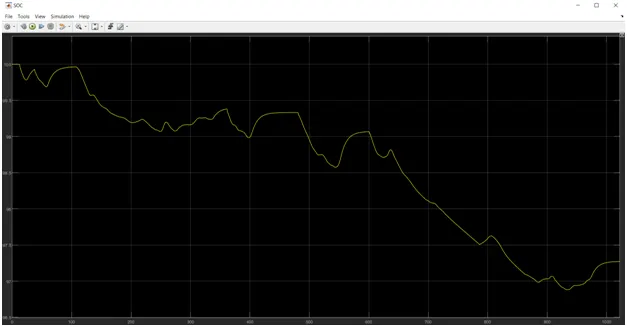
Figure 19: State Of Charge of battery
The above plot shows SOC of the battery. The battery discharges during deceleration and charges during acceleration. From the above plot, it is clear that at the end of drive cycle, battery has reached 97.5% SOC.
2. Extra Urban drive cycle for low powered vehicles
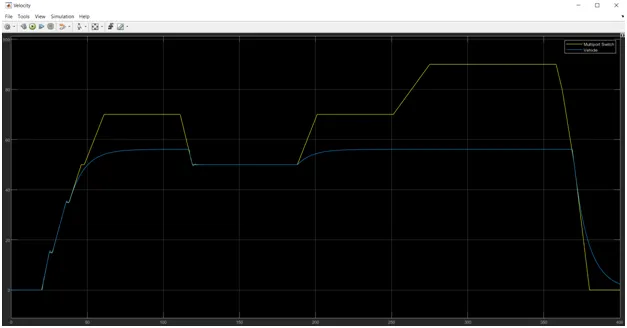
Figure 20: Velocity of Vehicle and Extra Urban drive cycle for low powered vehicles
The vehicle follows the drive cycle below the maximum speed. Since the maximum speed is limited to 55kmph, above that speed, vehicle cannot follow drive cycle.
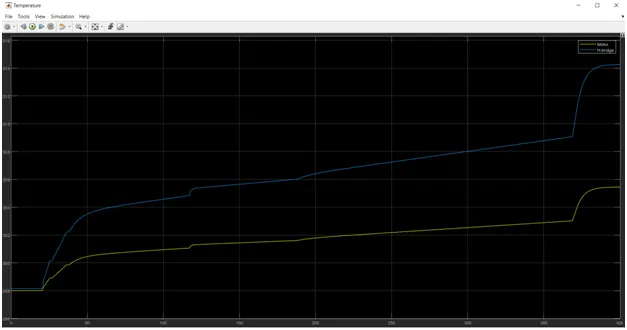
Figure 21: Temperature rise of Motor and H-Bridge
The maximum temperature of H-Bridge – 314K
The maximum temperature of H-Bridge – 306K
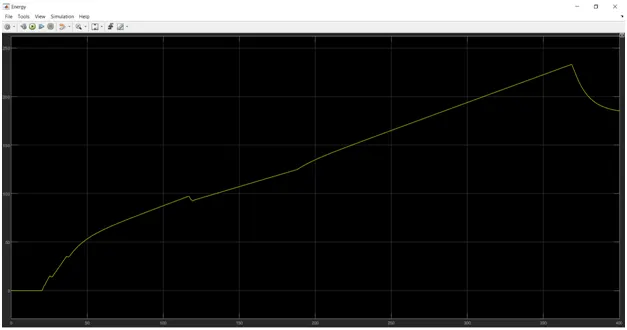
Figure 22: Energy consumed from the battery
The maximum energy consumed by the battery is 230Wh.
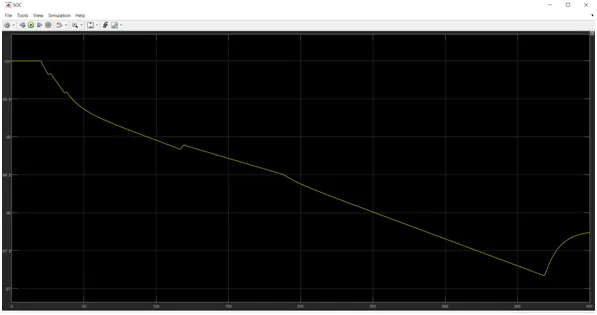
Figure 23: SOC of Battery
SOC of the battery at the end of drive cycle is 97.5%.
3. Running 100km at constant velocity
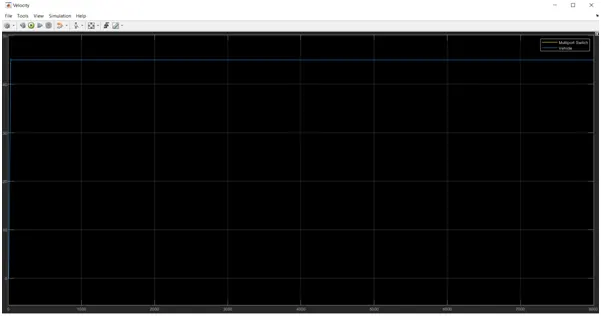
Figure 24: Vehicle running at 45kmph for 100km
From the above plot it is clear that the vehicle is able reach 45kmph in 30sec and to cover a distance of 100 km, it took 2hrs and 13minutes.
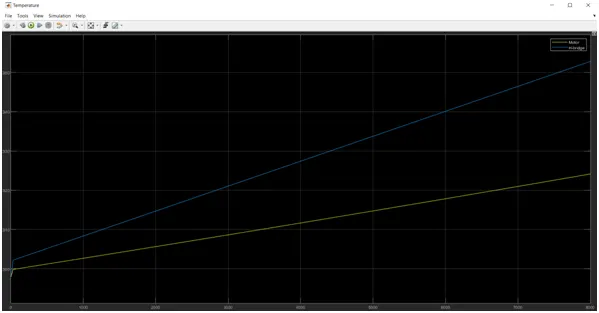
Figure 25: Temperature rise of H-bridge and Motor (in Kelvin)
The maximum temperature of H-Bridge – 355K
The maximum temperature of H-Bridge – 325K
It is clear that both H-bridge and motor needs cooling arrangements.
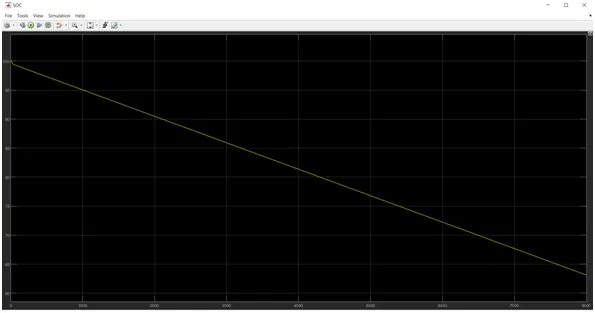
Figure 26: SOC of Battery
At the end of trip, battery has reached 64% SOC.
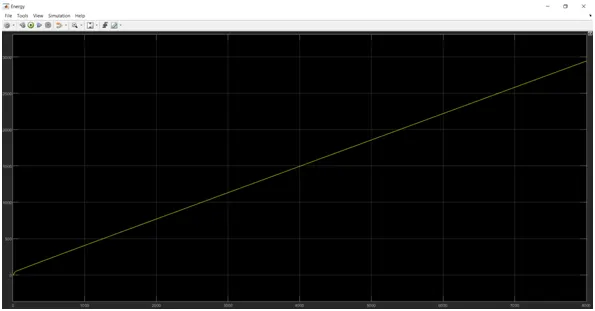
Figure 27: Energy consumed by the vehicle in Wh
The maximum energy consumed by the vehicle is 3000Wh.
CONLUSION
The performance of the Electric Rickshaw has been analyzed for three different drive cycles. We observed that the vehicle performance was as per the design data. It was able to reach the top speed of 55kmph and follow the drive cycle. But for continues running Thermal design also has to be taken care.
FUTURE SCOPE
Heat sink and other cooling techniques also has to be modeled and battery temperature also should be measured. Battery charging during regeneration and discharging circuits should also be included in the model.
REFERENCES