Final Project: Design of an Electric Vehicle
Title of Project
"Design of Electric Vehicle using Matlab and Simulink"
Aim:- To Create a MATLAB model of electric car which uses a battery and a DC motor by Choose suitable blocks from Powertrain block set.
Objective:
- To make a most simple and low run time vehicle model using the suitable block from Powertrain block set.
- To check out the performance parameter such as speed, current, SOC etc with various Drive cycles.
- To know about the Matlab model i.e Powertrain block set and their configuration.
Introduction:
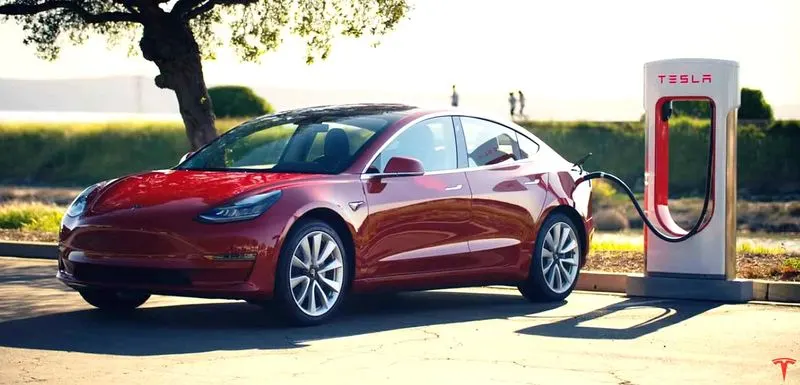
- The electric vehicle is a vehicle that runs on electricity alone. Such a vehicle does not contain an ICE (internal combustion engine) like the other conventional vehicles. Instead, it employs an electric motor to run the wheels. These vehicles are becoming very popular nowadays. They are considered to be a promising solution for the future transportation. The most common example is Tesla.
Main component of Electric vehicle:-
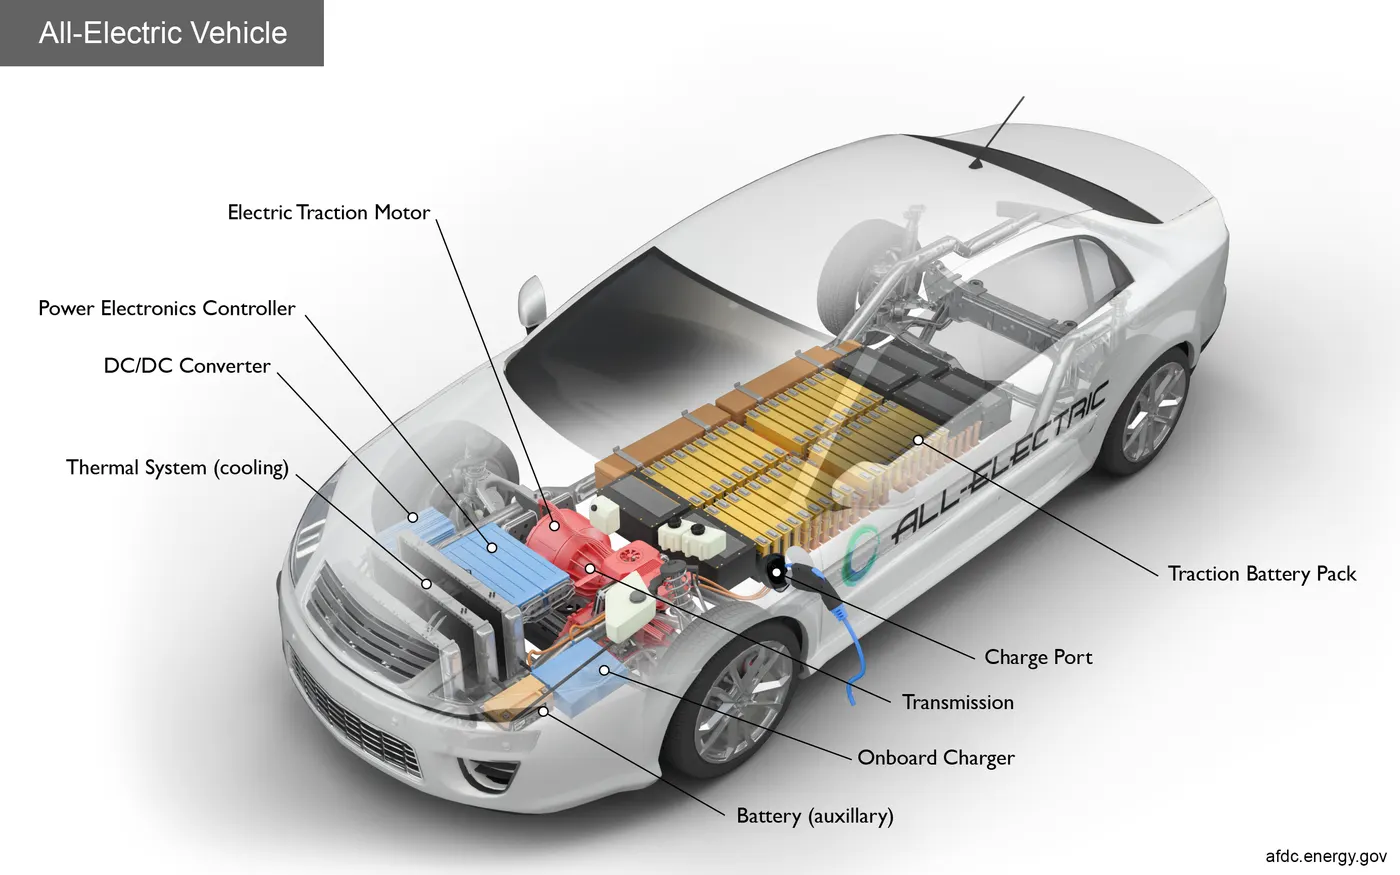
- Electric Battery: Battery stores the electricity required to run the vehicle. The battery supplies electric current to the motor. And thus, the vehicle runs. The higher the capacity of the battery the higher is the range of the electric vehicle. Most modern electric vehicles use Lithium-ion type batteries. These batteries have higher energy density. It means they are capable of storing more energy.
- Inverter: battery stores the electric current in the form of Direct Current (DC). But, the majority of the motors used in the electric vehicles run on Alternating Current (AC). So, the inverter performs the function of converting DC to AC.
- Electric Motor: An electric motor provides the power to rotate the wheels. Motors may be of DC/AC type. However, the AC motors are more common.
- Regenerative braking system: The electric-vehicle has only limited energy available. Hence, you need to save every bit of it. This system recovers the energy lost in braking the vehicle and utilizes it to charge the batteries.
- Power Control Unit: The control unit performs the main task. It controls the activities of all the components of an electric vehicle. It monitors the output of the motor, charging of batteries. Also, it provides the necessary information to the driver.
Advantages of using an Electric vehicle:
- Less air pollution: There is an absence of any combustion process. Hence, these vehicles do not emit polluting gases into the atmosphere. So, they causes less harm to environment compared to traditional IC engine powered vehicles.
- Less noise pollution: The electric motor runs quietly. Hence, the noise level while operating these vehicles is much lower than that of the petrol or disel engine powered cars. Thus, it results in very less noise pollution.
- Higher efficiency: The efficiency of operation of an electric vehicle is much higher. For e.g. the efficiency of an electric motor is nearly 90% compared to an Internal combustion engine. Hence, in all, an electric-vehicle is more efficient than petrol or Diesel vehicle.
- Low maintenance cost.
- Low fuel and operating cost.
Limitations of an Electric Vehicle:
- High price: The production of electric-vehicles is not yet done completely on a commercial basis. Hence, these vehicles are costly than conventional cars running on petrol or Diesel.
- Low range: Range of an electric-vehicle is the distance that it can cover on a single charge. There have been recent advances in the battery technology. However, the range of these vehicles is still not on par with that of the regular vehicles. Also, some of these vehicles are suitable only for low-speed applications.
Block Diagram of the Model:
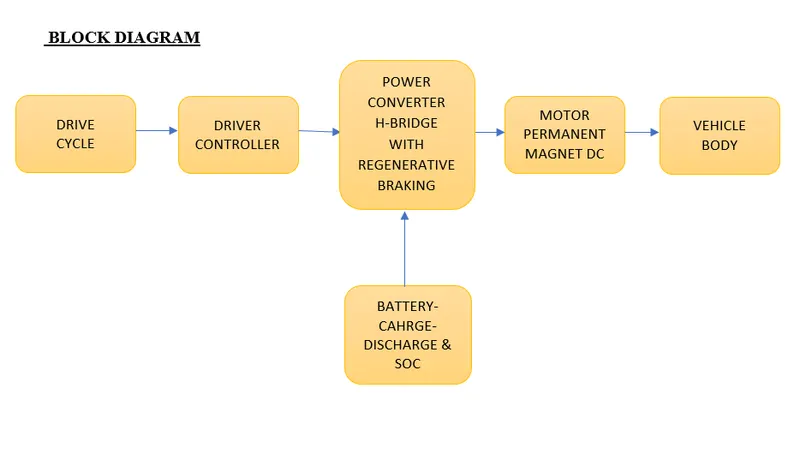
- Here we have vehicle body and the motor is connected to the wheels / axels of vehicle body.
- Before connecting a battery to the motor we required motor controller. This motor controller is used to control the speed of the vehicle.
- If we connect battery directely to the motor then the motor will operate at rated speed. so, we required the controller to control the motor which is possible by power converter.
- The battery is connected to power converter which supply the power to power converter. The power converter will change the voltage applied to the motor which will intern change the speed of the vahicle.
- To simulate or to run the model for given input we need the have a throttle and brake padel in our hand / lags this is nothing but a drive cycle input.
- So, we have a drive cycle input block and driver controller which will actually track the actual speed of vehicle and compare with given input and depending on the difference in this two signal the control signal is generated to control the vehicle.
- The above figure shows the basic arrangement of Electric Vehicle.
Main simulation diagram:
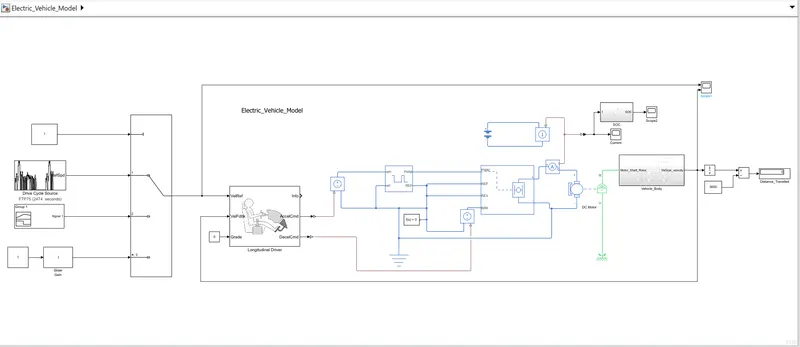
In the below picture , I have done the simulation of an electric vehicle using various drive cycles by using powertrain blockset available in simulink library.First, there is the inputs where we have connected different drive cycles which provides the reference for the longitudinal driver which compares the two speed and gives accelerator and braking commands to the motor controller block. battery block and vehicle body blocks are further attached and scopes are used for displaying the working status.
System Level Configuration:
1.Vehicle Body:
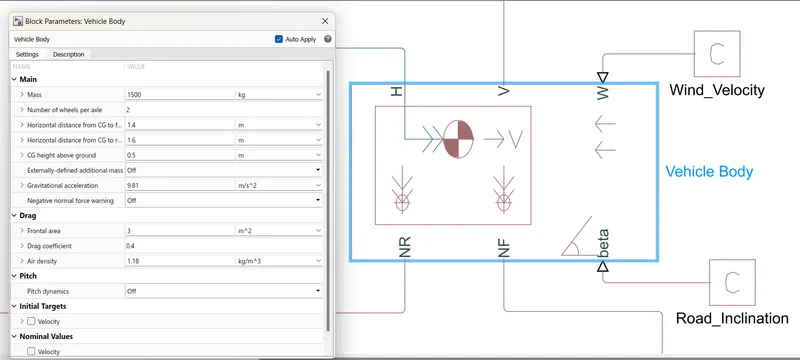
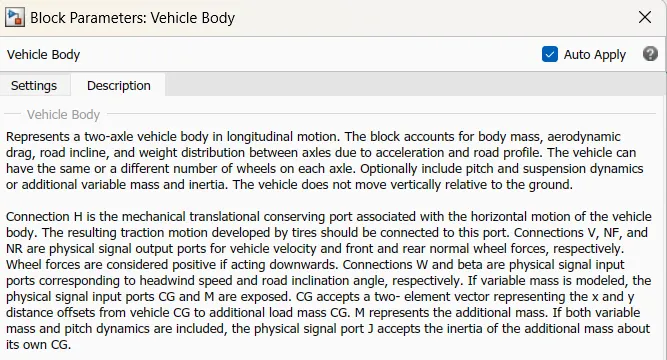
This block contain 6 ports which can be used to model various aspects of the vehicle body. The ports are mentioned below;
- H- This stands for hub and is used to connect the hubs of the wheels to the main body of the vehicle.
- V-Physical signal output port which stands for 'velocity' and is used the output the velocity of the vehicle.
- W- Physical signal input port and allows us to model a wind velocity that acts aginst the vehicle.
- NR- Physical signal output port to connect to connect the rear wheels. It describe the Normal real wheel force(m*g).
- NF- Physical signal output port to connect the front wheels of the vehicle. It describe the Normal front wheel force(m*g).
- Beta- Physicall signall input port which allows the vehicle to undergo an inclination of hill climbing force.
- Block parameters is used to set up mass, frontal area, drag coefficient, Air density and many others.
Vehicle body subsystem:
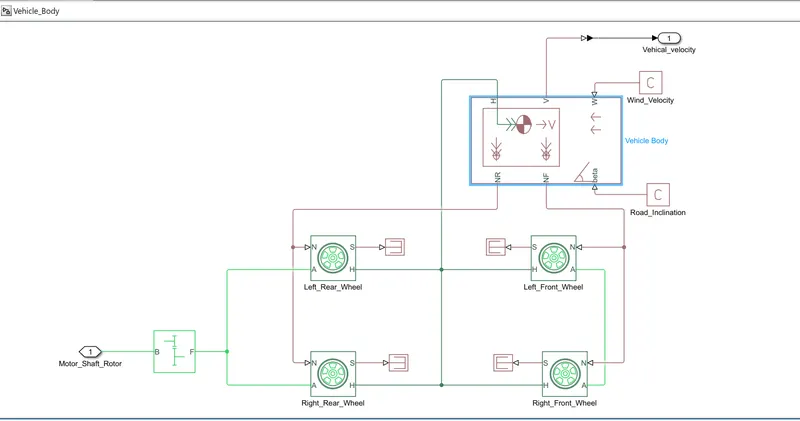
- The above blocks are forming a subsystem which serves as a part for the whole vehicle.
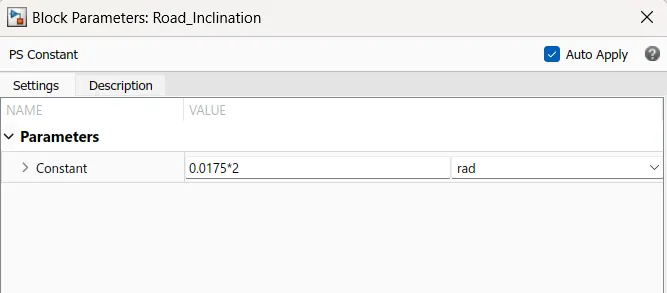
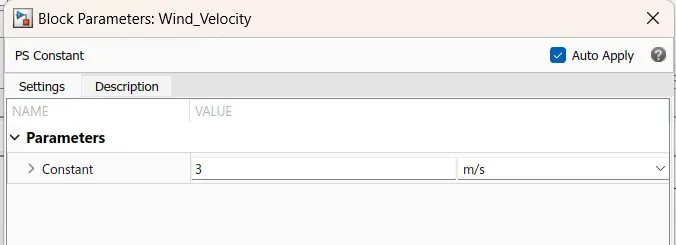
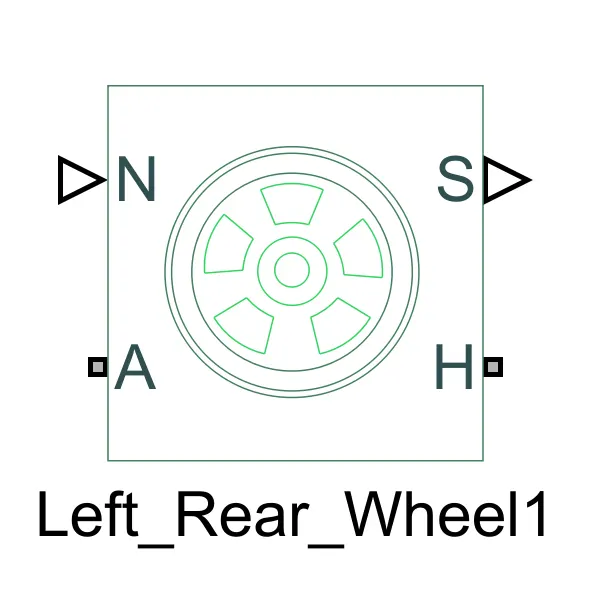
- Four tires are connected such a way that the right two tires are the Front wheels and the remaining two are the Real wheels . They are interconnected to the hub of the vehicle body block and their respective axles are connected accordingly. Here i have connected the rear axle with the gear hence it is know as rear wheel drive vehicle. Here the wind velocity port and hill-climbing angle ports are connected to physical constant blocks. This block creates a physical signal constant. The Constant parameter accepts both positive and negative values. The block output is a physical signal port.
Tire block parameters:
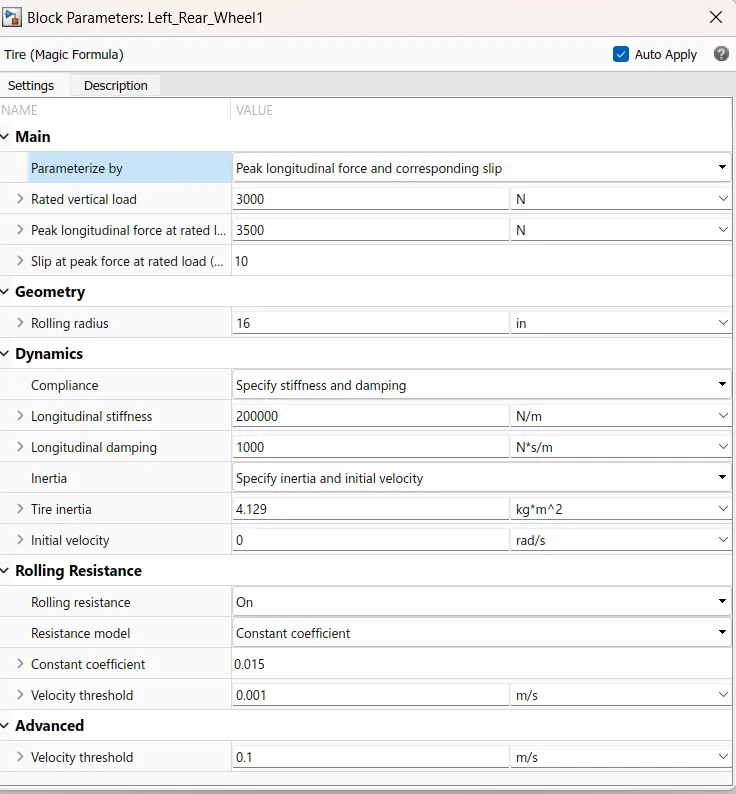
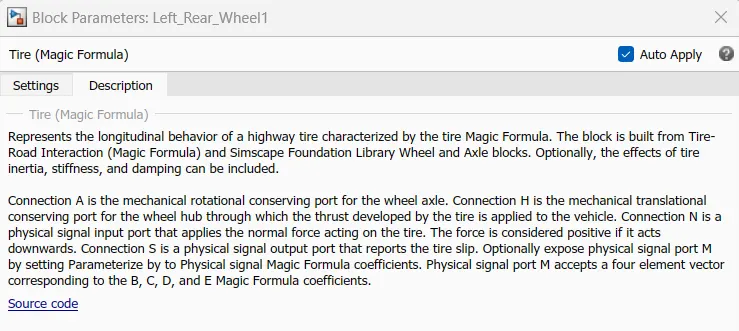
- Here we can enter the various parameters values related to tire such as Crr, Inertia, Rolling radius, Damping, Stiffness etc.
Simple gear block parameters:
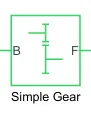
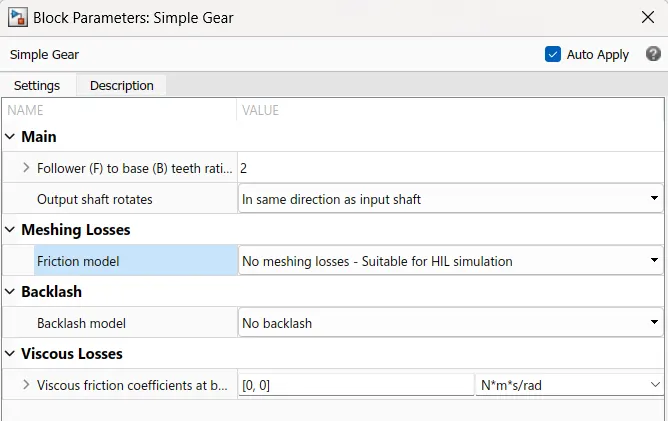
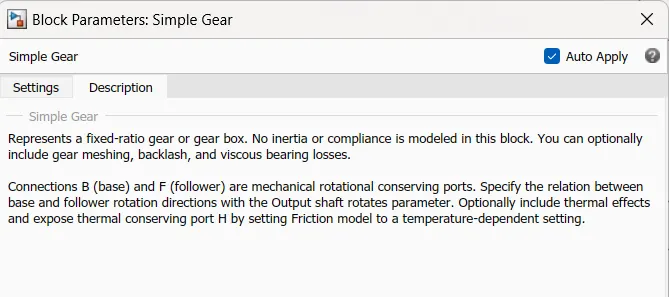
- This block models a gear system with fixed gear ratio with no-inertia effects. However, we can modify it for simplicity i havent modified it., Here, The follower to base teeth ratio has been set to 2 and the output shaft rotates in the same direction as the input shaft.
All these blocks are categorised into a single subsystem which we have names as vehicle body block, which takes the mechanical input from the motor and controller block into the gear and displays the velocity at which the vehicle body moves.
DC Motor:
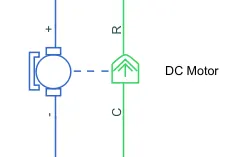
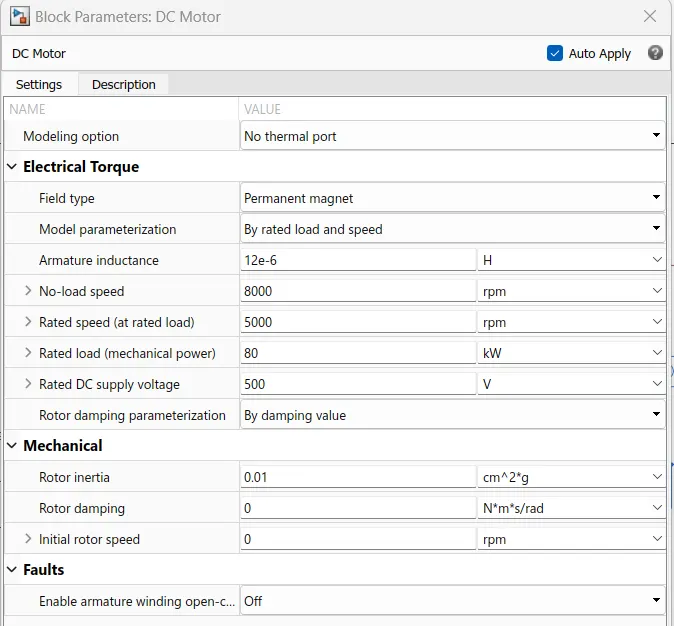
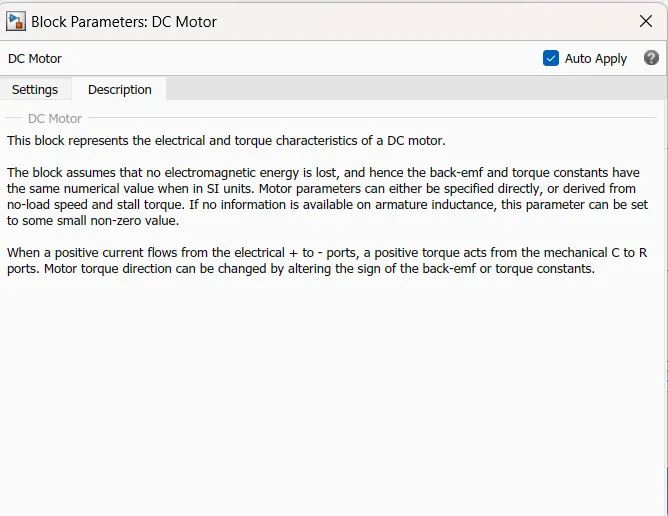
- Here, I have selected simple DC motor block because DC motors are easy to model and have a very few parameters to run for a particular application.
- There are two sides of the block , the mechanical side is on the right and the electrical side is on the left.
- Mechanical side has tow ports C and R, C stands for casing and is the stable part and R is the rotor which produces a torque.
- The electrical side has a positive and negetive side for the voltages to be applied. If positive voltage is applied to the motor block then a positive torque will act from C to R port. The directio of the torque can changed by changing the polarity of voltage applied to the motor. Here i have connected the c port to the mechanical rotational reference because it will be stationary. The R port is connected to the gear in the vehicle body block.
H-bridge:
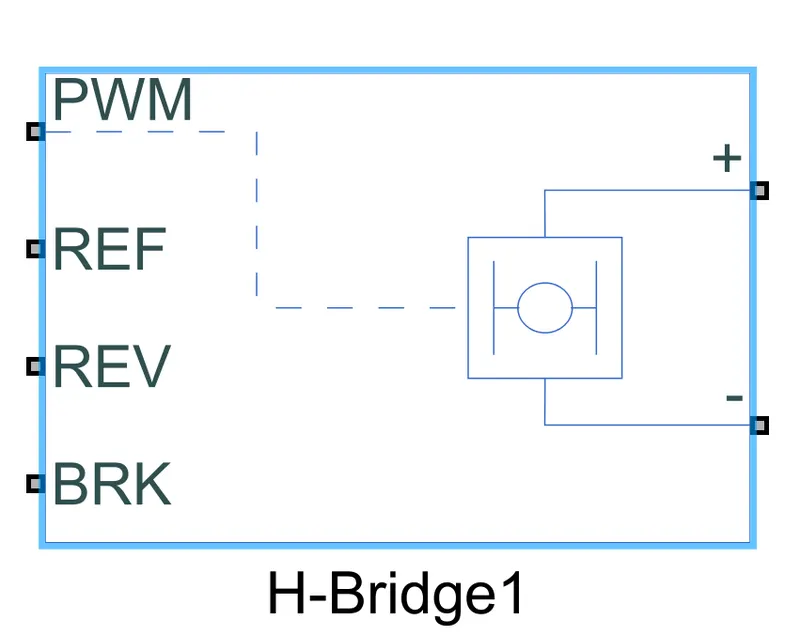
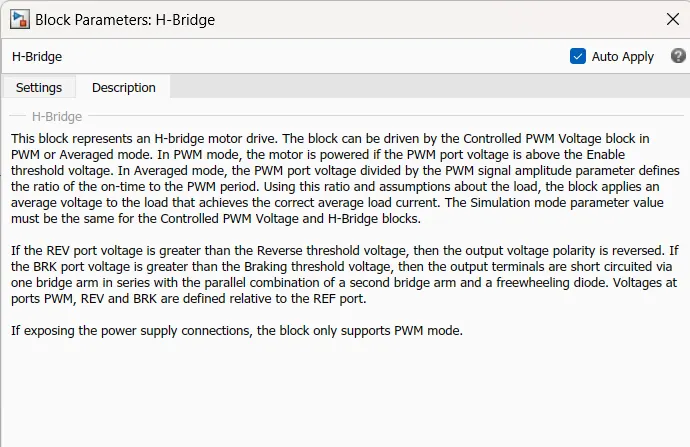
- This is a power converter/controller which is used to convert DC quantity into controlled DC quantity .
- In case of EV,s a power converter is needed to provide a DC voltage from the battery of the EV to the DC motor, so that it can fuction properly at the desired/required speed. Here i have used an H-bridge motor drive as my power converter.
- The left side is for controlling the voltage signals and the right side terminals provide the controlled voltage to the DC motor.
- The left side ports are:
- PWM-Pulse width modulation
- REF- Reference
- REV- Reverse
- BRL- Brake
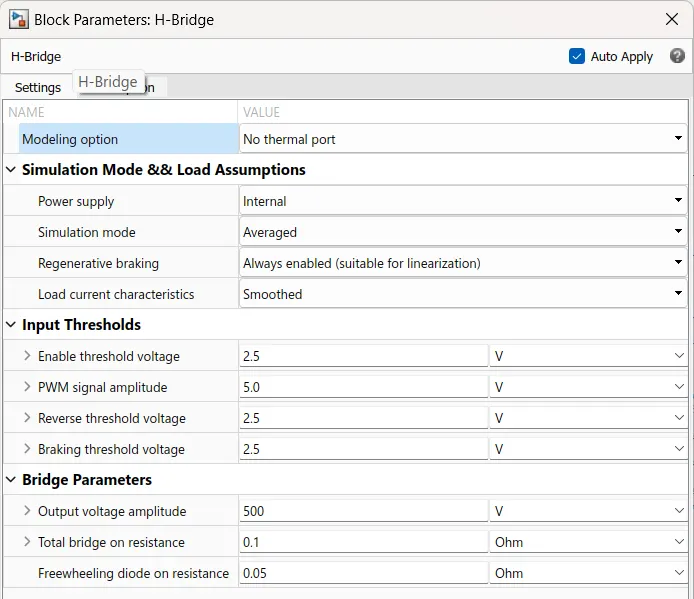
The simulation is kept in average mode beacuse PWM mode will take longer durations of simulation. In the section of bridge parameters the output voltage amplitude was modified to 500 volts according to the DC motor.
Controlled Pwm voltage:
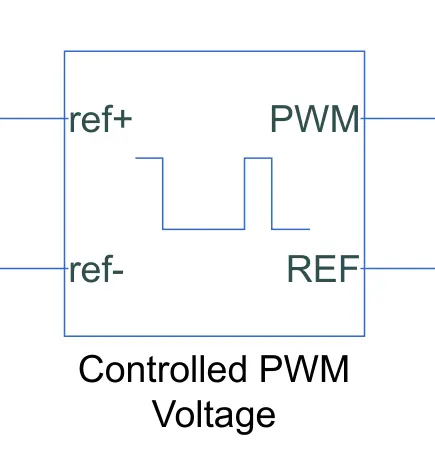
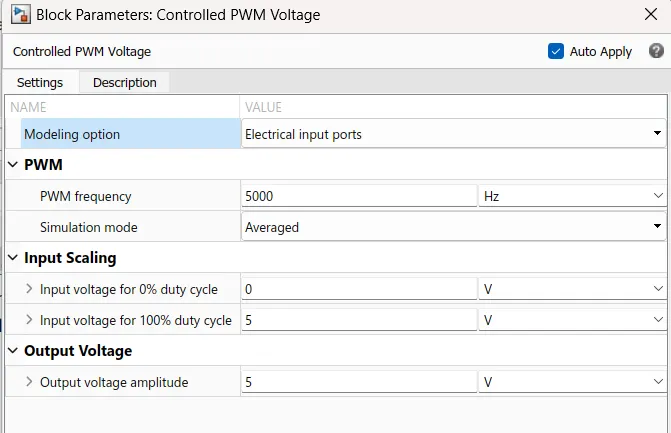
- Controlled PWM voltage' is used to provide a controlled pulse width modulated voltage to the H-bridge block. The duty cycle formula is given by:- Duty cycle= Ton/(Ton +Toff)= Ton /Tcyc.
- where Ton = On time,Toff = off time and Tcyc=Time taken for one cycle.
Here all the parameters are set to their default values. I have chosen the averaged simulation mode so that it will feed voltage pulses within quicker simulation times to the H-bridge. The remaining parameters of input scaling and output scaling are unchanged.
Controlled voltage source:
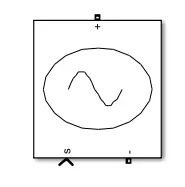
- This block provides the necessary voltage that is powerfull enough to maintaion the voltage at the output regardless of the currentfollowing through it.
Electrical reference block is used to create grounding effect for electrical circuits. In my model, we have used it in 2 parts . First to create an electrical ground between Controlled voltage source, controlled PWM voltage, H-bridge blocks. The second is for the battery.
Solver configuration block is used to solve any necessary equations in a model. I Have used them in the connection to the REV port of the H-Bridge block.
Battery:
- The battery is a energy storage device which stores the energy the EV and will contain the electrical energy in DC form and provide this energy to operate the motor.
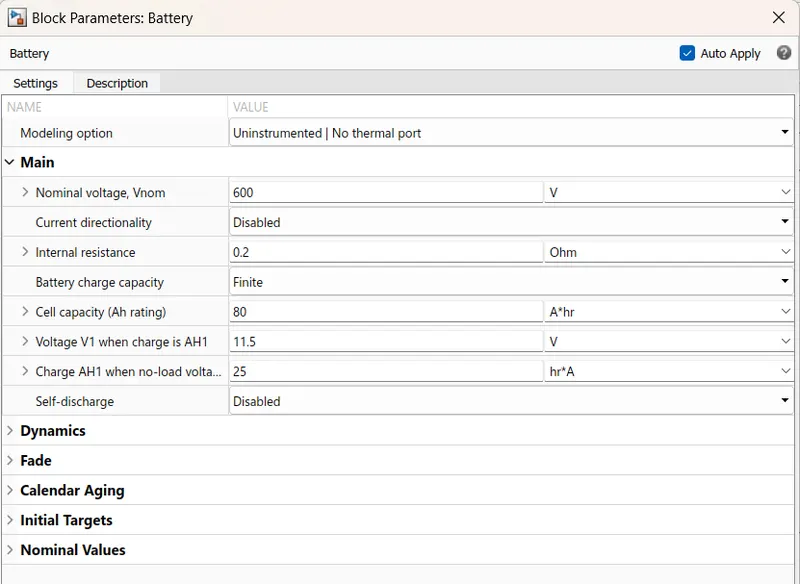
- Nominal voltage has been set to 600 volts, internal resistance has been set to 0.2 ohms and an infinite charging capacity
Controlled current source:
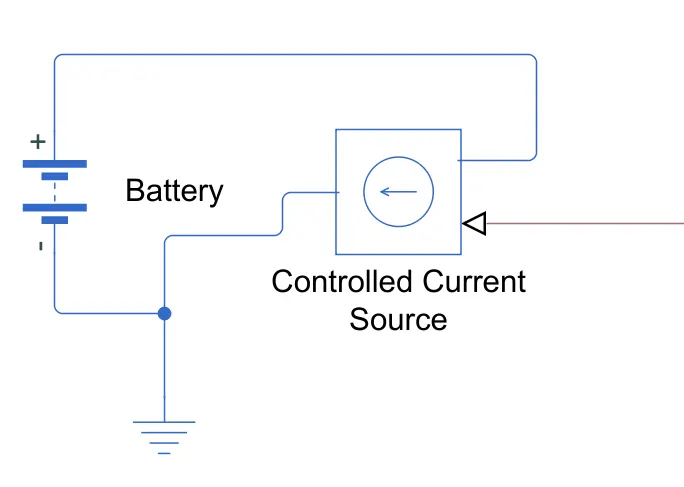
- The block represents an ideal current source that is powerful enough to maintain the specified current through it regardless of the voltage across it. The output current is I = Is, where Is is the numerical value presented at the physical signal port.
Current sensor:
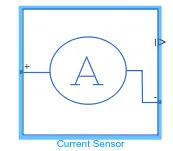
- The block represents an ideal current sensor, that is, a device that converts current measured in any electrical branch into a physical signal proportional to the current.
- Connections + and - are conserving electrical ports through which the sensor is inserted into the circuit. Connection I is a physical signal port that outputs current value.
SOC (state of charge) subsystem:
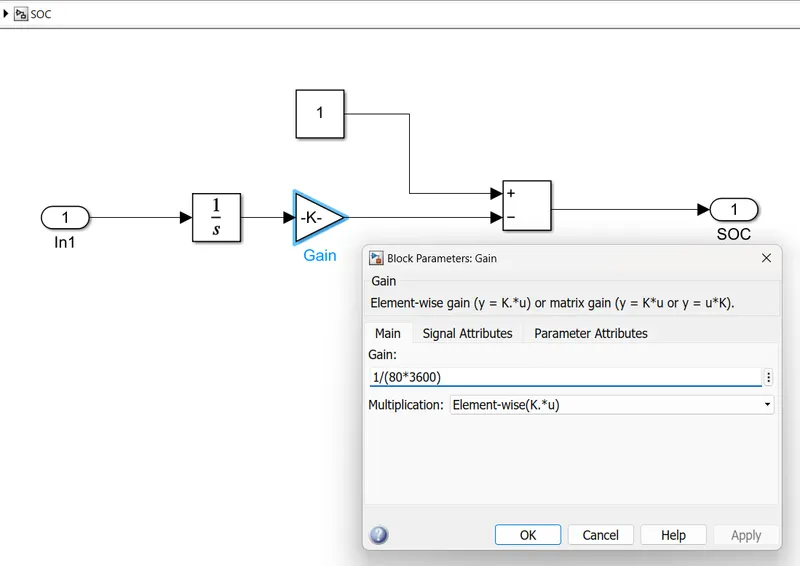
- To measure the state of charge of the battery, a sub-system was created by using various blocks as shown in above figure.
- The first block is integrator block used to handle data transfer and integrate the value of the current signal with respect to time and next is the Gain block is used in order to divide the signal coming from integrator block.
- This block will divide the current signal with the ampere rating of battery which is 80(Ah)*3600(secs in hour) .
- Assuming the battery is always fully charged I have added the constant block with a value of 1 representing 100%.Next a sum block is used to perform addition and substraction operations.
- A scope block is used at the junction of the PS-simulink converter block to plot the output signall of the current from the battery.
Speed measurement :
In order to measure the actual speed of the vehicle, I have modified the scope block to have two input ports where one port takes the output velocity signal from the vehicle sub-system block and other port takes the output signall from the drive cycle to the reference velocity port on the longitudinal driver block. This has been done to compare the two speeds and check weather they overlap and achieve the same speed.
Distance measurement:
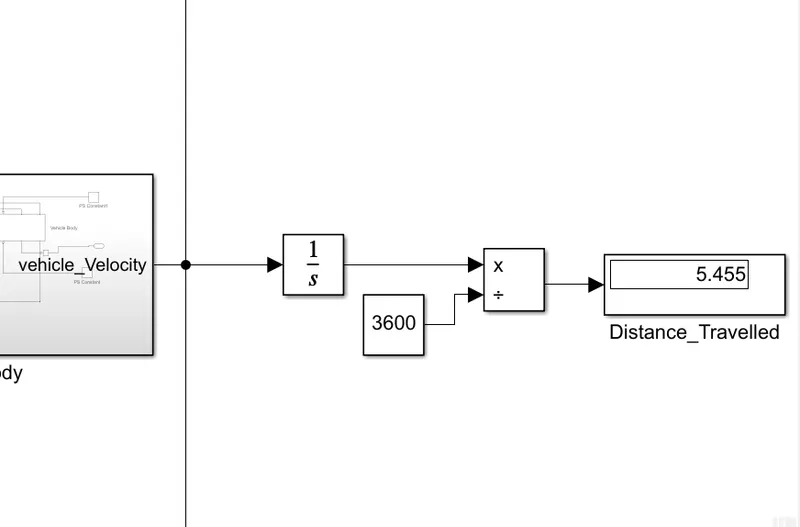
- Here the Velocity of the vehicle is integrated to get the distance and then it is diveded by 3600 to get distance in Km.
Longitudional driver and drive cycle:
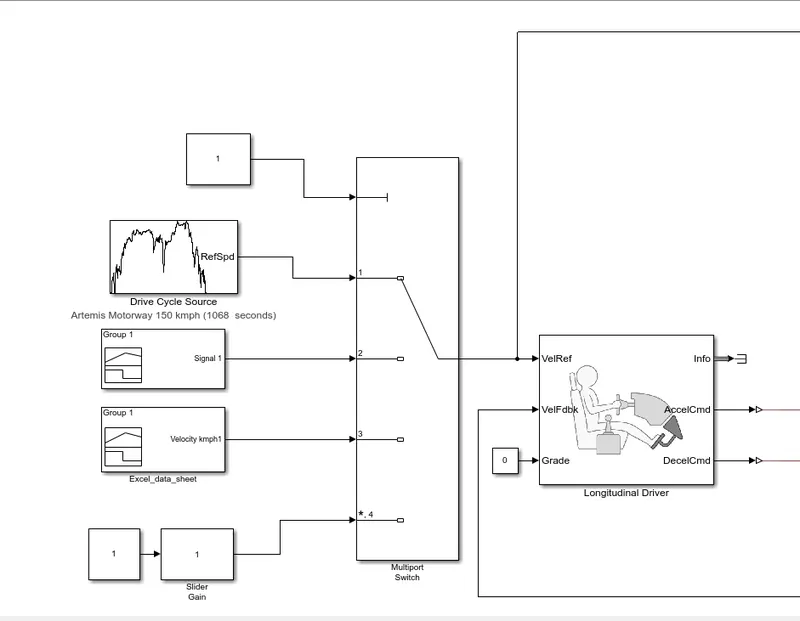
- The longitudinal driver block is used to give normalized acceleration and deacceleration command to a controller based on two sets of data.
- The first data is the reference velocity and second data is the feedback velocity.
- The reference velocity data coming from drive cycle source and is compared with feedback velocity data coming from the vehicle body.
- If the reference velocity is greater than the feedback velocity, an acceleration command will be given as an output to the controlled voltage source.
- If the reference velocity is lesser than the feedback velocity, a deacceleration command is given as output to another controll voltage source.
- To feed acceleration and deacceleration commands to the H-bridge, i have used simulink-PS converter block. In this case the input signal is velocity data and this is logic data which have to be converted to a voltage signal.
- The ports in this block are:
- Velref- This stands for the reference velocity and it is the velocity data provided from a drive cycle source.
- Velfdbl- This stands for feedback velocity and it is coming from the vehicle's body velocity port
- Grade- This port provides a grade or inclination angle on which the vehicle is travelling in degrees.
- Info- This port is for the bus signals which consists of block calculations.
- Accelcmd- This port provides the acceleration command to a controlled voltage source.
- Deacclcmd- This port provides the deacceleration command to another voltage source.
Drive cycle:
- A drive cycle is a data set that contains velocity and time data for the purpose of modelling the motion of a vehicle.
- It is a plot of the vehicle velocity against the time and it is made to reseamble typicall driving conditions that a consumer may experience themselves in.
- For example here i have used 'artemis motorway of 150kmph'.
- Drive cycles are used by various testing procedures such as mileage, pollution tests, and acceleration and top speed tests.
- There are three ways of implementing a drive cycle.
- One method is to create your own drive cycle with spreedsheet or excelsheet here i have loaded my excel sheet data into signal builder.
- one more method is to use the slider gain block. By using this block we can actually create driving cycle while runing the simulation.
Block parameters:
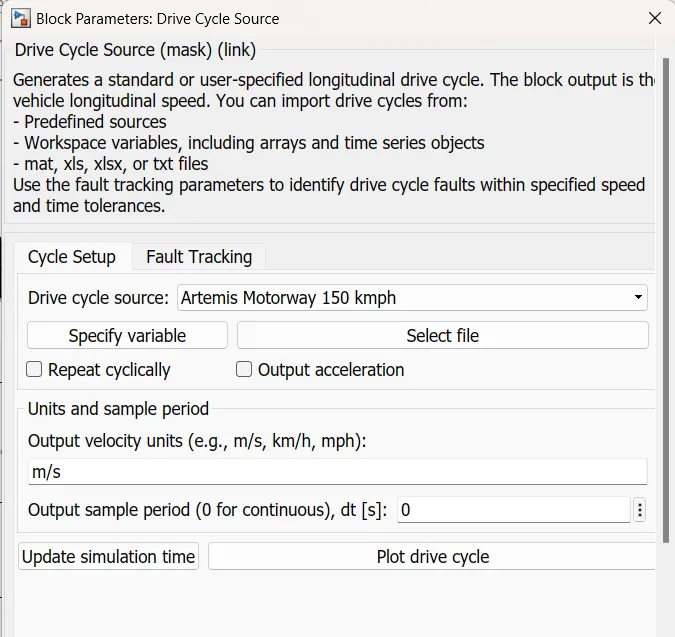
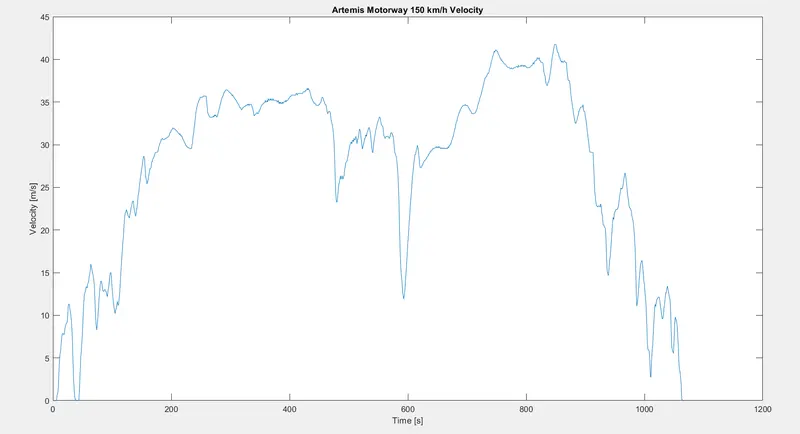
Artemis Motorway 150kmph Drive cycle graph is shown as above.
Results: I have run the above drive cycle for my EV model and took the outputs given from speed, surrent and SOC scopes. The distance travelled by the vehicle in the drive cycle is also measured using the display block. Before simulation the run time was updated according to the drive cycle time 1068secs.
Speed scope: For FTP75 Drive cycle input which is run for 2474 second.
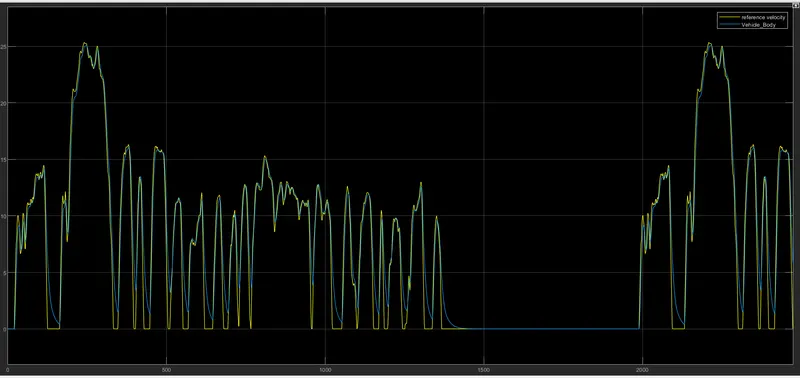
From this scope we can see two signals. The blue signal represents the vehicles body speed and the yellow signal is the FTP75 Reference velocity . As we can see that the longitudinal driver successfully maintains the drive cycle data , process it and controls the vehicle's speed according to the reference speed. the graph overlaps eachother effectively during acceleration and deacceleration.
Current scope:
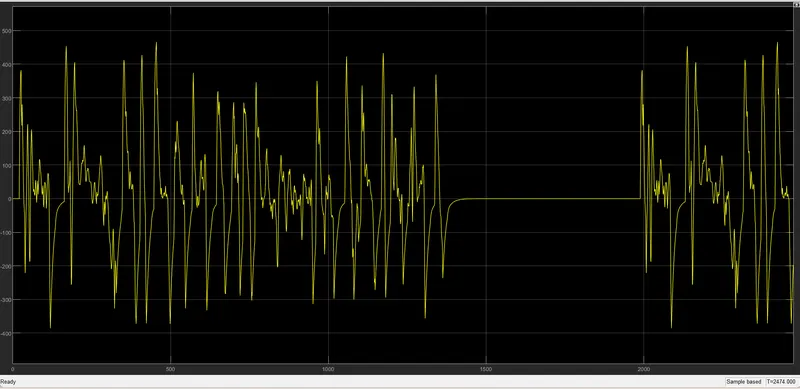
This scope shows how current is flowing from the battery to the motor varies with the drive cycle.
SOC scope:
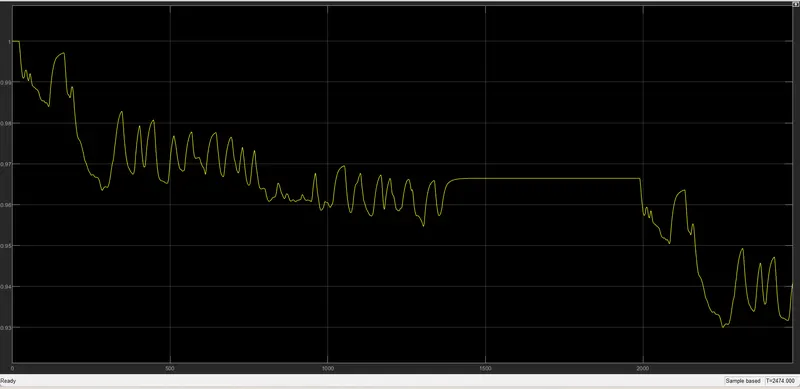
The SOC scope shows how the state of the battery varies over the drive cycle time, The batter was modelled to begin with an SOC of 1 that is 100%. As the simulation starts the charge of the bettery gets decreased and when the vehicle is in braking mode the uplift in the graph shows that regenerative braking is working to maintain the battery charge. Here we can see that after the whole simulation is over the State of charge percent lies at 94% after 2474 secs.
Distance travelled:
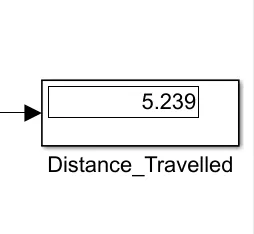 From the above image the display block measured the distance as 5.239km in 2474secs and charge remaining 94%.
Conclusion:
The EV model has been created with necessary block components using the SIMULINK software and the model have been simulated for an industrial drive cycle "FTP75" The simulation has produced the results of the velocity of the vehicle, current flowing from the battery and state of charge as well as the distance travelled in the simulation time. The EV model was able to follow the commands given byreference velocities from the drive cycle data. The distance travelled by my EV model was 5.239km and seems to be appropriate value based on the artemis motorway drive cycle. The soc of the battery was discharged efficiently upto 94% from full charge. This model has also included some features like regenerative braking which was evident in the current scope and state of charge scope.