Final Project: Design of an Electric Vehicle
PROJECT -DESIGN OF ELECTRIC VEHICLE
SIMULINK MODEL:
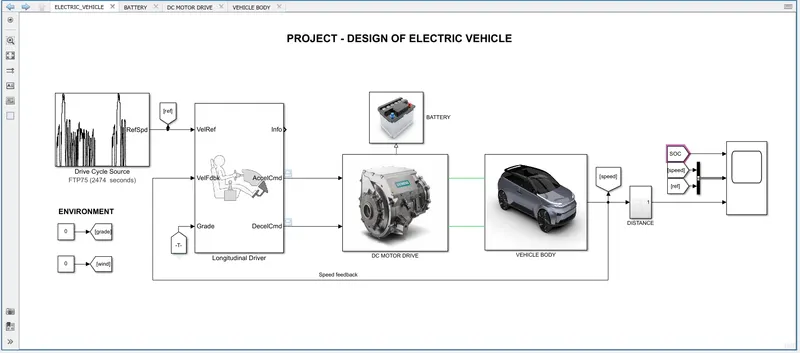
- The model of electric vehicle
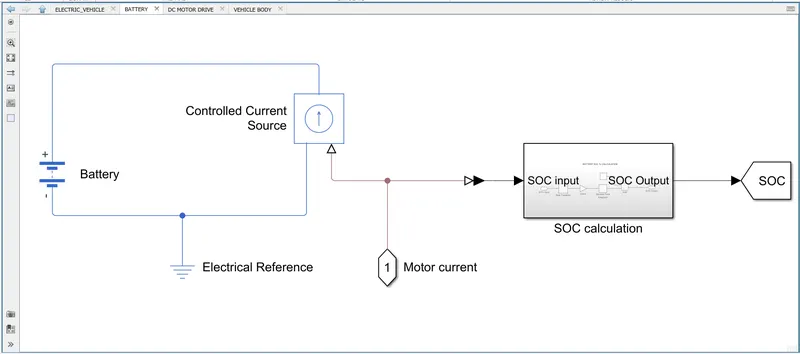
- The battery block
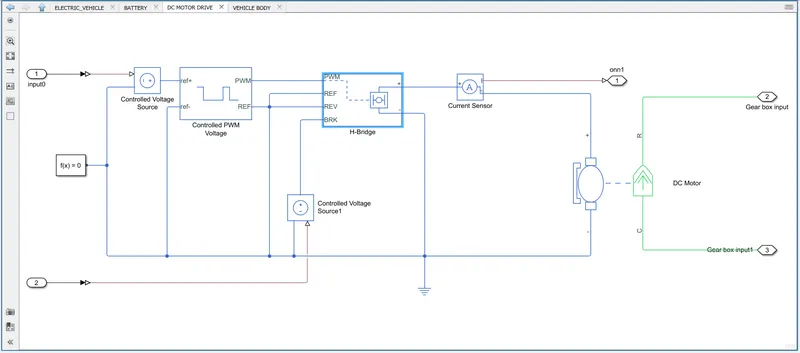
- The DC motor drive block
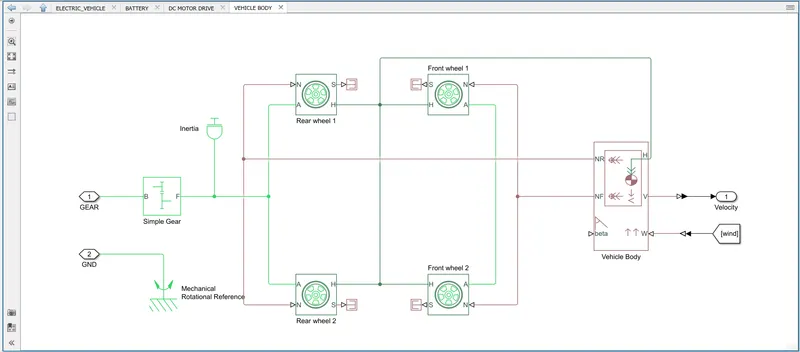
- The vehicle body block
REPORT:
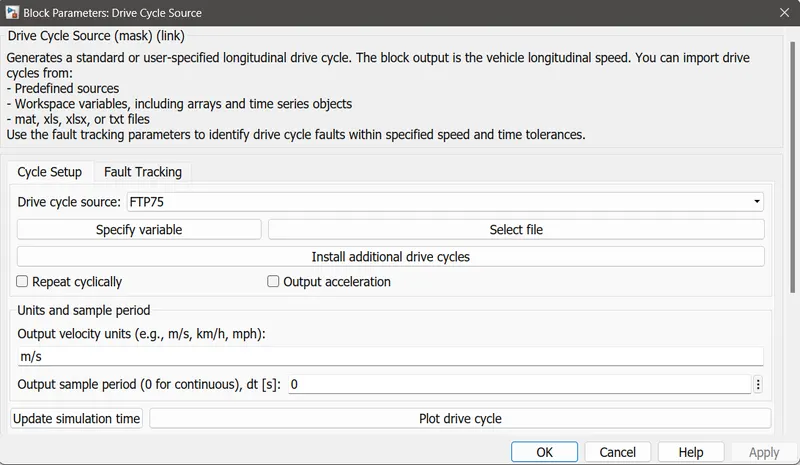
- The FTP75 drive cycle choosen from the Drive cycle source block
- The longitudinal driver block selected from powertrain blockset to provide acceleration and decceleration command
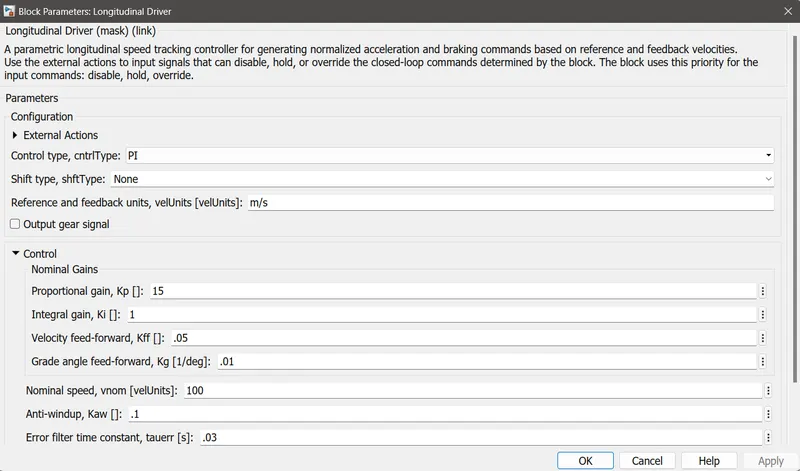
- The control type selected as PI(Proportional and Integration controller) for this model
- The drive cycle connected as reference speed and feedback speed obtained from the final output of the model
- The grade port connected to constant block in order to apply the inclination angle
- The battery model from simscape library and parameters choosen according to the motor used
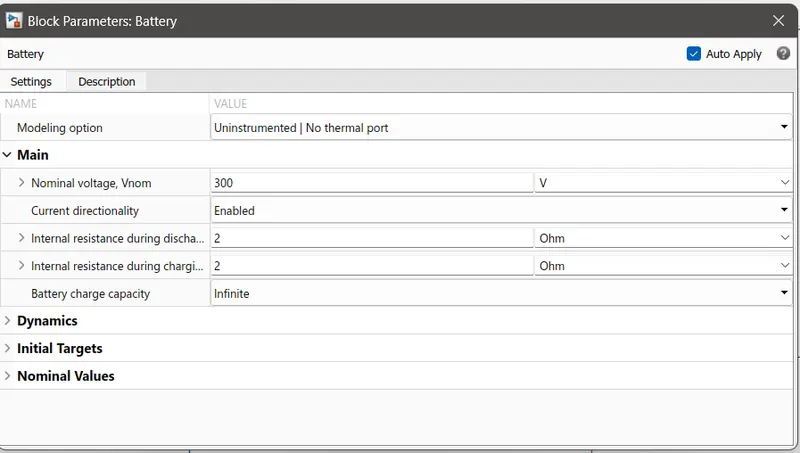
- The current output from the H-bridge converter is connected to the battery through a controlled current source
- The circuit grounded by connecting a electrical reference to it
- The state of charge of the battery is calculated from the motor current as follows
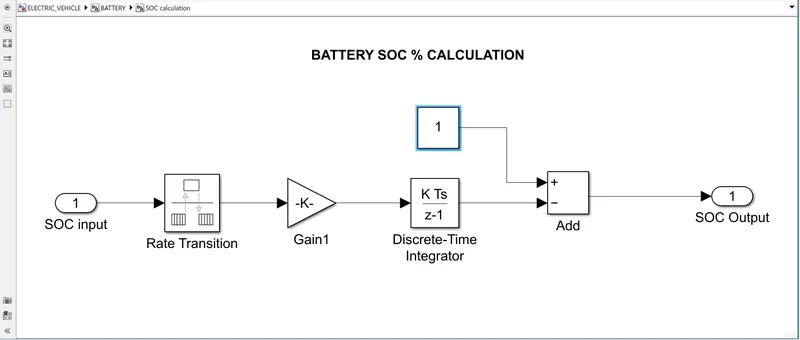
- The battery state of charge can be calculated mathmatecally as follows
- SoCt=SoCt-1+Ic(t)Qnt
- Wher,Ic(t) ⇛Discharging Current at Time t
- SoCt ⇛Estimated SoC at Time t
- SoCt-1 ⇛Previously Estimated SoC at t-1 or SoC value Given by Manufacturer
- Qn ⇛full battery capacity charges
- The motor drive block contains PWM controller,H-bridge converter and DCmotor
- The PWM controller parameters choosen as folllows
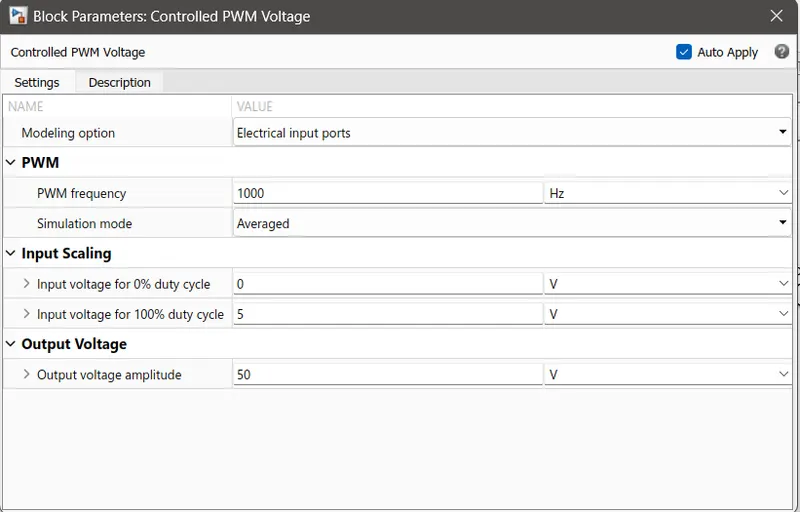
- The acceleration command from the driver block is connected to the ref+ port of PWM controller through a controlled voltage source
- The ref- port connected to the electrical reference
- The output voltage of PWM controller set to 50v in order to achieve the required output
- Thi output signal given to the input of H-bridge converter
- The H-bridge converter from simscape library used and parameters choosen a follows
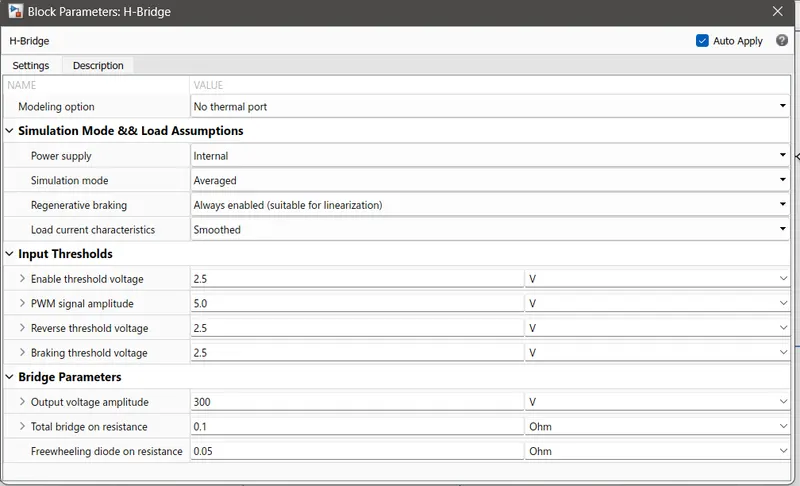
- The output voltage set to 300v according to the motor voltage
- The PWM input port receives the output voltage of PWM controller
- The REF port connected to the REF port of PWM controller and grounded
- The REV port connected to the electrical reference
- The BRK port get the input decceleration command from the driver block through a controlled voltage source which act as regeneratve braking
- The output of the H-bridge converter is connected to the DC motor through a current sensor
- The output from the current sensor is given to the battery block
- The DC motor model from simscape library used and parameters choosen as follows
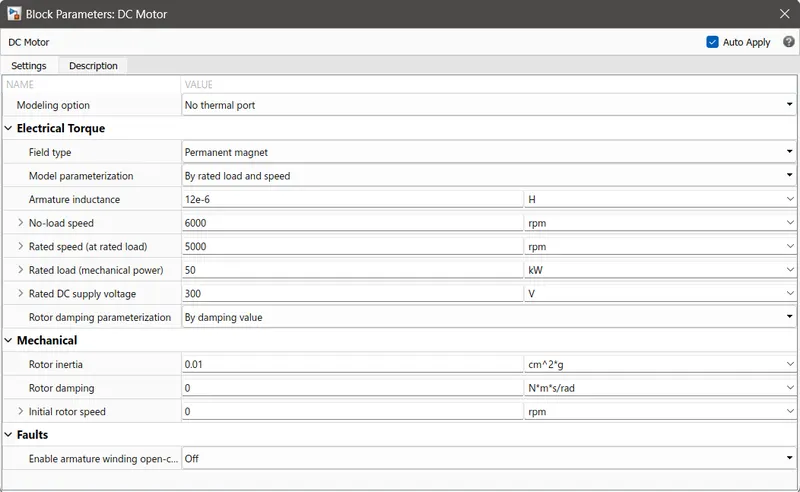
- Permanent magnet field DC motor type selected
- The rated load set to 50kw and rated voltage set to 300v
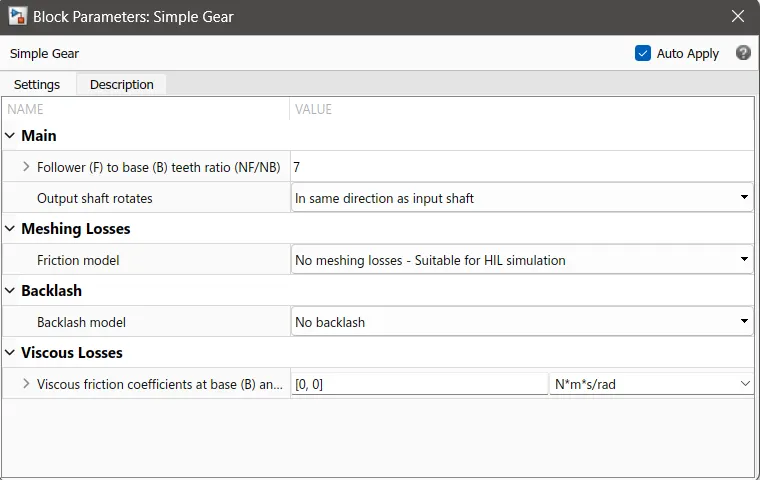
- The mechanical output of the DC motor connected through Rear wheel axle through a gear model
- And also it grounded using mechanical rotational reference block
- The simple gear block parameterss choosen as follows
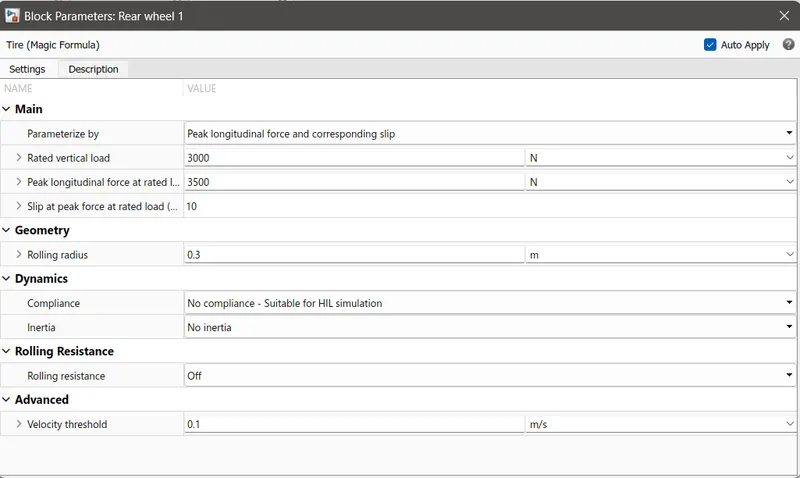
- The wheel blocks parameters choosen as follows
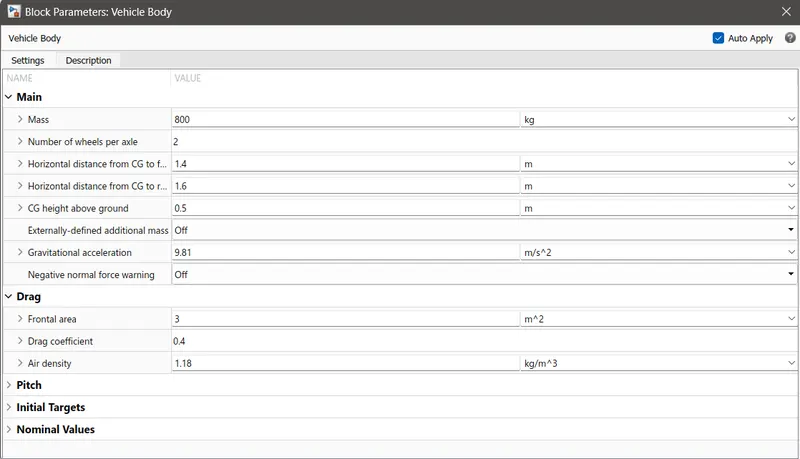
- The vehicle body block parameters choosen as follows
- The vehicle body hub port connected to the hub port of all rear and front wheels
- Rear wheel axle port and N port which is force signal connected and same done for front wheels as well
- The force to rear wheel applied by the NR port of vehicle body
- The force to front wheel applied by NF port ofvehicle body
- The wind velocity port is connected through constant block through goto &from block
- The output is velocity converted from physical signal to simulink signal using PS-Simulink converter
- The output velocity feeded back to the driver block
- The distance travelled by the electric vehicle calculated as
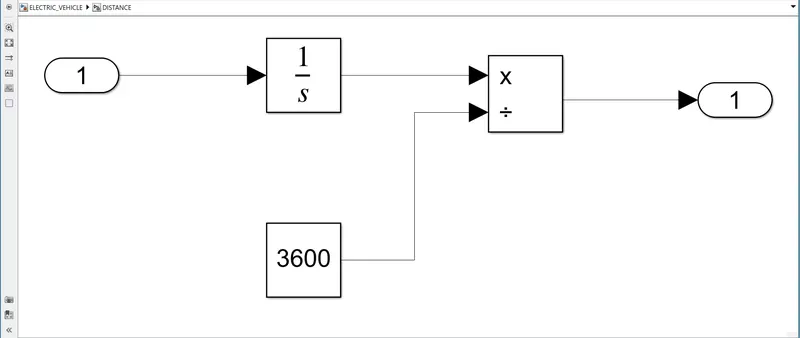
- All the ouputs SOC of battery ,reference speed ,actual speed and distance connected to the scope block
- The model simulated for 2474 seconds same time as of the FTP75 drive cycle
- The output results plotted
RESULT:
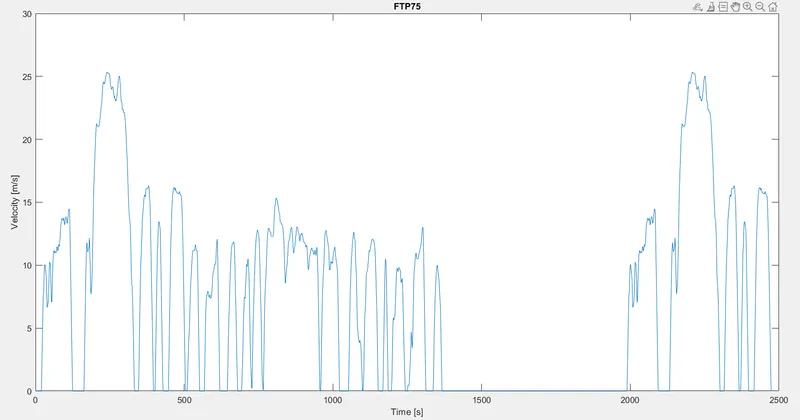
- The FTP75 driving cycle
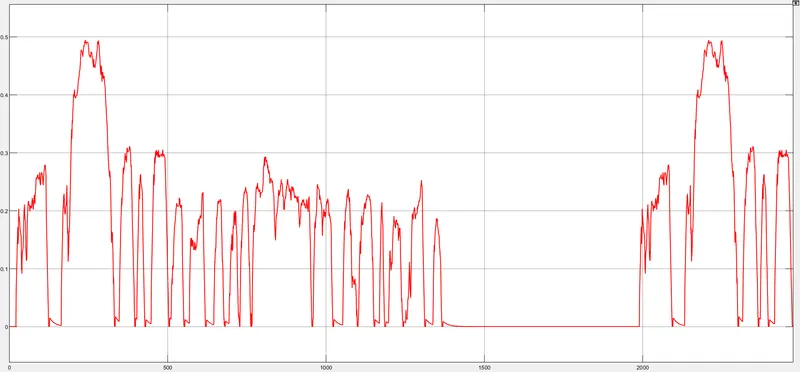
- The accleration command from the driver block is shown below
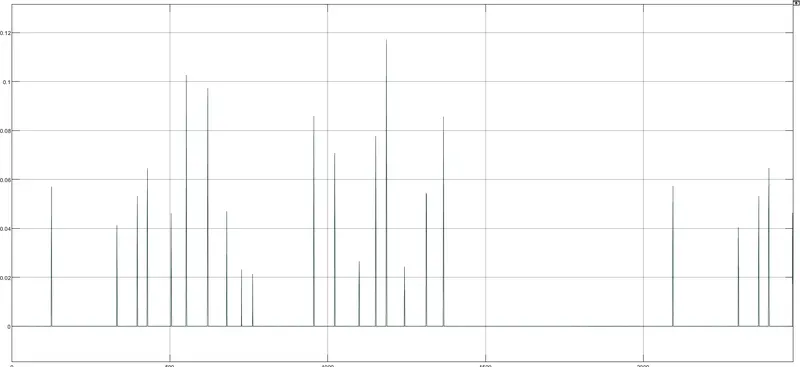
- The decceleration command from the driver block ihown below
- The motor current results is shown below
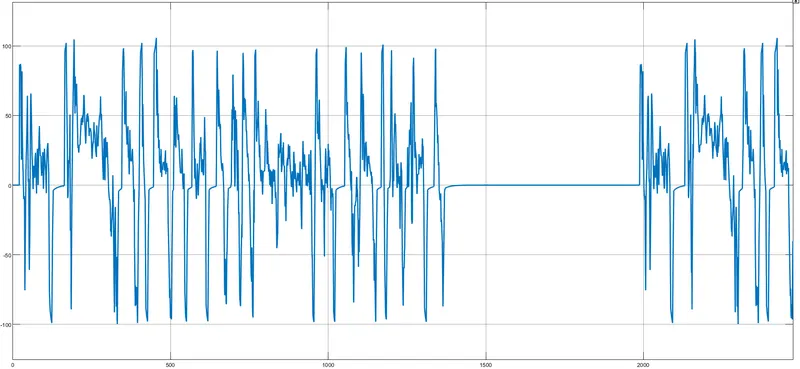
- The current polarity changes as per the acceleration and decceleration commands
- The results of the electric vehicle design for given drive cycle FTP75 is shown below
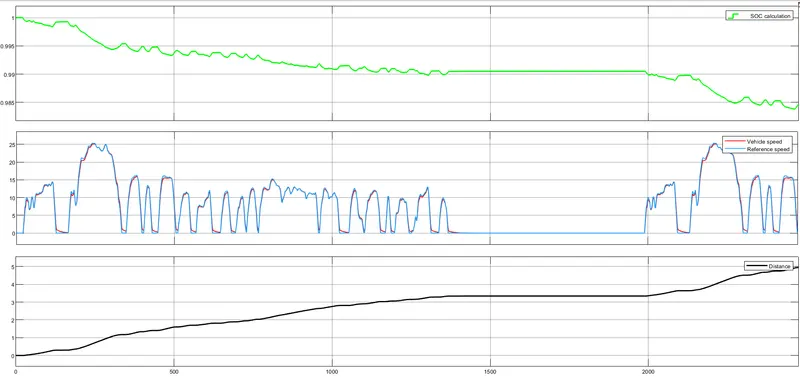
- Graph 1: It represents the State of charge of the battery of electric vehicle for the given drive cycle
- Its oberved that almot 98% of charge remains in the battery after completing the drive cycle
- Graph 2:It represents the actual speed of the vehicle and the reference speed
- It observed that the actual speed of the vehicle is following the reference speed
- But due to inertia of the vehicle ,the decceleration takes more time compared to reference
- A better result can be obatined by fine tuning the controller
- Graph 3:It represents the distance travelled by the vehicle for the given drive cycle
- It observed that vehicle travelled almost 5km for the given drive cycle
CONCLUSION:
- The simulink model of electric car using battery and DC motor is designed
- The model simulated with a defined FTP75 drive cycle source
- The model parameters adjusted in order to achieve the deired ouput
- The battery SOC(state of charge) and the speed performance with repect to the drive cycle is analysed
- The total distance travelled by the electric vehicle also calculated