Final Project: Design of an Electric Vehicle
Introduction
The electric vehicle's energy conversion efficiency is more than the energy conversion efficiency of a conventional vehicle. The battery is going to be an efficient source of power. The model simulation will provide batteries' behavior, and we can also observe how breaking will charge the battery. Making a Simulink model has a lot of advantages. Before going for a real hardware model, we can observe and validate system key parameters inside a simulation to know how the system will function? Below simulation model will give you an idea about how electric vehicle components are arranged and how we can achieve optimal performance?
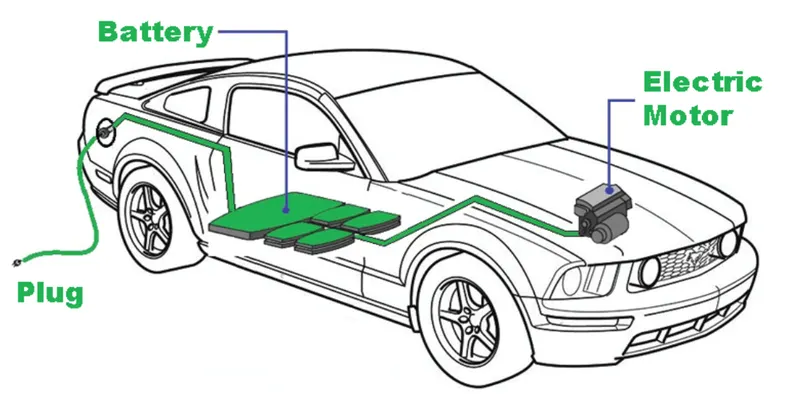
Block Diagram of the System
There are several components and a vast network of connecting wires in the electric vehicle. In the case of an electric vehicle, the conventional IC engine is replaced by the motor. The working fuel that is the battery pack is supplied to the motor. The below block diagram will show significant components of the Electric Vehicle system.
Block Diagram of the System
The key components of electric vehicles are the motor, vehicle body, controller, and battery pack. There are several types of motors used in Electric Vehicles. BLDC motors, Brushed DC motors, and AC Induction Motors are commonly used electric motors. The vehicle body includes a gearbox, differentials, and tires. Earlier, we used the battery just to start the engine. But now we are using the battery as a working power. Combinations of cells will create a module, and many modules will form a battery pack together. The motor needs a power supply from the battery to perform operations. Suppose we connect the battery pack directly to the motor. In that case, the motor will run at a rated speed, and speed control is not possible. We can control the speed of the motor with the aid of the controller. The controller will operate by taking input from the driver
Simulink Model
I have divided the entire simulation system into four subsystems. The first subsystem contains the vehicle body. The second subsystem contains the motor and controller circuit. The third subsystem contains the driver input, and the fourth subsystem contains the battery pack.
Vehicle Body Subsystem
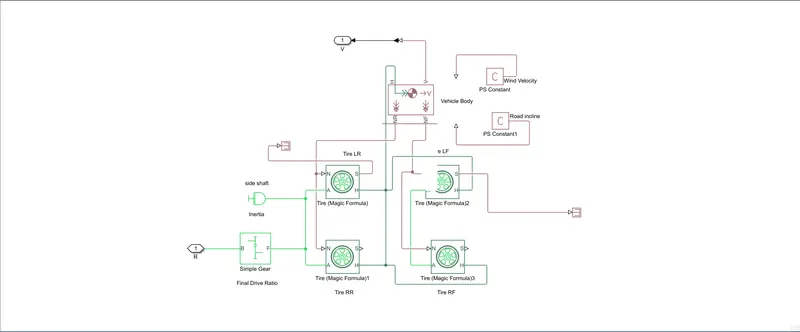
First, I've developed a vehicle body subsystem. I have included tires, differential, gearbox, and vehicle body blocks from the Simscape library in the vehicle body subsystem. We can change the block parameters as per our requirements. Connect tires, differential, gearbox, and vehicle body blocks to each other to make the first subsystem.
#Drive Cycle Data:
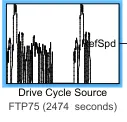
The Below Drive cycle Source We used for the simulink Modelling.
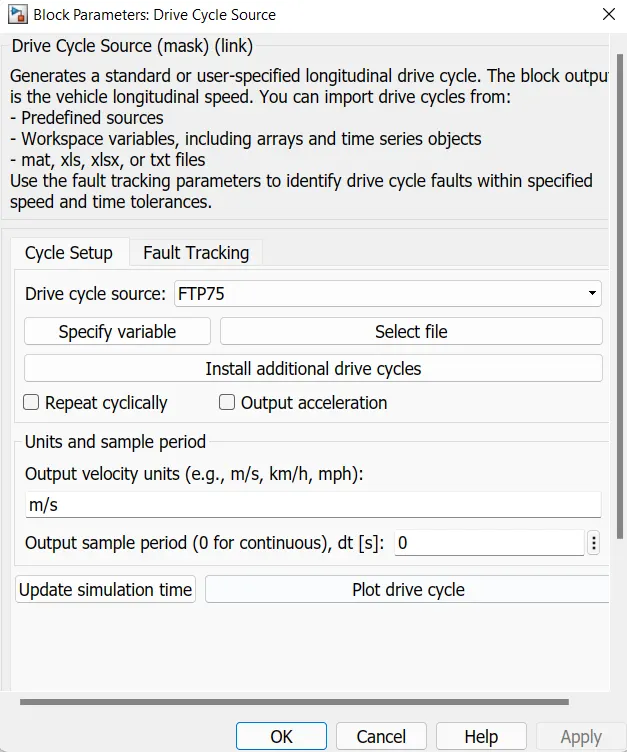
The Block Parameter is Show in Below :
A driving cycle is a series of data points representing the speed of a vehicle versus time. Driving cycles are produced by different countries and organizations to assess the performance of vehicles in various ways, as for instance fuel consumption, electric vehicle autonomy and polluting emissions.
This block is help us to inputting the drive cycle to modelling for this model we have used FTP 75 drive cycle which built in this block.
Motor Circuit and Controller Subsystem
The motor will take controlled power from the battery and convert electrical energy to mechanical energy. The mechanical energy produced is supplied to the gearbox and mechanical rotational frame. To make the subsystem, I have added the motor circuit and controller block from the Simscape library. I have used a simple DC motor, and to control the DC motor, I have used an H-bridge controller. With the help of an H-bridge controller, I can apply acceleration, deceleration, and breaking. To control the PMW wave, I have added a controlled PWM voltage block. We can change the block parameters as per our requirements.
The below diagram will show connections between each block to make a subsystem.
#DC MOTOR:
The Basic Work of motor is convert the elcctrical power into mechanical power .In these EV model we used DC Motor.
These motor is acting as genrator in the case of Regenerative Breaking .
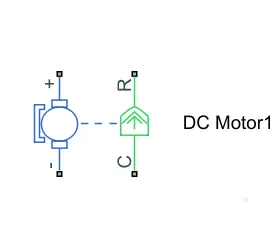
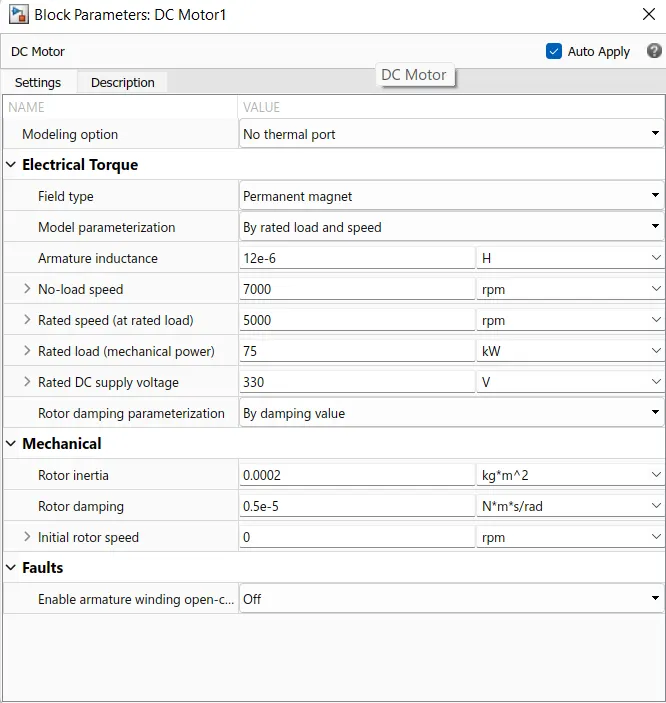
The above block shows the Parameters we used for modeling.This block represent Electrical & Torque characterstics of DC Motor.
# H-Bridge:
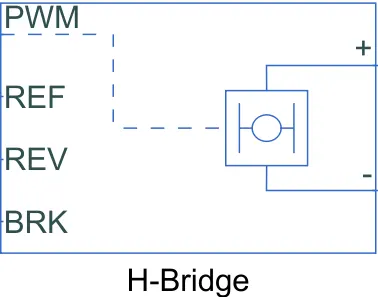
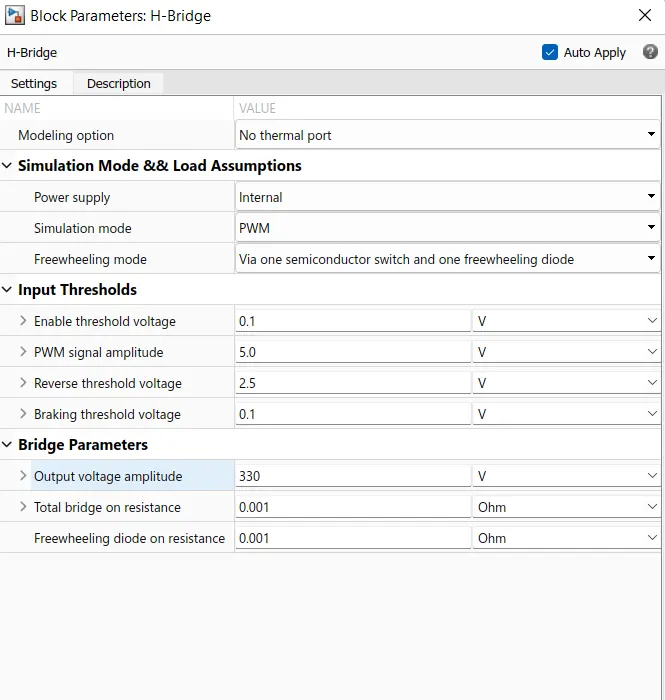
An H-bridge is used to drive a load, such as a brushed DC motor, in both directions. And it controls the flow of current to a load.
The use of H-Bridges in DC Motor control is simple and an easy way to control the direction and speed of a DC motor. The real challenge lies in choosing those Integrated circuits and power supply that are rated to handle the voltage and current the motor would draw.
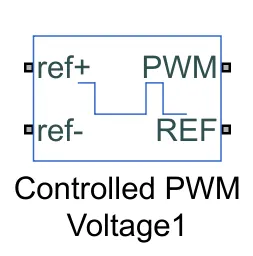
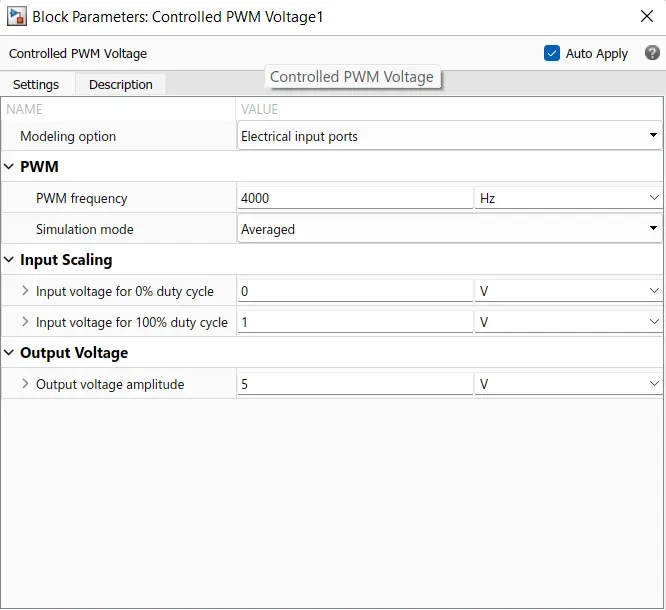
# CONTROLLED PWM VOLTAGE:
The Controlled PWM Voltage block represents a pulse-width modulated (PWM) voltage source.
PWM stands for Pulse Width Modulation and is a square wave signal. The signal alternates between +12 Volt and -12 Volt with a frequency of 1 kHz. Via this communication signal the charger can detect the presence of the EV and the charger can mandate the maximum charge current an EV is allowed to consume
Driver Input Subsystem
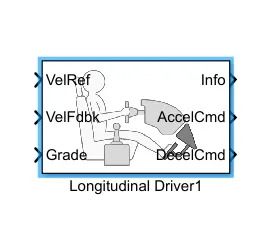
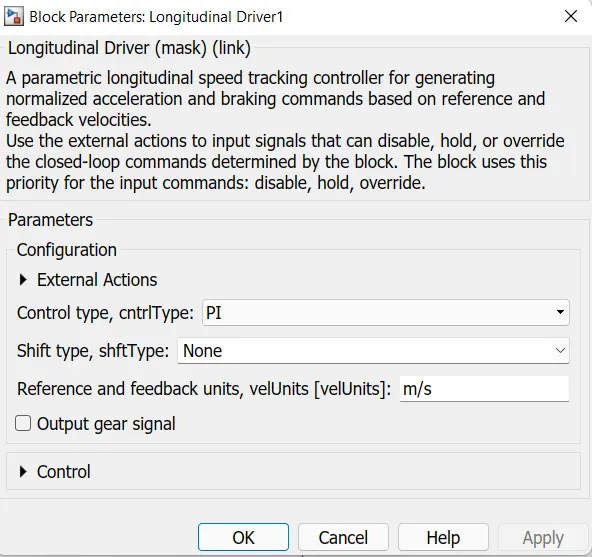
Longitudinal driver block from the powertrain block library produces normalized acceleration and braking commands based on reference and feedback speeds. Reference velocity will be given by the built-in drive cycle or we can generate our own signal by using the signal builder block. Feedback speed will be taken from actual vehicle speed. Based on the difference between the reference signal and the actual speed error will be generated. The error produced will result in acceleration or deceleration so that the vehicle's actual speed will try to match the reference speed.
I used the Longitudinal block and Signal Builder block to create the Drive Input Subsystem. The diagram below shows the connection between the blocks.
Battery Pack subsystem
The battery pack will provide power to the motor. Calculation of State of Charge (SOC) would give us information about how much we can drive before recharging and how much time we can use an existing battery. I have used a lithium-ion battery to check the SOC percentage directly. Battery charging and discharging we can examine with the help of SOC. The below diagram will show connections between each block to make a subsystem.
Overall Model
Add powergui block to Simulation. Add scope and display block to examine outputs and behavior of the Electric Vehicle model. With the help of the signal builder block, I have created a reference signal. The reference signal and actual speed on the same graph will explain how the feedback loop is working. We can also calculate the average speed of the electric vehicle. With the SOC graph's help, we can analyze battery charging and discharge during deacceleration and acceleration command, respectively.
The below diagram will show the overall Electric Model that I have used to examine the vehicle's SOC percentage and average velocity.
Results
First, with the aid of the signal builder block, I have created reference speed. I have selected a top speed of 100 kilometers per hour. I've been simulating the model for 1,000 seconds. The speed increases for the first 400 seconds. The speed remains constant for the next 200 seconds, and the speed decreases for the remaining 400 seconds. The below Image will display the reference signal that I generated with the signal builder block's aid.
Generated Input Signal
Suppose we look at the graph of the SOC percentage. In that case, the battery will be discharged non-linearly for the first 400 seconds, discharged linearly for the next 200 seconds. For the remaining 400 seconds, the battery will be charged and discharged according to feedback.
Graph of SOC %
The below graph will show how the vehicle's actual speed is following the reference speed of the input drive cycle.
Actual Speed and Reference Speed on the same Graph
Suppose we calculate the average speed for 1,000 seconds. In that case, it is approximately equal to the average speed that we got on the graph.
Conclusion
We have examined the SOC percentage and speed graph. The SOC percentage graph indicates that the battery is discharged when there is an acceleration command. The battery is charged when there is a deceleration command. The Speed graph shows that the actual speed tries to meet the reference speed by considering feedback. The model shows that the electric vehicle has traveled approximately 14 kilometers in 1,000 seconds. If we measure the average speed, the vehicle will travel approximately 50 kilometers per hour. This measured average speed is approximately equal to the average speed found on the graph. Here are some applications from this blog:
- Conventional fuel has a high calorific value than batteries. Still, the battery conversion efficiency is more than conventional fuel. If we use hybrid technology, it would have a lot of potential and efficiency.
- In the future, we can make electric vehicles powered by solar energy.
- If we can replace current fuel-based transport with electrified transport, this would create an enormous advantage for the ecosystem.
- Ultra-charging stations and the battery processing technology will have many advantages. It will have a significant effect also on the development of electric vehicles.