Final Project: Design of an Electric Vehicle
MODELLING OF AN EV USING MATLAB AND SIMULINK
The block diagram of an EV is shwon in the given below :
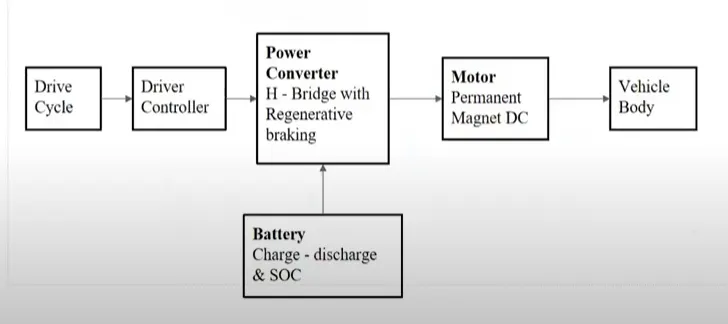
DRIVE CYCLE : This part of the EV block diagram is the one which supplies input to the EV . we can use various types of drive cycles for the EV.
DRIVER CONTROLLER : This component receives the input from the drive cycle and then produces the necessary feedback so the vehicle can move according to the input.
BATTERY : The energy source for the EV
POWER CONVERTER : The received voltage froM the Energy source will be fed into other parts of the EV according to the requirement with the hep of the Power converter .
MOTOR : The device which helps in rotation of the wheels or propulsion of the vehicle .
VEHICLE BODY : OUTPUT from the motor is received here and the all the forces acting on the EV are also taken and according to the driving a cycle a feedback is given .
Intially we start with the drive cycle block :
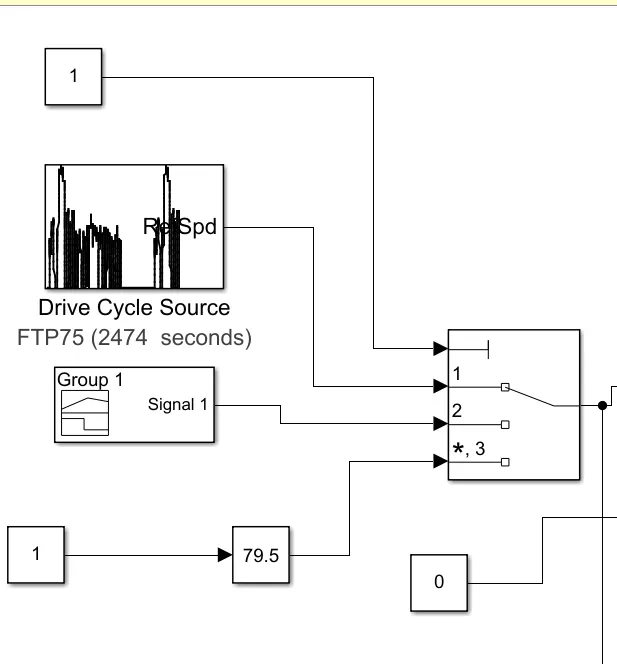
Here we have taken 3 kinds of input which is fed into the EV .
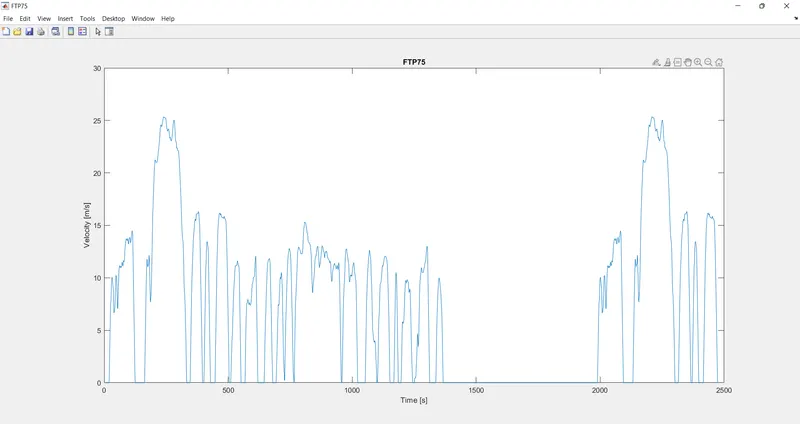
1. FTP75 Drive cycle block which is having the default values .
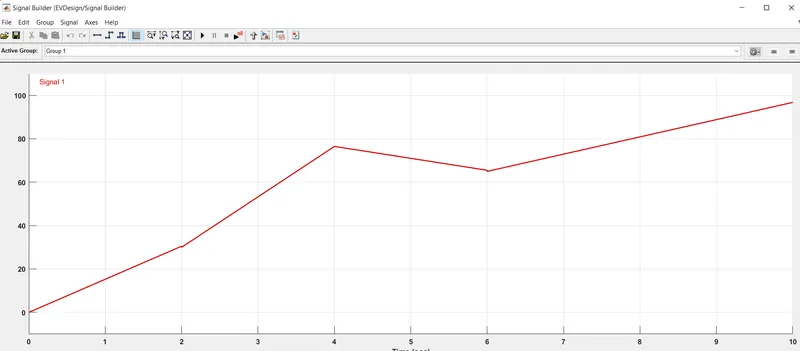
2. A signal builder block which has the following custom signal which is the input
3. A Slider gain is utilised so that any speed in the range of 0 - 120 can be set according to the user .
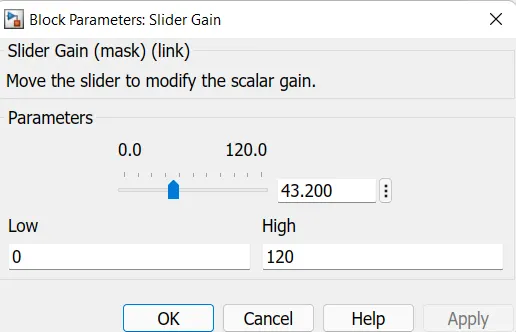
All these inputs are fed into the Multiport switch , with the help of which one of these can be selected and fed into the EV . A Constant block is used , so that any one among these can be selected according to the given input
DRIVER CONTROLLER :
The output from the drive cycle via the multiport switch is delivered to the drive controller . The output of multiport switch is connected to the VelRef port . The VelFdbk port carries the feedback from the vehicle . We assume here that the vehicle is running on a Straight road with no elevation . So the Grade factor is zero.Hence a constant block with value '0' is given into Grade port . Both AccelCmd and DecelCmd are the output signal given for accelerating and braking for the vehicle .
We use a Longitudinal Drive block here which plays the role of a driver controller .
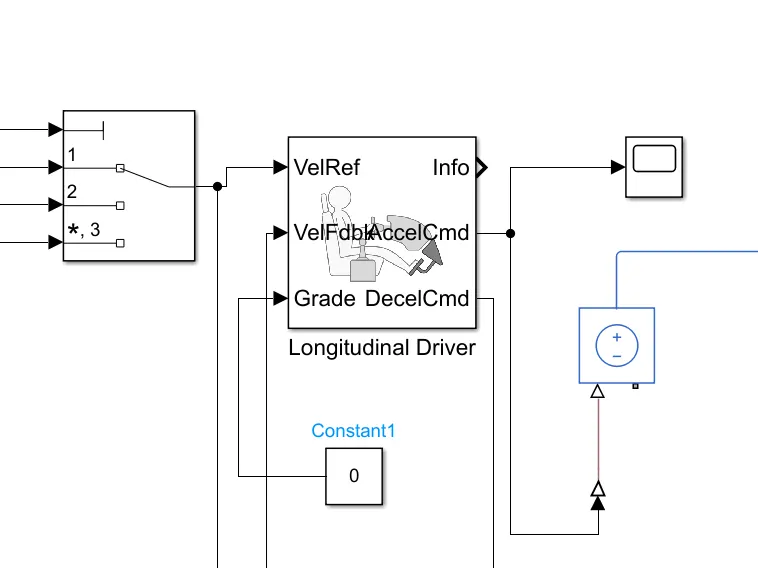
POWER CONVERTER BLOCK :
Here all the input signals are processed and it is fed into the further part of the EV in the required form .
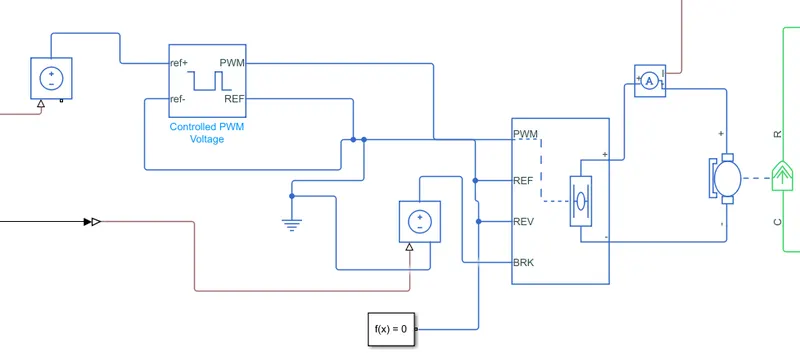
There is a Controlled PWM Voltage block , which is used to represent the PWM voltage source .
Then an H-Bridge block is used which represents the H-Bridge motor driver . It has 2 Simulation mode options :
a. PWM
b. Averaged
Here we use the Averaged Simulation mode so that the Simulation happens faster . Also in the Averaged Mode we select the Smoothened option for the Load current characteristics .
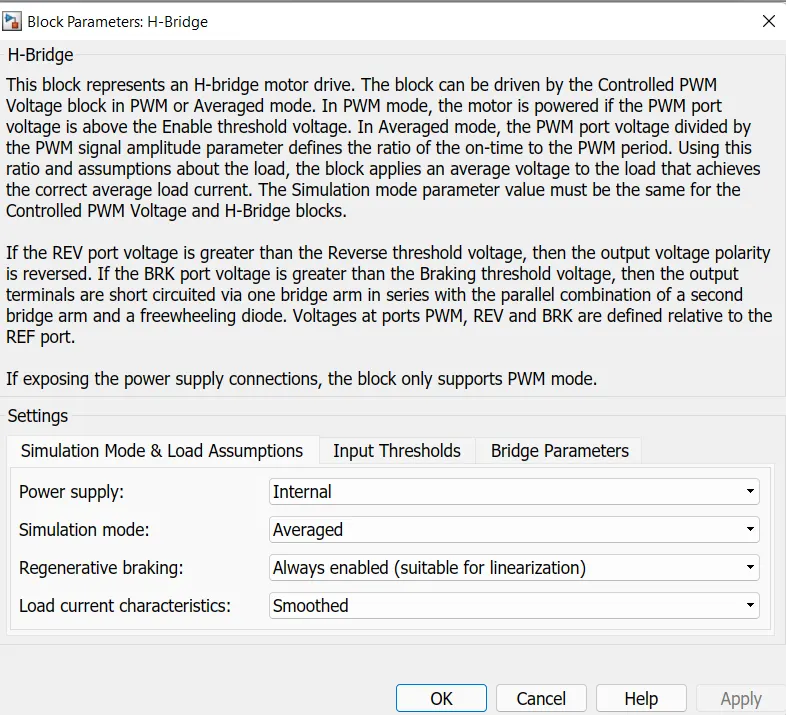
The input parameters of the H-Bridge are taken the default values itself :
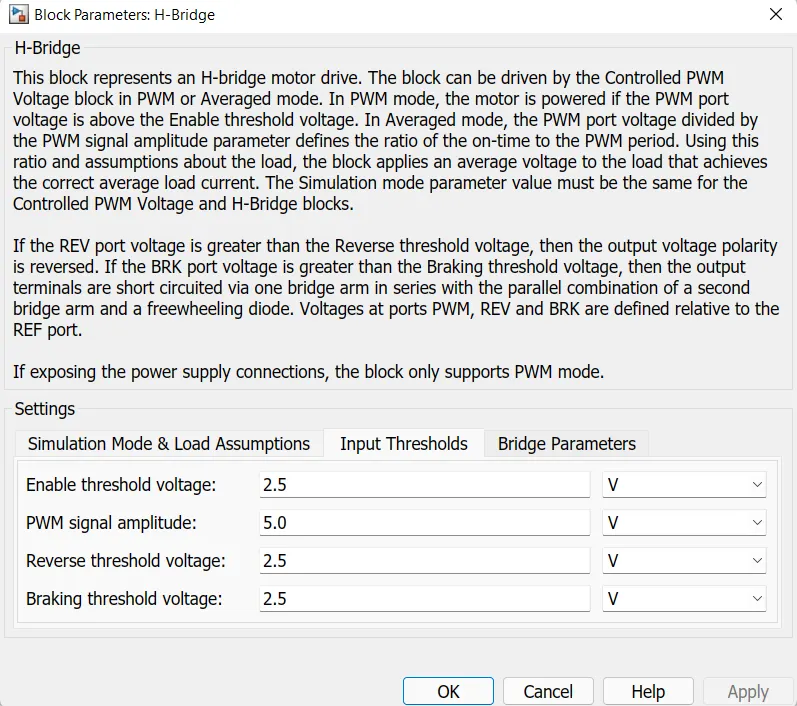
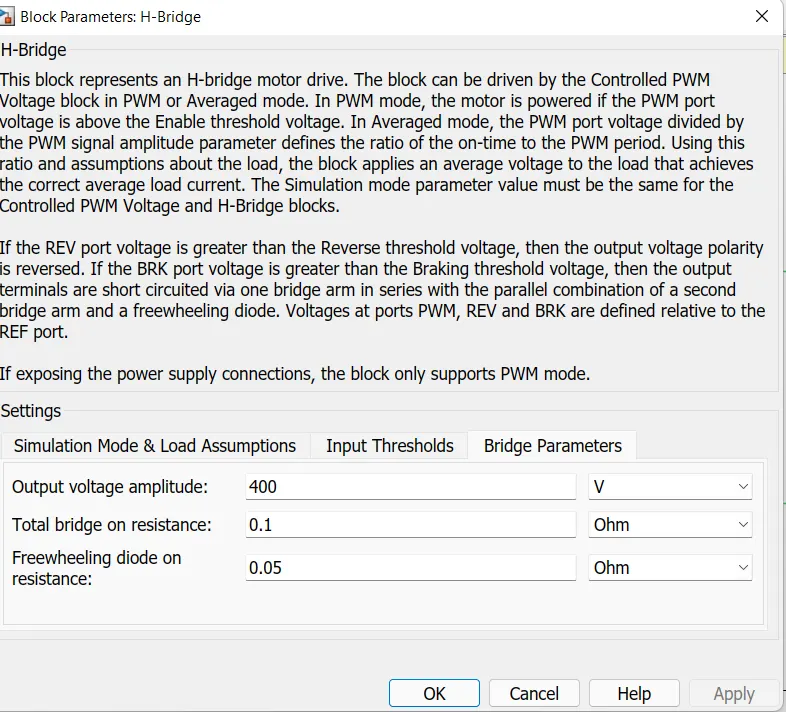
Bridge parameters are also specified according to our requirement
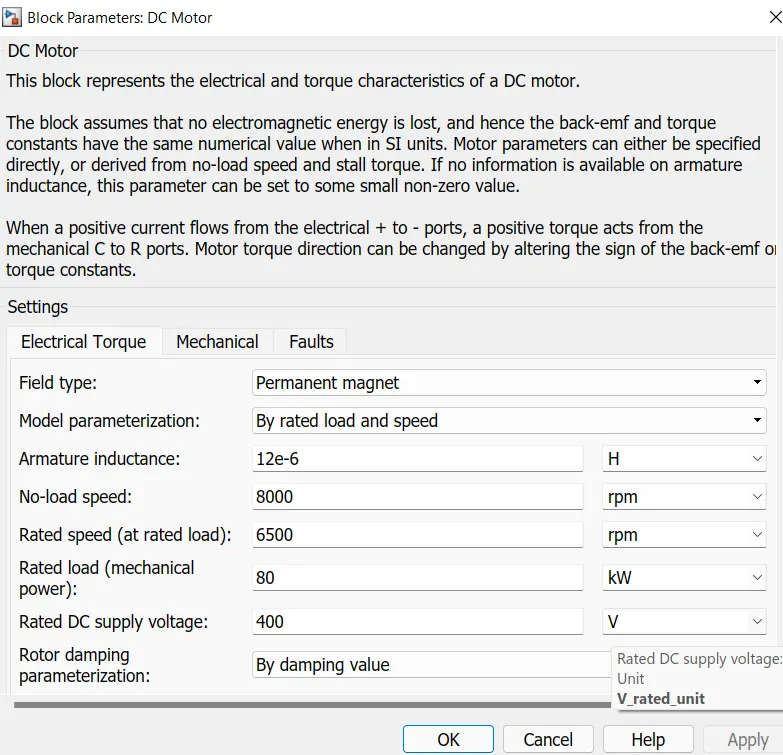
DC MOTOR :
A DC Motor is used for the propulsion of the EV with the following parameters .
BATTERY :
A Simple battery model is used here .
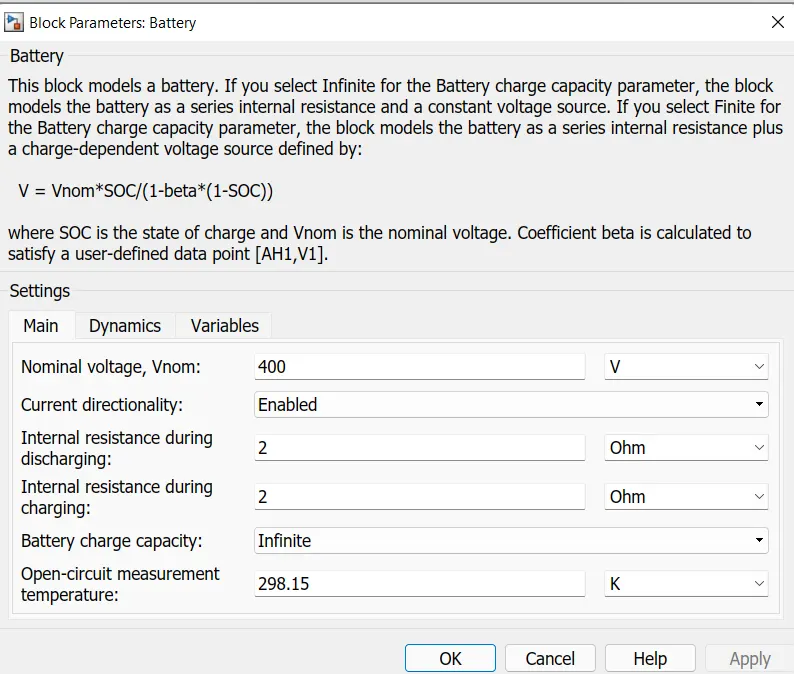
The battery parameters are as shwn in the above figure .
We also use a current sensor block here, which is connected in series with the battery unit and also it has a connection I in it which measures the current . A Mechanical Rotational reference block is added so that a mechanical reference point is added in the system simulation for all the rotational parts . Similarly for all the Electrical parts of the system there is an Electrical reference block .
Solver Configuration : Solver settings are added into a Simscape block diagram for Simulation . This block specifies all the parameters required for your model before simulation .
VEHICLE BODY :
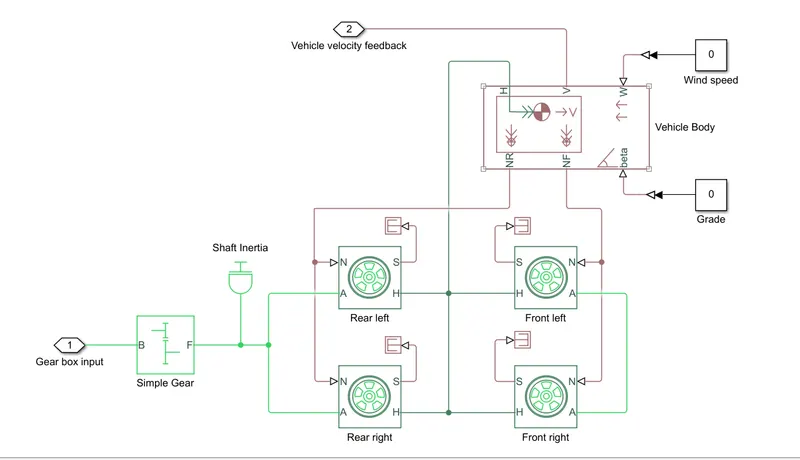
A subsystem is created for the vehicle body seperately ; it includes the following blocks inside
a. Vehicle body : A Vehicle with the following parameters are added into the system
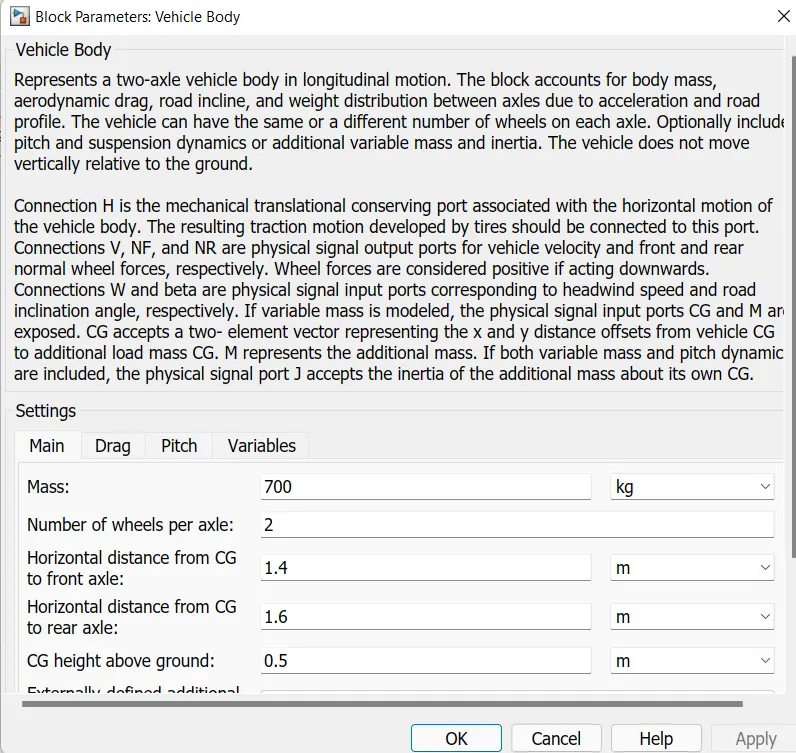
The mass of the vehicle , the number of wheels per axle etc are included in this block , which can be customized as per the requirement of the user .
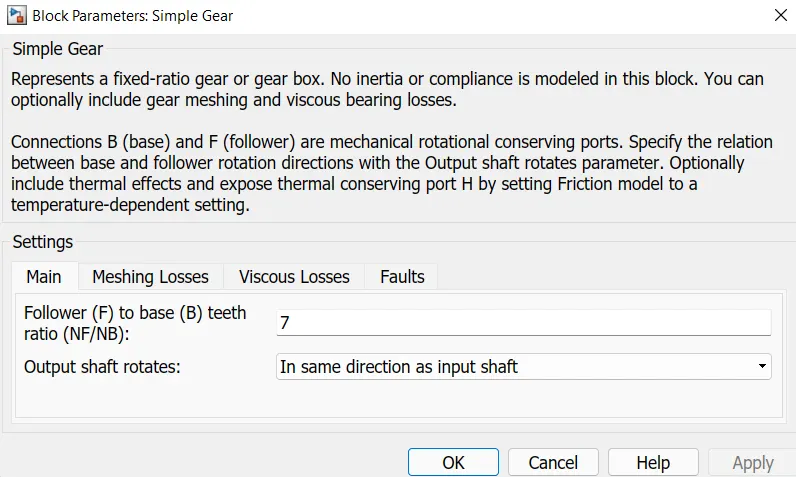
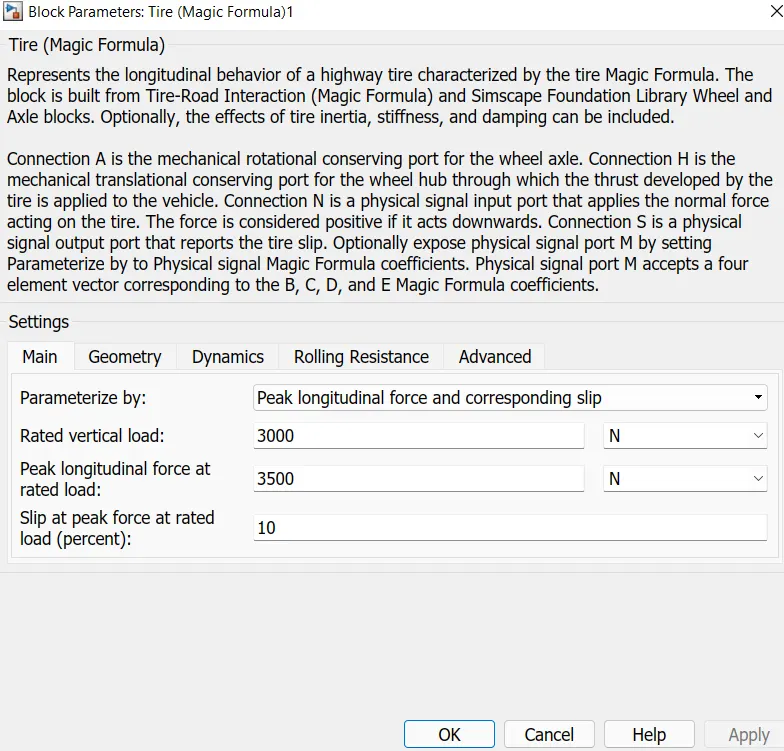
A Simple gear box is used here in this model . It is connected to the axles of the rear tires . The other two front tires' axles are connected together seperately . The rear axle is hence connected to the motor via gear. The tire block used here is configured with the Magic Formula for the Longitudinal behaviour . This longitudinal direction of the wheel will be same as compared to the direction of motion of the vehicle .
STATE OF CHARGE : .
The voltage level in the battery at each point of the simulation can be determined by this SOC Block .The output of the current block is fed into this SOC block. We have created a subsystem to find out SOC .
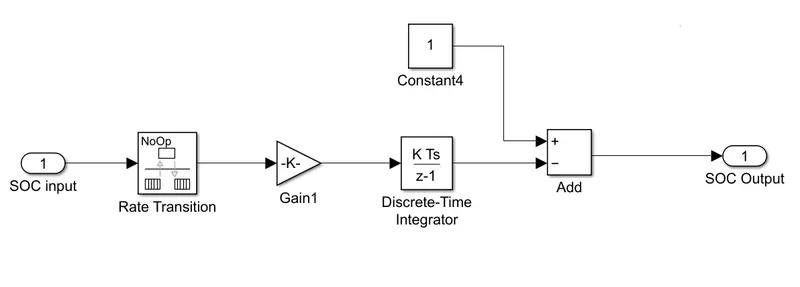
The SOC Subsystem contains : a rate transition block , a gain block , a Discrete Time integrator , a constant block and an add block .Using all these blocks the battery voltage at each drive cycle will be displayed in the scope .
The output from the Vehicle Body block is velocity . This velocity will be sent as feedback to the longitudinal drive block . Distance is then deperately calculated using an integrator and then dividing it by 3600 to convert it into kilometer form .
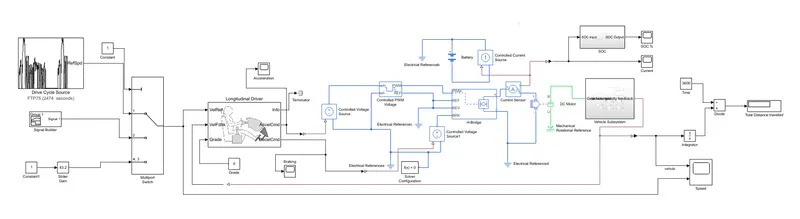
The final Simulation model of the EV is as given in the following diagram :
RESULT :
So now we look upon the results. We have given 3 inputs in this case .
Initially the Drive cycle of FTP75 is taken as the input to the EV .
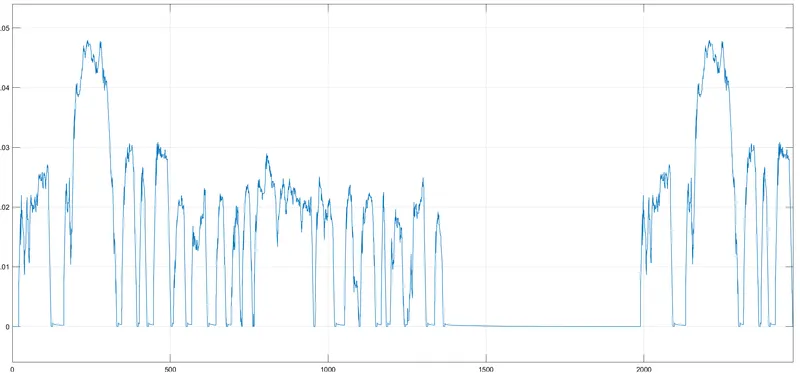
The acceleration scope output :
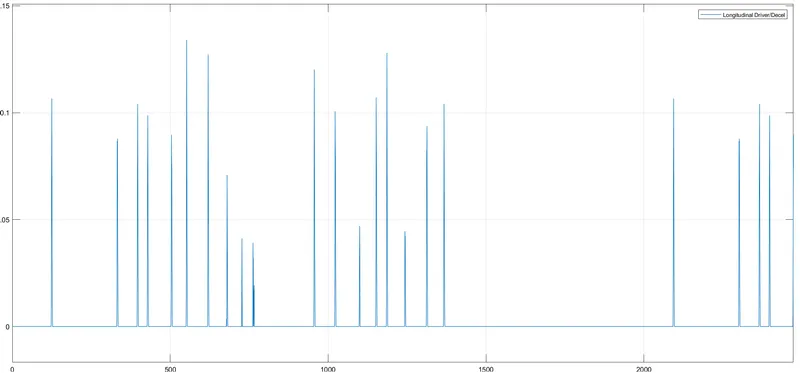
The deceleration output :
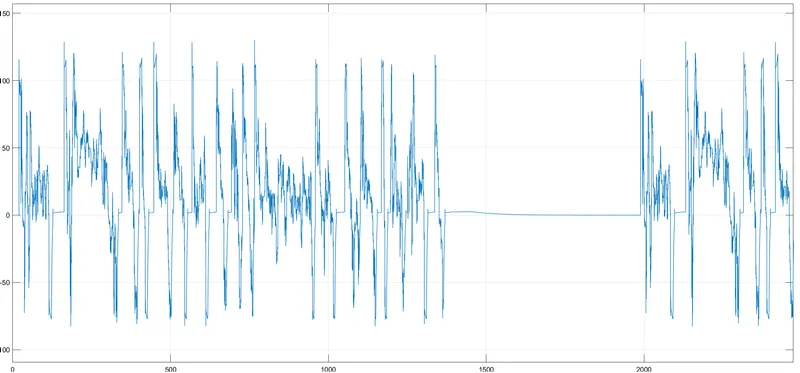
Battery Current :
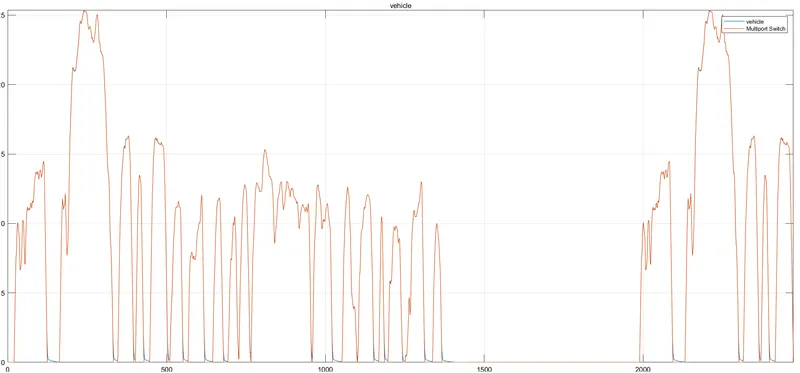
Speed Output :
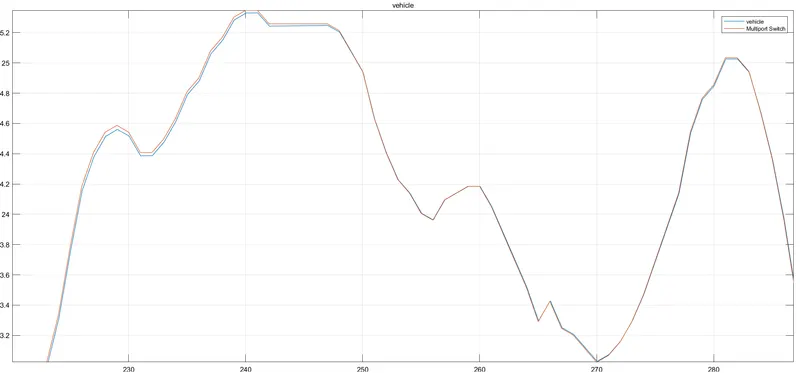
When we zoom into the Speed time plot we get the following graph :
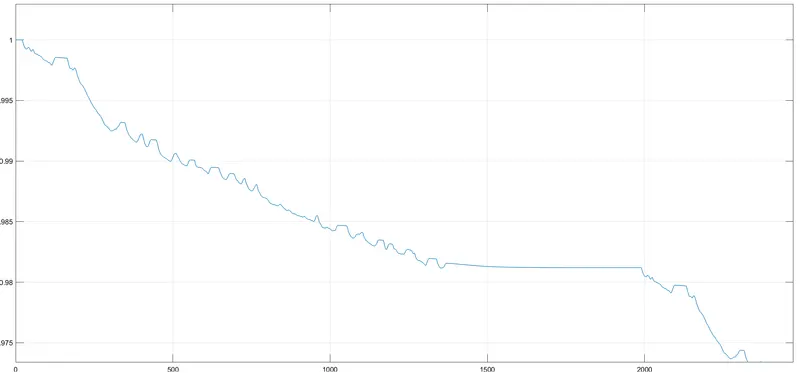
SOC % :
The total distance travelled by the EV For this Drive cycle is 4.958 km
CASE 2 :
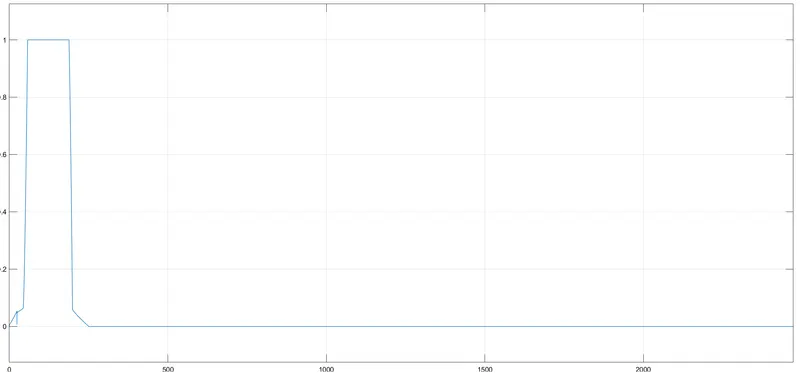
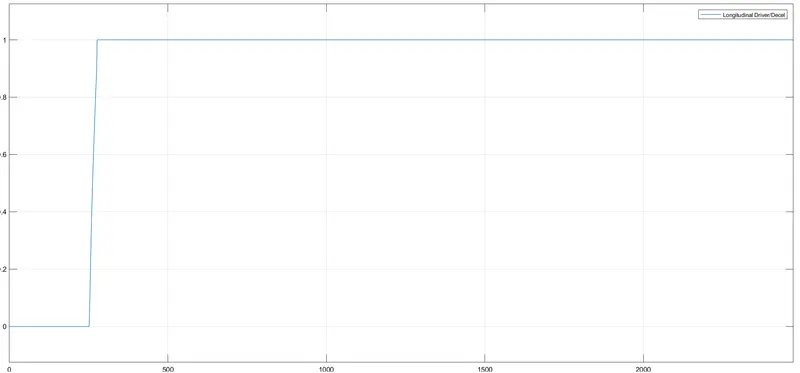
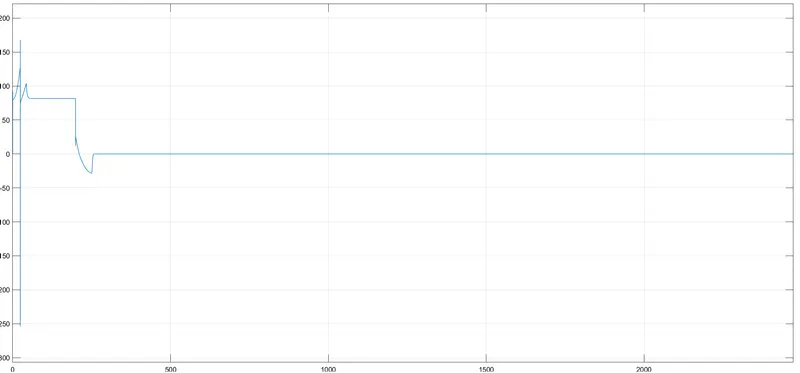
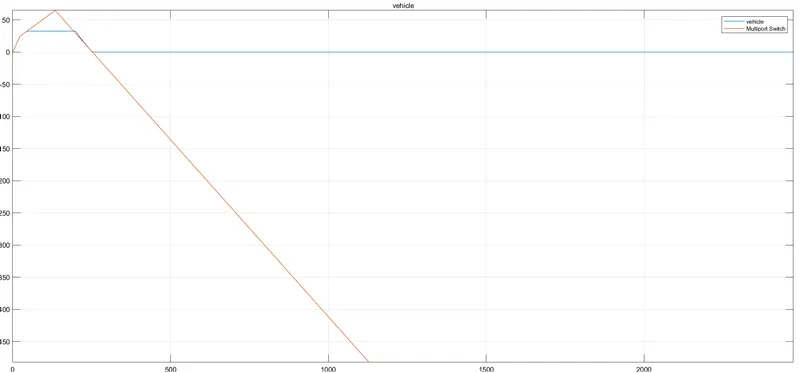
With the signal builder we get :
Acceleration output :
Deceleration output :
Batter current :
Speed :
SOC % :
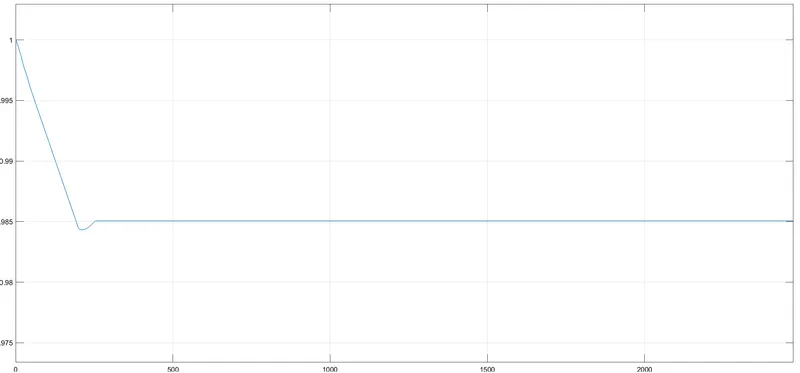
The total distance travelled here is calculated as 1.886 km .
CASE 3 :
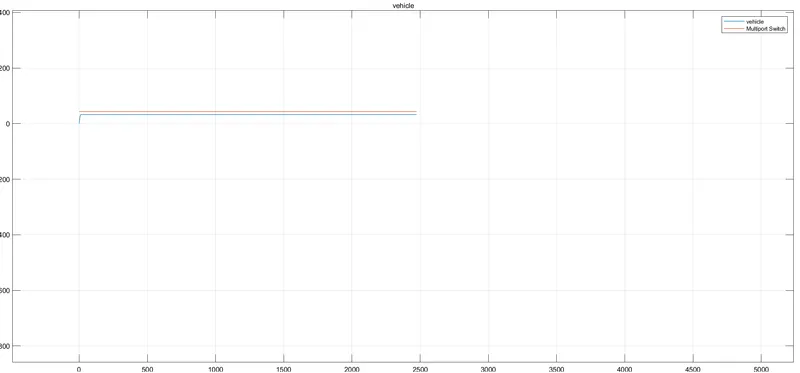
The slider gain input is fed into the EV in this case :
Deceleration :
Battery current :
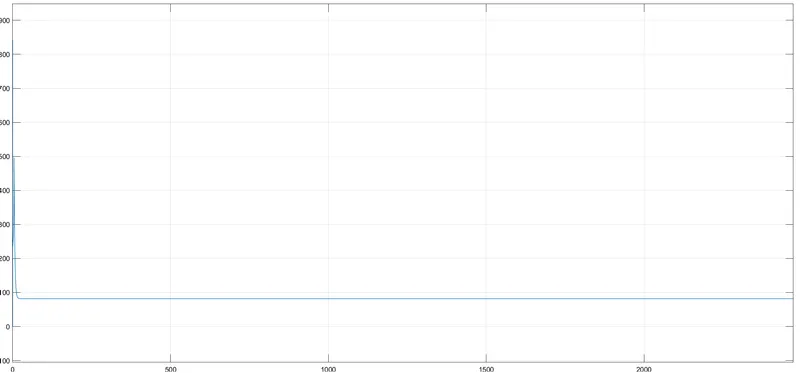
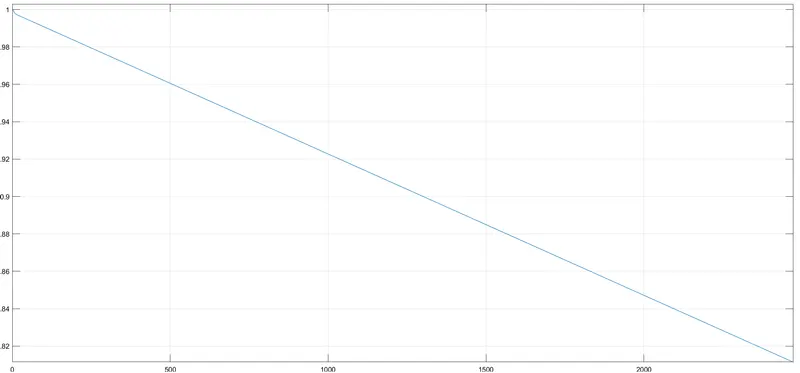
SOC % :
Speed :
Distance travelled by EV in this cycle is 22.43 km
CONCLUSION :
In the Speed plot , we can see two graphs which represent the Feedback speed plot and the reference speed plot . Most of the regions they overlap each other , but in some places we can see a significant difference . This is when the vehicle is in the deceleration . This overlapping doesnt happen always because of the inertia of the vehicle which doesnt allow it to do the quick reverssal of the speed of the vehicle .
From the SOC plot we can see the difference in the battery state during each type of drive cycle , and in the third cycle it is seen that there is a drastic and sudden decrease in the SOC of the battery . When accelerating the SOC Reduces and when deceleration takes place we can see the improvement , this is because regeneration is happening for the battery and the SOC can be hence seen improved .