Final Project: Design of an Electric Vehicle
Create a MATLAB model of electric car which uses a battery and a DC motor. Choose suitable blocks from Powertrain block set. Prepare a report about your model including following:
Objectives:
1. System level configurations
2. Model parameters
3. Results
4. Conclusion
Solution:-
What is an EV or Electric Vehicle?
An EV or an Electric Vehicle is a vehicle which is operated by an electric motor instead of an IC Engine which is operated by either of these fuels’ petrol or diesel. The major difference between an EV and IC Engine vehicle is the type of fuel which is used in an EV is operated by the electric motor with the help of electricity which comes from the storage i.e. the battery pack whereas an IC Engine vehicle is operated by mixing fuel(petrol or diesel) with air to produced the output to run the vehicle. An EV does not gives out any emissions like NOx,CO etc. as the electricity is coming from battery pack whereas the IC Engine vehicle emits lot of gases like NOx,CO etc. as the fuel and air are used for combustion which are very harmful to humans as well as the environment. The demand for EV has increased a lot to overcome this challenge as the substitute for IC Engine vehicle would be EV which can match the performance of an ICE vehicle. An idea of an EV has come to existence since from 19th century itself, the development of semiconductor and electronic devices from the past decades has made to opt and develop EV to match the performance of an ICE vehicle.
Model of Electric Vehicle(EV)
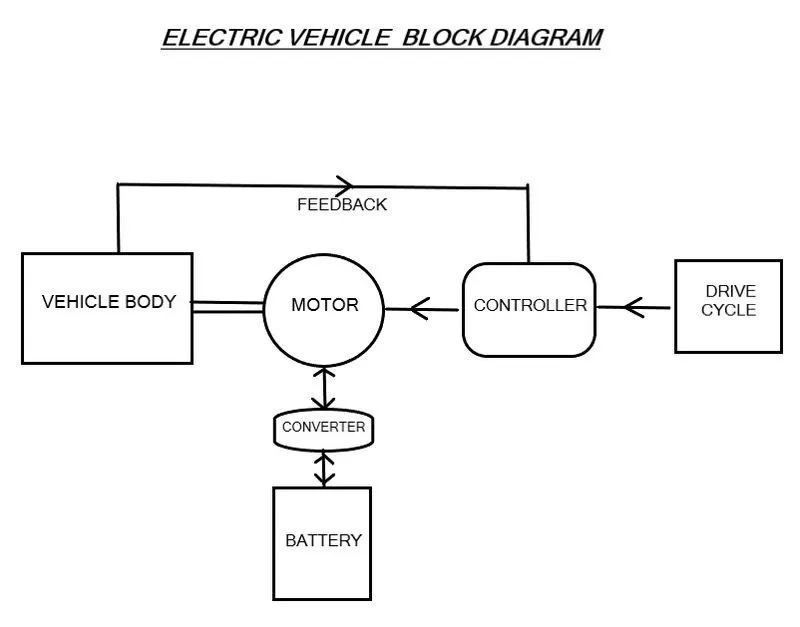
The block diagram of an EV it consists of the Vehicle Body, Electric Motor, Controller, Battery, Drive Cycle. The Vehicle Body consist of the body of an vehicle in which the Area parameter consider to define the vehicle dynamics of an vehicle, an electric motor block consist of the motor which will be used to propulsion, the controller block consist of the controller which is used for the controlling of motor for acceleration and deceleration of the vehicle a feedback system is been designed between vehicle body and the controller, a DC-DC converter block consist of DC-DC converter it is the intermediate component between the motor and the battery it is used to convert the DC voltage from the battery to desired value of the DC voltage on which the electric motor is operated, the battery block consist of battery pack which is used to supply the electric current when were required it is the one of the most important component of the EV, the drive cycle block is used for simulation to calculate what can be the average speed of the vehicle, the amount of battery SOC, the amount of distance a vehicle can travel it is bascially a velocity & time graph used for simulating different parameter of the vehicle.
SIMULINK MODEL OF ELECTRIC VEHICLE
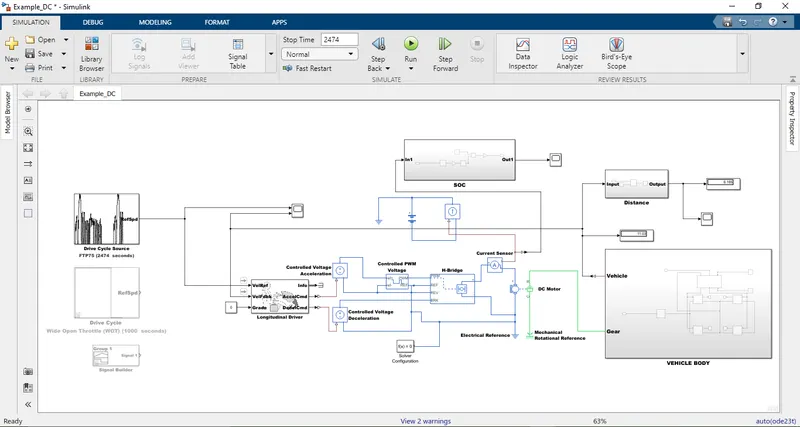
-- We can observe the Simulink Model of an EV, the Model is basically modelled by using different blocks i.e. a Vehicle Body in which the Body and Tire connection are made, a Battery SOC block where the amount of battery left after travelling is calculated, the distance block is used to convert the speed of vehicle, the DC motor is connected with the H-Bridge and the H-Bridge is connected with the Controlled PWM Voltage block, a current sensor is used for the current supply in the simulation, a longitudinal driver block is used for the acceleration and deceleration of the vehicle which is been connected with the Drive Cycle. The Drive cycle block gives the input signal to the driver block which in turns follows the path in which the vehicle is propelled.
Subsystem Configuration:-
1. The Vehicle Body
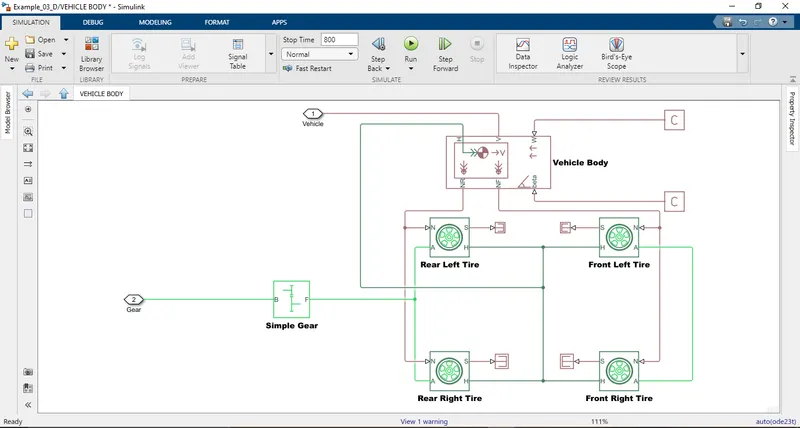
The Subsystem is model using "Vehicle Body" & "Tire(Magic Formula) blocks.
Vehicle Body:
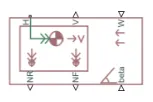
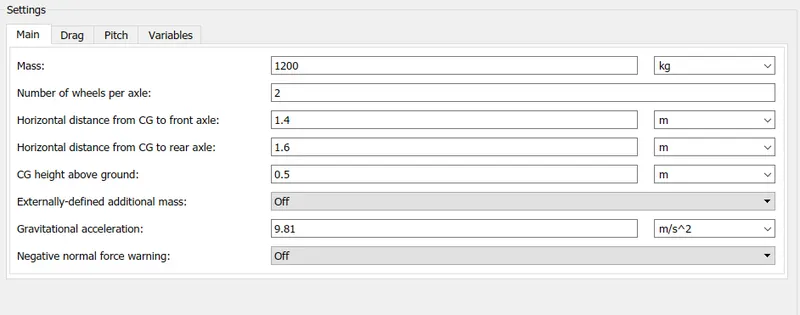
This blocks represents the vehicle body with two axle i.e. front axle & rear axle. The block has 6 number of output ports, Port NR & NF represents the Rear & Front axle normal force of the vehicle the axle of the rear & front axle force from the tire are connected respectively. Port H represents the Wheel Hub of the vehicle all the Hubs of the tires are connected to this port, Port V represents the velocity of the vehicle this the output port which is connected to the Velocity Feedback port of the Longitudinal Drive block. Port W represents the wind velocity which is kept constant for the simulation, Port beta represents the Gradient angle through on which the vehicle is moving we have kept it constant for the simulation.
Tire(Magic Formula):

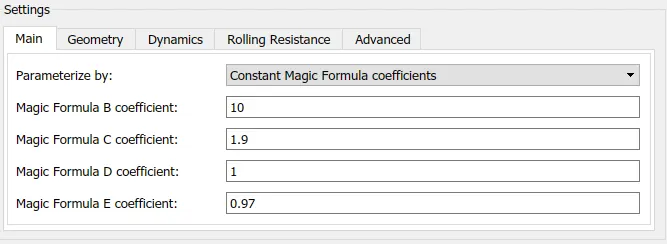
The block represent the Tire of the vehicle which are connected to the vehicle body respectively, the Tire block which is been imported uses tire Magic Formula. The tire parameter are set Constant Magic Formula Coefficients which has B Coefficient, D Coefficient, C Coefficient, E Coefficient. All the parameter values are set to default. We have imported 4 numbers of tire blocks in which two blocks represents Front tire and other two blocks represents Rear tire. Port N represents the normal force which is then connected to Port NR & Port NF of the Vehicle Body, Port A represents the axle of the vehicle rear axle of the rear tire are connected together which are later connected to the Simple Gear block whereas the front axle of the front tire are connected together. Port S represents the slip of the tire which we have eliminated, Port H represents the Wheel Hub the Hub of all the tire block are connected which is later connected to the Hub of the Port H of the Vehicle Body.
Simple Gear:

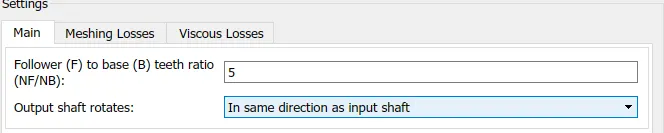
The block represents a fixed gear or gear box which is used for our simulation, Port B represents the base which connected by the Port R of the DC Motor block. For our simulation we have assumed the output shaft rotates in the same direction as the input shaft. The simulation is carried out of the rear-wheel-drive vehicle so the rear axle of the vehicle is connected to Port F.
The subsystem of Vehicle Body has two Ports Gear & Vehicle.
MOTOR AND POWER CIRCUIT
DC Motor:

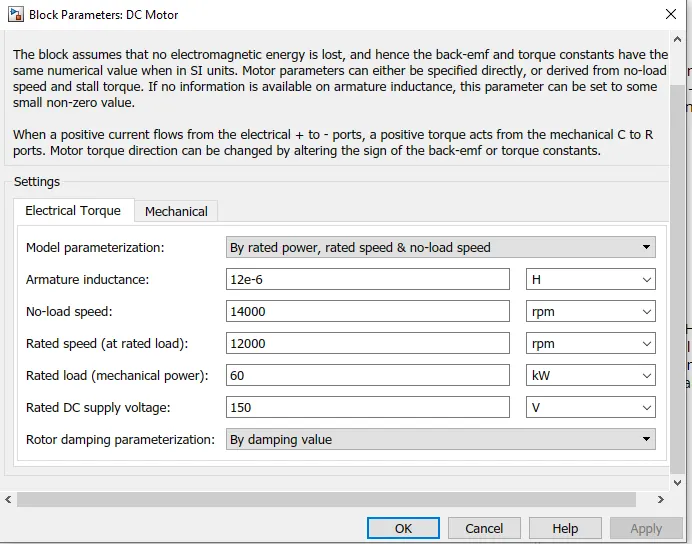
We have imported a Brushed Type DC Motor for our simulation, the DC Motor block has four ports. Port R represents the motor rotor which is connected with the Simple Gear block, Port C represents the motor case which is stationery and it is connected to Mechanical Rotational Reference, Port + is the positive terminal of the motor which is connected to the controller in our simulation is H-Bridge whereas the Port - is the negative terminal of the motor which is grounded and it is connected to Electrical Reference. The parameter value is set By rated power, rated speed & no-load speed, we have taken a 60KW motor for the simulation.
H-Bridge:

For the simulation we have imported H-Bridge block to control the acceleration & deceleration of the vehicle, the H-Bridge circuit has four switches (MOSFET or IGBT) which are turned on and turned off in a defined pattern (1-3 & 2-4). Port PWM represents the pulse-width-modulation signal through which the voltage value is defined, Port REF represents the floating zero-volt reference, Port REV represents the voltage that controls when to reverse the polarity of the H-Bridge block output, the voltage value is defined with reference to REF port. Port BRK represents the voltage that controls when to short circuit the H-Bridge block output, the voltage value is defined with reference to REF port. Port + is connected to the current sensor positive terminal whereas the Port - is connected to the positive terminal of the DC Motor.
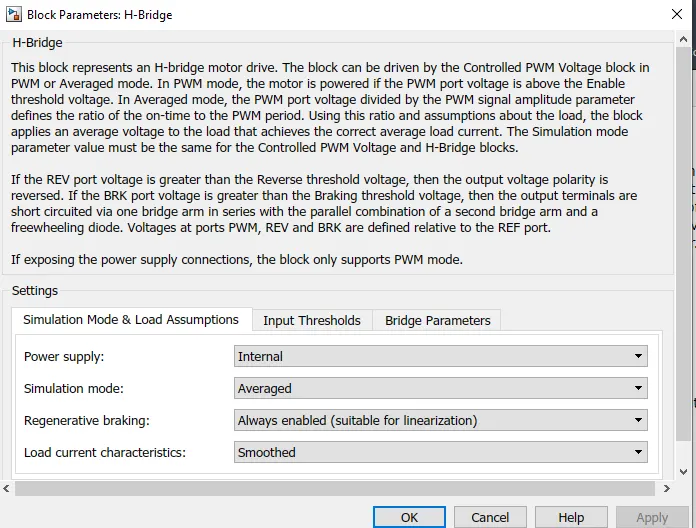
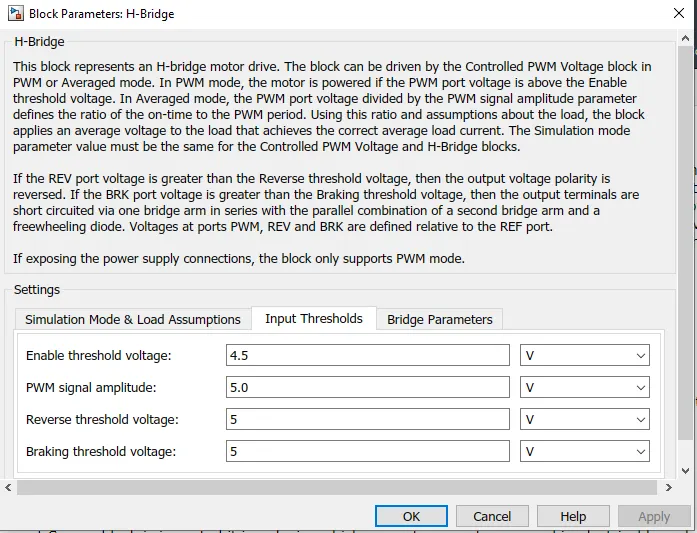
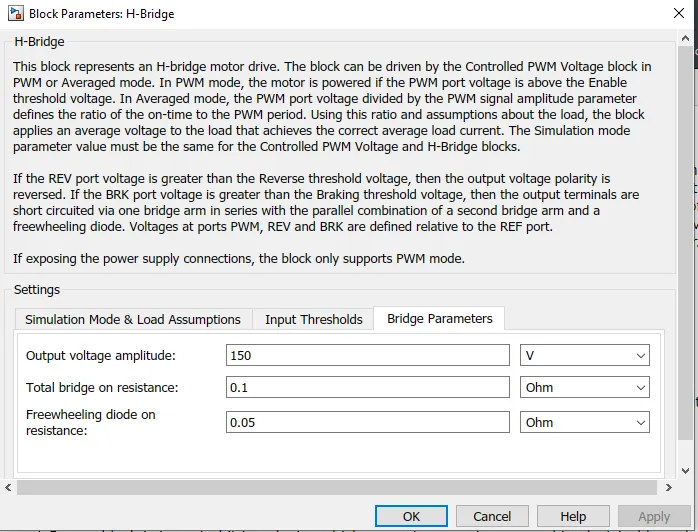
We have set the simulation mode to Averaged and the Load current characteristics to Smoothed, the Output voltage amplitude is set to 150V.
Current Sensor:

The Current Sensor block is imported it is a device which converts current measured in electrical branch into physical signal which is proportional to current for our simulation we are taking this current signal to operate the DC Motor. Port + is the positive terminal which is connected to the positive terminal of H-Bridge whereas the Port - is the negative terminal which is connected to DC Motor. Port I represent physical signal output port for current, the signal port is connected to SOC input port which is converted into SOC percentage.
Controlled PWM Voltage:

The Controlled PWM Voltage block represents a pulse-width modulated (PWM) voltage source, it is imported to control the PWM to be given to the H-Bridge circuit according to the Duty-cycle which is defined. Port PWM represents the pulse-width modulated signal and it is connected to the PWM port of H-Bridge, Port REF represents the floating zero-volt reference which is connected to the REF port of H-Bridge and then connected to Electrical Reference. Port ref+ is connected with positive port of Controlled Voltage Acceleration whereas the Port ref- is been connected to Electrical Reference.
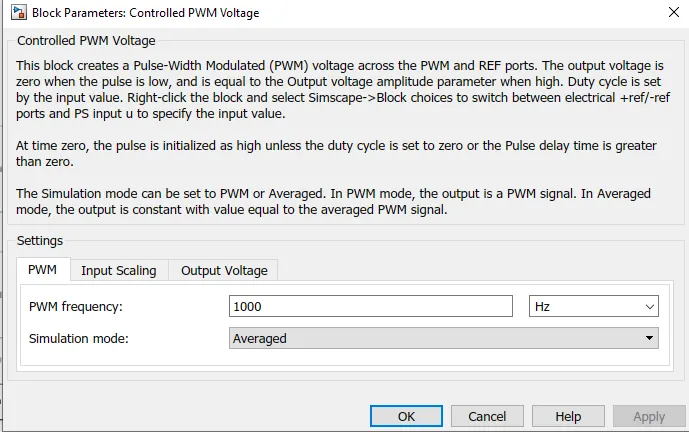
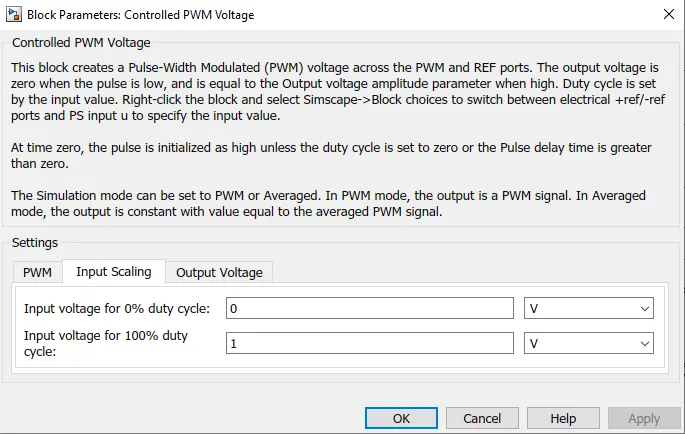
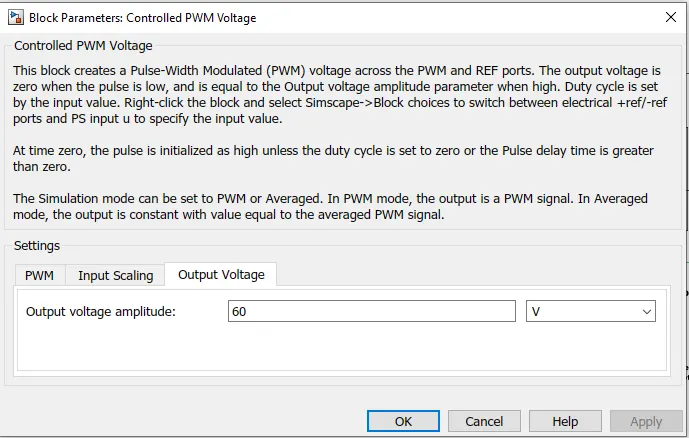
The Output Voltage Amplitude is been set as '60V'.
Controlled Voltage Source:

The Controlled Voltage Source represents voltage source that is powerful enough to maintain the specified voltage at its output regardless of the current flowing through the source. The vehicle acceleration and deceleration command signals are given to H-Bridge via this block which is a defined value. The signal port is connected to AccelCmd & DecelCmd from two different blocks which are used for acceleration & deceleration.
Mechanical Rotational Reference:

It represents a reference point, or frame, for all mechanical rotational ports.
Electrical Refrence:

It represents an electrical ground.
Solver Configuration:

It specifies the solver parameters that your model needs before you can begin simulation.
Longitudinal Driver:
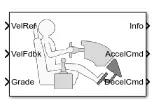
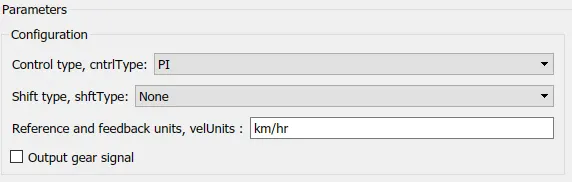
The Longitudinal Driver block implements a longitudinal speed-tracking controller, the block based on reference and feedback velocities it generates normalized acceleration and braking commands that can vary from 0 through 1. The driver follows the Velocity reference (Drive Cycle) according to the time frame it can be m/s or km/hr. Port VelRef represents the drive cycle input which the driver follows and complete it within the time frame. Port VelFdk represents the driver output after the simulation is complete, we can observe the pattern in which the driver followed and can draw out what are the changes that needs to be done to achieve the similar drive cycle. Port Grade represents the grade angle which can be defined as per the simulation. Port AccelCmd represents the driver input for acceleration according to the drive cycle whereas Port DecelCmd represents the driver input for deceleration.
BATTERY SECTION:
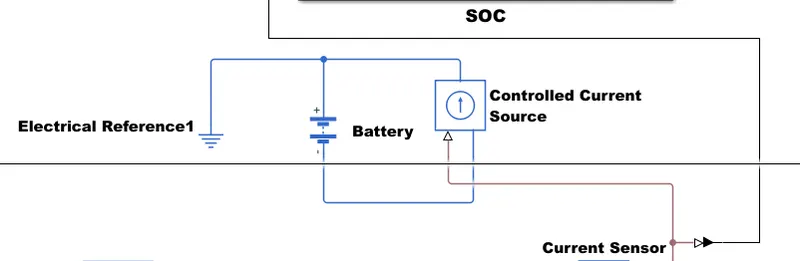
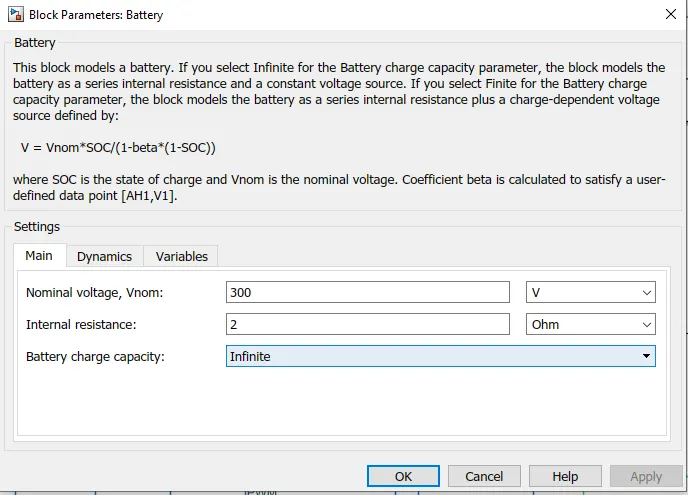
We can observe fot the battery section a normal battery block is been imported and the current is been given to the electrical circuit via Controlled Current Source and the Electrical Reference is been used for ground. The Controlled Current Source is used to keep a specific amount of current even there is any voltage fluctation. The battery nominal voltage is set to 300V.
BATTERY SOC:
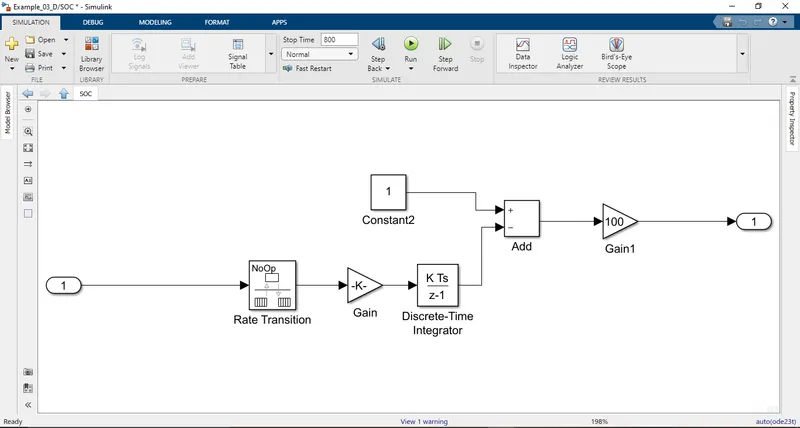
The SOC subsystem represents State of Charge left after the vehicle has travelled for certain period of time, the input signal comes from the current sensor block. SOC calculations are made to trace the battery reliability and the range of vehicle model. SOC is calculated by reducing the usage from the nominal SOC value on timely basis. Rate transition and time integration are used to calculate timely basis SOC value.
Rate Transition:

It handle transfer of data between blocks operating at different rates.
Discrete-Time Integrator:

It handles accumulation of signal.
Drive Cycle:
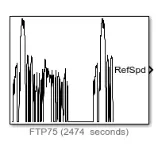
The Drive Cycle represents a set of data points for a vehicle in speed verus time graph. We can test the EV model by standard Drive Cycle present in Simulink or else we can import the user defined Excel file. The Drive Cycle Source block represents a standard or user-specified longitudinal drive cycle, it is the drive cycle which is the input given to the driver block which the driver follows. After the simulation is completed, we can study and observe different kind of parameter we can calculate what is the motoror engine torque required for vehicle to travel a certain distance, what is the fuel consumption or battery SOC in %, how much time is required for the vehicle to reach its top speed.
NOTE: Signal converters are used wherever required to connect Physical signal to Simulink signal and vice-versa using PS-Simulink converter and Simulink-PS converter blocks. We have imported various blocks from Powertrain blockset (Longitudinal Driver), Simscape-Electrical (DC-Motor, H-Bridge, Current Sensor, Controlled PWM Source, Controlled Voltage Source), Driveline (Vehicle Body, Tire), Simulink (Display, Scope). For observing the Simulation results we have imported Display & Scope blocks.
SIMULATION RESULT:
Simulation is performed to evaluate performance of the Model through monitoring by Speed comparison with the reference and to calculate amount of Battery SOC left.
CASE 1: FTP75 Drive Cycle
We have selected FTP75 Drive Cycle which is been simulated for 2474 seconds.
FTP75 Drive Cycle
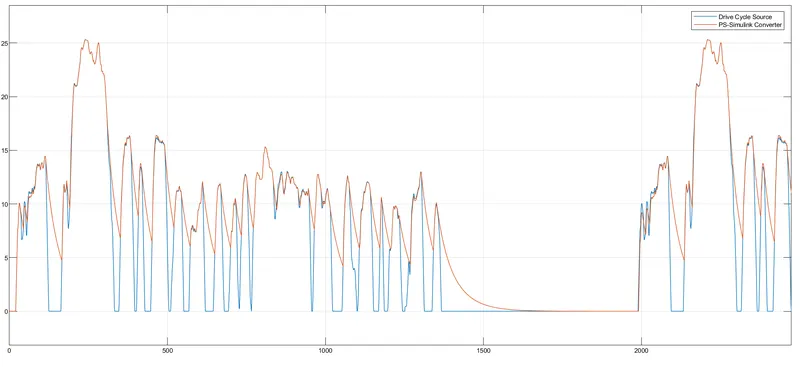
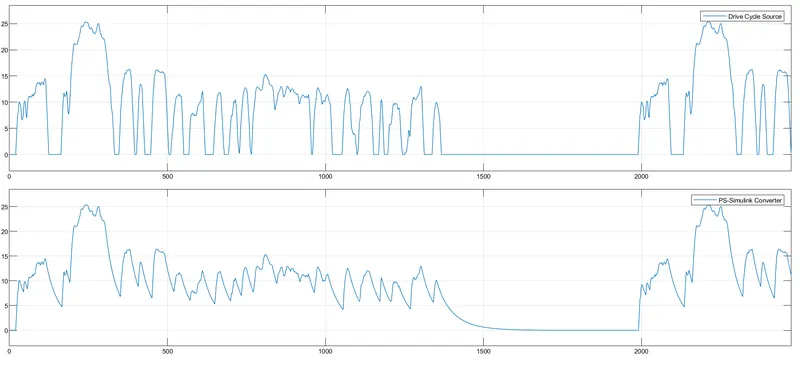
We can observe the speed comparison between the drive cycle and the driver's feedback in actual scenario. The simulation has been carried out for 2474 seconds. We can observe that when the vehicle is at maximum speed of 25.259 the driver follows the drive cycle but the vehicle model attains the maximum speed of 25.259. We can observe that during deceleration there is varation in the graph as in the pratical world we all know that it takes time to brake the vehicle whereas when the vehicle is accelerating it matches the path as the vehicle is in motion so we can observe slight devation in the drive cycle.
FTP75 Distance Travelled
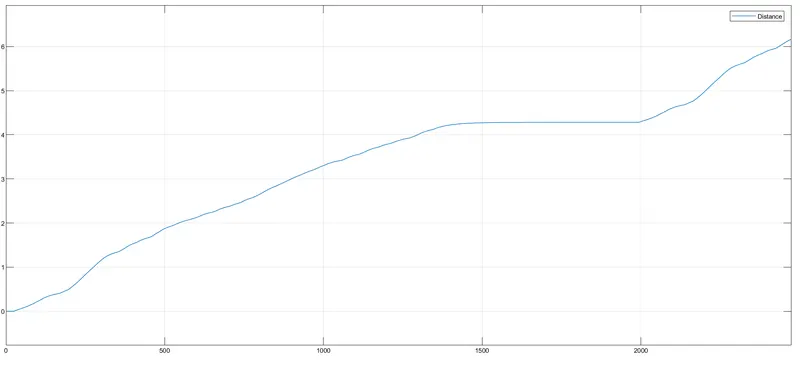
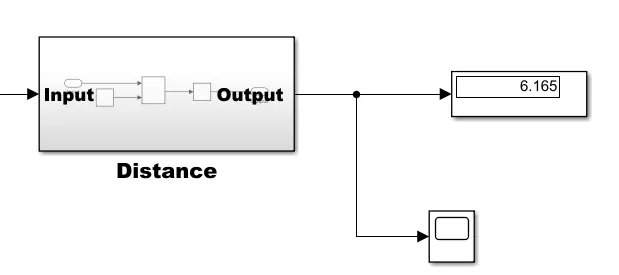
We can observe the distance travelled by the Vehicle model, the total distance travelled by the vehicle is 6.165.
FTP75 Battery SOC
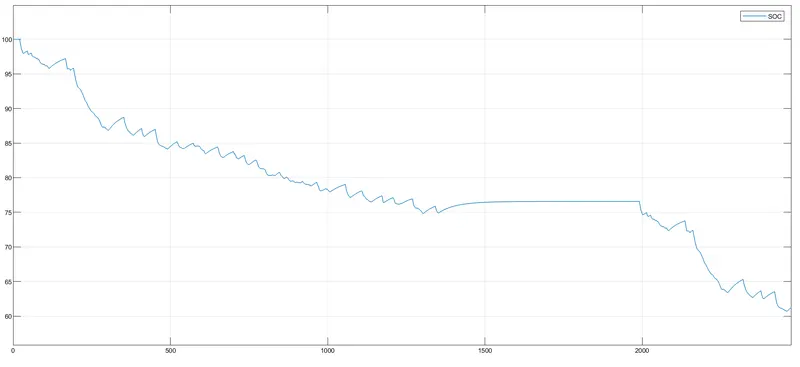
We can observe the amount battery SOC left after the simulation is completed, starting from 100% upto the simulation is carried out the amount of battery SOC left is 61.27% approximately.
CASE 2: WIDE OPEN THROTTLE (WOT) Drive Cycle
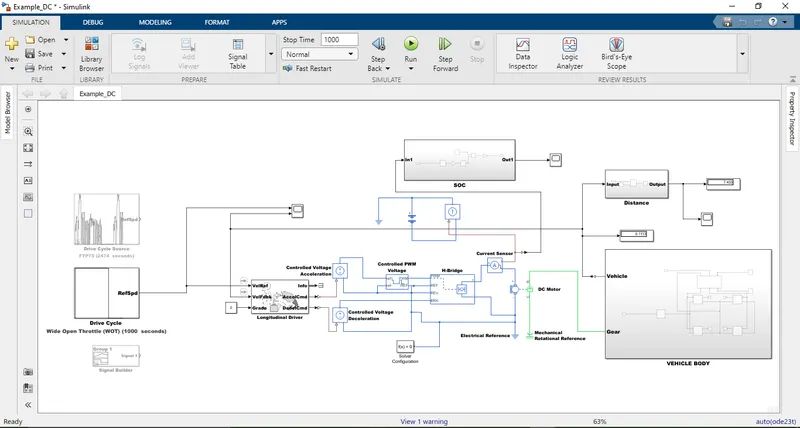
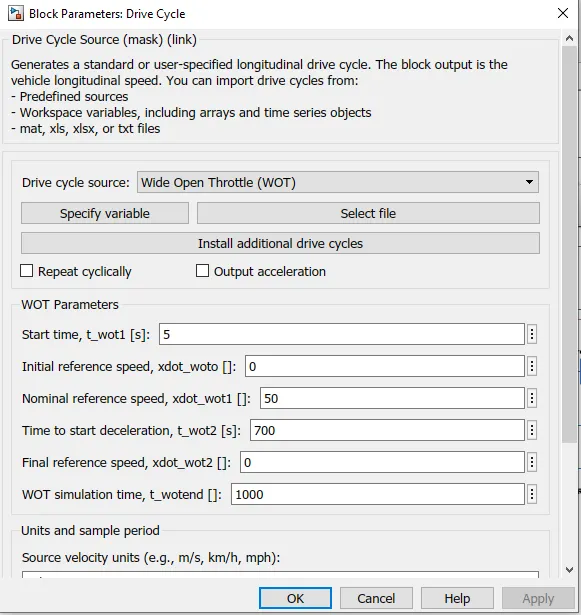
We have set the drive cycle to Wide Open Throttle (WOT) in this drive cycle the vehicle model is kept running for specific time interval and then brought to the zero speed. The parameter values are set as the Start time for vehicle is '5 seconds', the nominal speed is set at '50', The simulation is carried out for '1000 seconds', the vehicle deceleration value starts after '700 seconds'.
WOT Drive Cycle
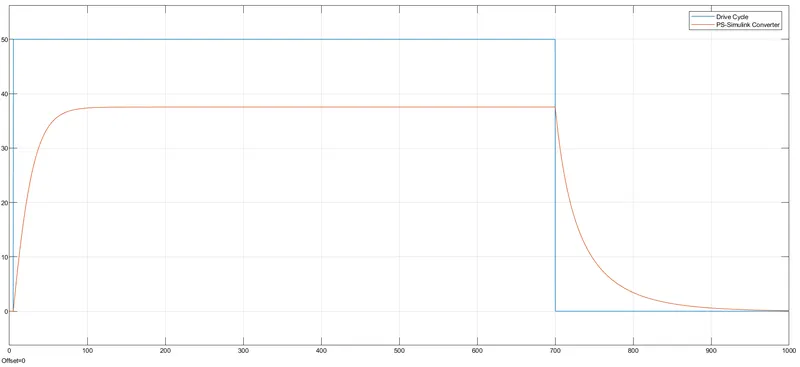
We can observe the blue line which is the values set in the drive cycle whereas the orange line is driver's feedback for the drive cycle. The maximum speed the vehicle model could reach is '37.541 ', this value can be tunned by changing the parameter values.
WOT Distance Travelled
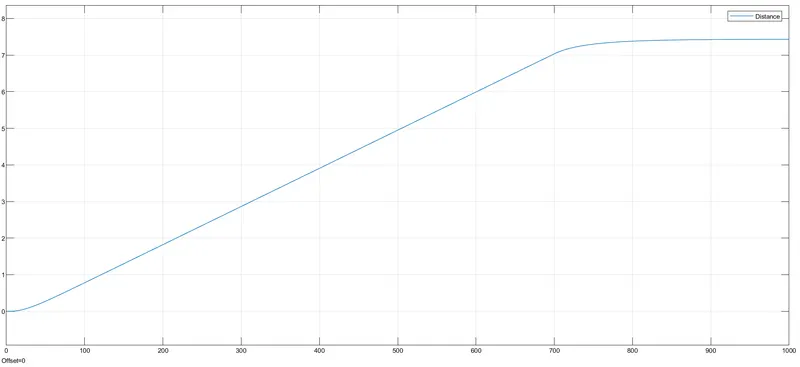
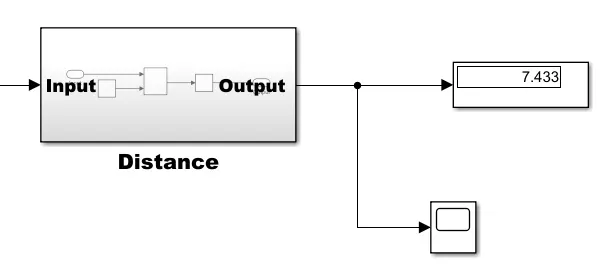
We can observe the amount of distance travelled by the vehicle in 1000seconds is 7.433. When the deceleration start we can observe a straight line due to complete drain out of Battery SOC.
WOT Battery SOC
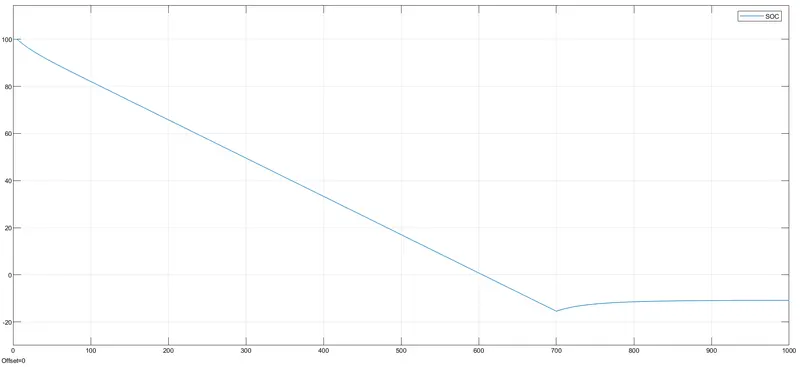
We can observe the amount battery SOC left after the simulation is completed, starting from 100% up to the simulation is carried out the amount of battery SOC left is 0% or -1.02% hence the vehicle will not move ahead. The vehicle is running uptill 604 seconds after this the vehicle will be stationery there is no SOC left.
CASE 3: Drive Cycle @SIGNAL BUILDER
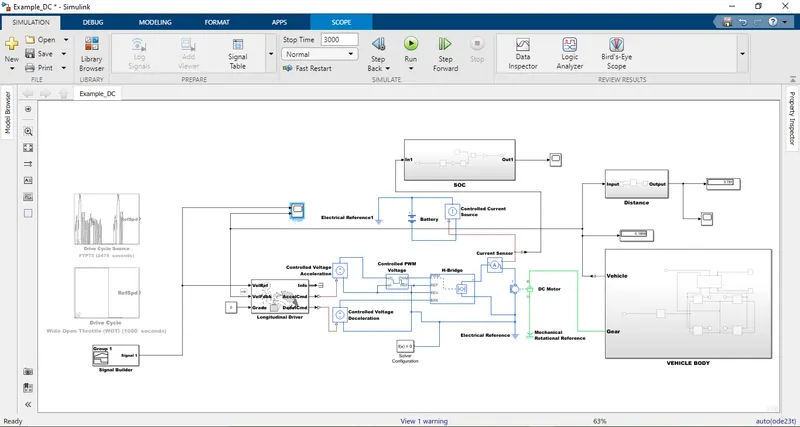
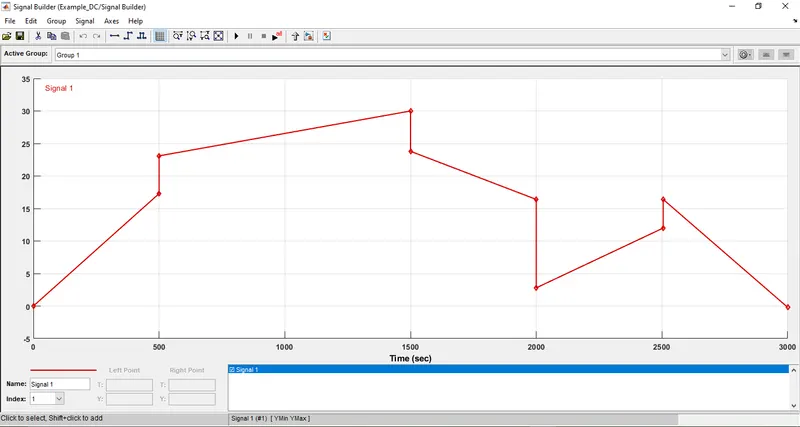
We are using a 'Signal Builder' block for the drive cycle, we have designed the drive cycle and the simulation is carried out for '3000 seconds', the maximum value of speed is been set at '30'.
SIGNAL BUILDER Drive Cycle
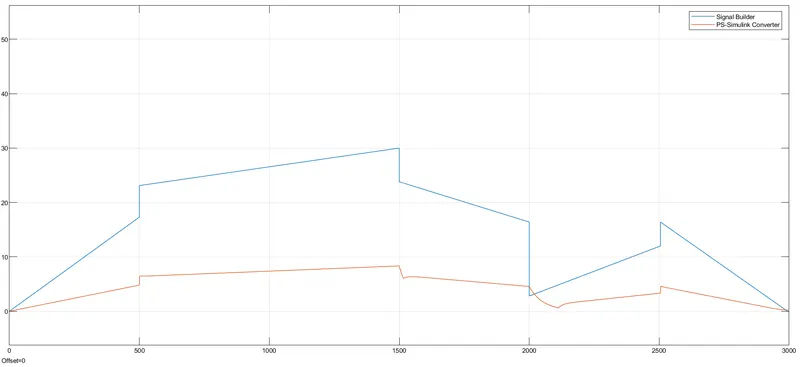
We can observe the blue line is the set cycle for which we are simulating whereas the orange line is the driver's feedback for the cycle. We can observe that there is too much variation in the drive cycle path this can be further fine tunned to achieve the desirable output which would much closer to the drive cycle.
SIGNAL BUILDER Distance Travelled
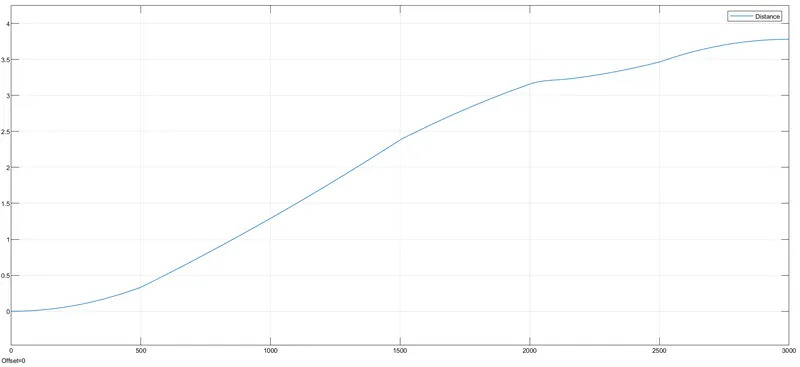
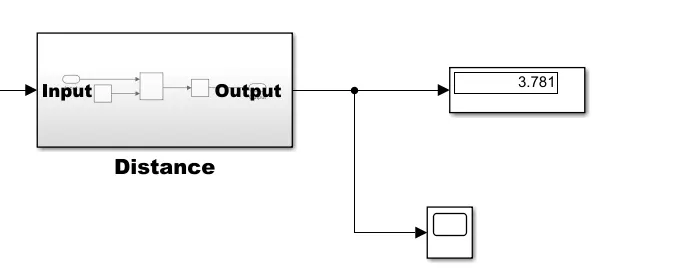
We can observe the amount of distance travelled by the vehicle in 3000seconds is 3.781.
SIGNAL BUILDER SOC
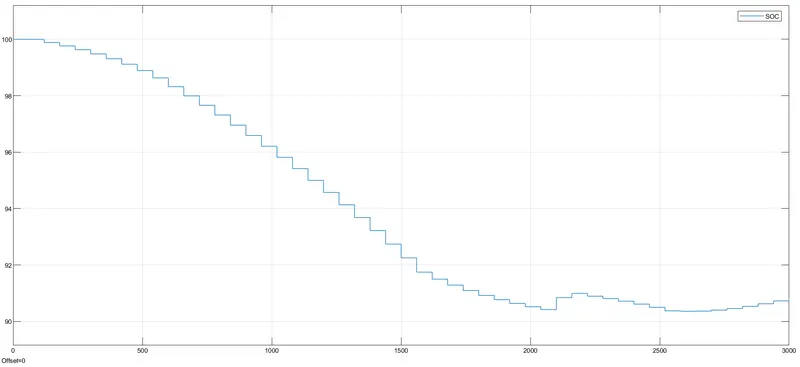
We can observe the amount battery SOC left after the simulation is completed, starting from 100% up to the simulation is carried out the amount of battery SOC left is 91% approximately.
Conclusion:
| DRIVE CYCLE | CASE 1 | CASE 2 | CASE 3 |
| Simulation Time (seconds) | FTP75 @2474 seconds | WOT @1000 seconds | Signal Builder @3000 seconds |
| Vehicle body weight(kg), Frontal area(m^2), Drag co-efficient, Rolling resistance | 1200, 3, 0.4, 1.18 | 1200, 3, 0.4, 1.18 | 1200, 3, 0.4, 1.18 |
| DC Motor Rated Load(KW), Rated Supply Voltage(V) | 60, 150 | 60, 150 | 60, 150 |
| Battery Nominal Voltage(V) | 300 | 300 | 300 |
| H-Bridge Output Voltage Amplitude(V) | 150 | 150 | 150 |
| Distance, Top Speed | 6.165, 25.259 | 7.433, 37.541 | 3.781, 8.33 |
| Battery SOC(%) | 61.27 | 0 or -1.02 | 91 |
| Top Speed Reached? | Yes | No |
No |
FUTURE SCOPE:
- Optimisation of battery pack for increased mileage and peak performance.
- Detailed simulaion can be done for more accurate solution i.e. setting parameter which are more realstic/pratical.
- Brushless DC motor are more widely used rather than Brushed DC motor.