Week - 4
Solution for 4.1 : Staeflow for Washing Machine
- Given data to carry on the Simulink&Stateflow Model
- If the power supply is available, the system gets activated
- If the Water supply is not available, stop the process & indicate through LED
- Soaking time should be 200s followed by Washing time of 100s.
- Then rinsing happens for next 20s & dryer runs for 50s
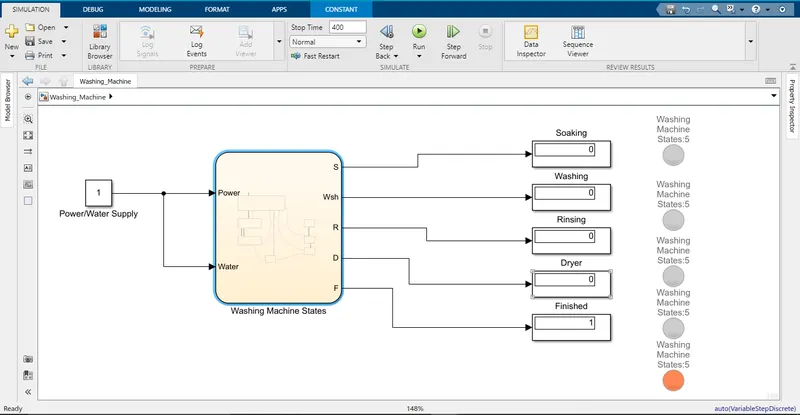
Simulink Model of Washing Machine : Fig 4.1.1
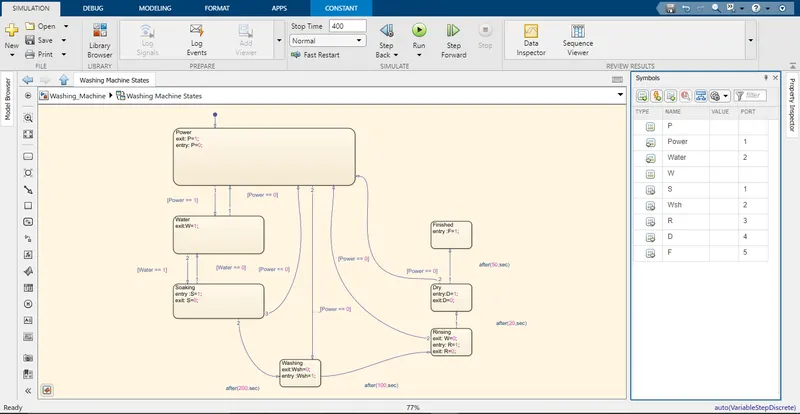
Stateflow Model of Washing Machine : Fig 4.1.2
- To build our Simulink&Stateflow model, we have to understand the flow pattern of washing machine. The first state ofcourse will be the 'electrical source(power supply)' a constant power supply is required so that the remaing state/operation could performed. After, this the next state will be 'water supply' in this state water is filled either manually or automtically. After, this state comes the 'soaking' state, in this state the detergent is added in the washing machine. After, this state comes the 'washing' state, in this state clothes are washed properely according to the timer set value. After, this next state will be 'rinsing' in this state the soapy water is drained out completely and again filled with fresh water, the rinse cycle uses intervals of spraying and spinning to force the soapy water and detergent out of the washer. After, this the next state will be 'Dryer' in this a warm dry air is passed through the wet clothes to extract mositure, then cooling the now humid air in a heat exchanger to condense the mositure and then pumped out by drain. Now, finally after all the states are completed we will get a 'LED' or 'Buzzer' notification in the washing machine.
- Power Supply>>Water Supply>>Soaking>>Washing>>Rinsing>>Dryer>>Finished.
- The value '1' indicates a certain operation is completed we can go ahead with the next operation.
- The first step of our modelling will be to add a 'Constant' block which will be used to indicated a constant 'power&water' supply this block is assigned we the value '1'. This block is connected with the 'power&water' supply port. The Constant block indicates the constant supply of power & water supply.
- After, this a 'Chart' block is added into the Simulink window i.e. Simulink Library>>Sateflow>>Chart. Now, in this Chart block the 'Stateflow' modelling is done.
- After, when we click and enter into Stateflow window we can see the background is changed to 'Off-white/Ivory' colour. On, the left side of the window we can see a toolbox through which we can model our Stateflow pattern.
- Now, to add the first state we have to select the option from the toolbox which is one left side of the window. We have added 7 'State' block to assign different states as mentioned above. The 1st state block is been assigned as 'Power' this state block indicate the power supply connected with Washing Machine. In, this block input terms are assigned i.e. entry:P=0; & exit:P=1; this term indicates that P=0 the power supply is not yet supplied whereas the term P=1 indicates the power supply is been supplied.
- Now, the second state block is been assigned as 'Water' this state block indicate if the water supply has been activated or deactivated with the hepl of W=1 & W=0. This state block is connected with the power supply block, when the action is [Power ==1] the water supply block is been activated whereas when [Power == 0] is been deactivated i.e. there is no power supply.
- Now, the third state block is assigned as 'Soaking' during this state as we have learnt above detergent is added, this state becomes active when the [Water == 1] and remains deactive when the [Water == 0]. As observed in the Fig 4.1.2. the 'Soaking' block is connected with the 'Water' supply block i.e. [Water == 1] & [Water == 0]. This state is operated for a time peroid of 200 seconds.
- Now, the fourth state block is assigned as 'Washing' during this state as we know clothes are been washed, this state becomes active after the 'Soaking' state is completed i.e. after 200 seconds time peroid. This block is connected with the 'Soaking' as well as 'Power' supply block [Power == 0]. This state is operated for a time peroid of 100 seconds.
- Now, fifth state block is assigned as 'Rinsing' during this state as we know soapy water is drained completely & clothes are rinsed with fresh water, this state becomes active after the ' Washing' state is completed i.e. after 100 seconds time peroid. This block is connected with the 'Washing' as well as 'Power' supply block [Power == 0]. This state is operated for a time peroid of 20 seconds.
- Now, sixth state block is assigned as 'Dryer' during this state as we know clothes are been dried with hot & humid air, this state becomes active after the 'Rinsing' state is completed i.e. after 20 seconds time peroid. This block is connected with the 'Rinsing' as well as 'Power' supply block [Power == 0]. This state is operated for a time peroid of 50 seconds.
- Now, seventh state block is assigned as 'Finished' after all the state are completed we will get the output as the 'LED' will Turn 'ON'.
- Details of Symbols Pane:
| SR.NO | NAME | VALUE | PORT |
| 01. | P = Local Data | ||
| 02. | Power = Input Data | 1 | |
| 03. | Water = Input Data | 2 | |
| 04. | W = Local Data | ||
| 05. | S = Output Data | 1 | |
| 06. | Wsh = Output Data | 2 | |
| 07. | R = Output Data | 3 | |
| 08. | D = Output Data | 4 | |
| 09. | F= Output Data | 5 |
Simulation Data : Processes have completed turn on the finished LED
- The total simulation time is '370' seconds, but due to some internal errors while the simulation is operated for '400' seconds so that we can get the desired output, to Turn 'ON' the LED when all the processes are completed.
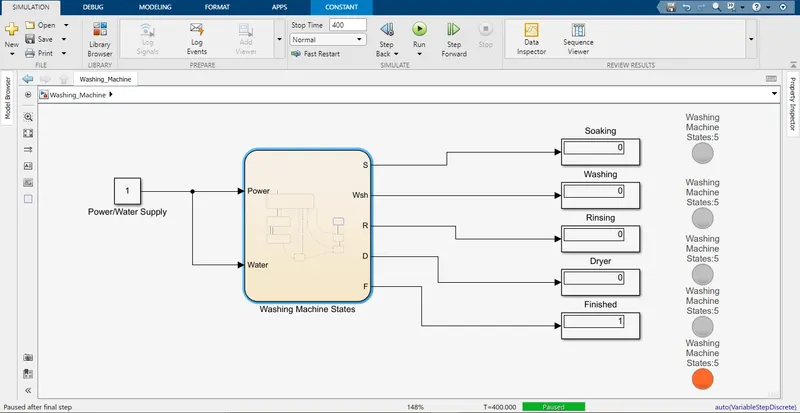
Simulink model after the proocesses have completed : Fig 4.1.3
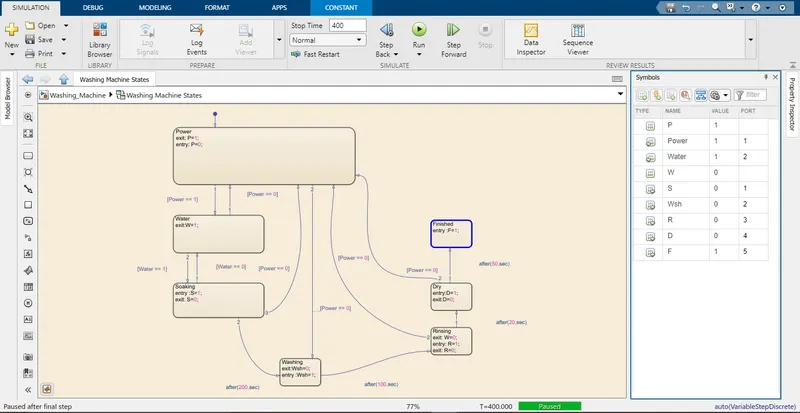
Stateflow model after the proceesses have completed : Fig 4.1.4
| SR.NO | NAME | VALUE | PORT |
| 01. | P = Local Data | 1 | |
| 02. | Power = Input Data | 1 | 1 |
| 03. | Water = Input Data | 1 | 2 |
| 04. | W = Local Data | 0 | |
| 05. | S = Output Data | 0 | 1 |
| 06. | Wsh = Output Data | 0 | 2 |
| 07. | R = Output Data | 0 | 3 |
| 08. | D = Output Data | 0 | 4 |
| 09. | F= Output Data | 1 | 5 |
Symbols Pane
- As, we can observe in the Fig 4.1.3 when all the processes are completed we can observe the Lamp is Turned 'ON' and the colour output is 'Orange' & we can also observe the value in the Display block as '1'. We have assigned the colour code as when the value is '0' the Lamp will glow 'Green' colour and when the value is '1' or any other number the Lamp will glow 'Orange' colour. The finishe
- In, the Statefow model, we observe the 'Finished' state has been highlighted with the 'Blue' border line indicating the simulation is currently running in that particular state.
For Reference Purpose :
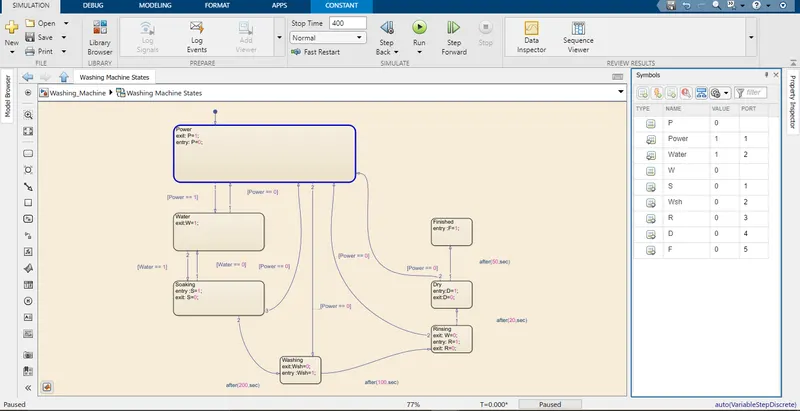
Power State is been highlighted
| SR.NO | NAME | VALUE | PORT |
| 01. | P = Local Data | 0 | |
| 02. | Power = Input Data | 1 | 1 |
| 03. | Water = Input Data | 1 | 2 |
| 04. | W = Local Data | 0 | |
| 05. | S = Output Data | 0 | 1 |
| 06. | Wsh = Output Data | 0 | 2 |
| 07. | R = Output Data | 0 | 3 |
| 08. | D = Output Data | 0 | 4 |
| 09. | F= Output Data | 0 | 5 |
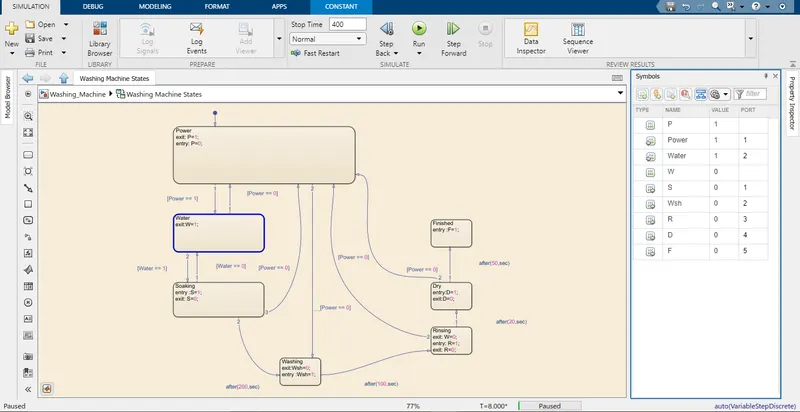
Water State is been Highlighted
| SR.NO | NAME | VALUE | PORT |
| 01. | P = Local Data | 1 | |
| 02. | Power = Input Data | 1 | 1 |
| 03. | Water = Input Data | 1 | 2 |
| 04. | W = Local Data | 0 | |
| 05. | S = Output Data | 0 | 1 |
| 06. | Wsh = Output Data | 0 | 2 |
| 07. | R = Output Data | 0 | 3 |
| 08. | D = Output Data | 0 | 4 |
| 09. | F= Output Data | 0 | 5 |
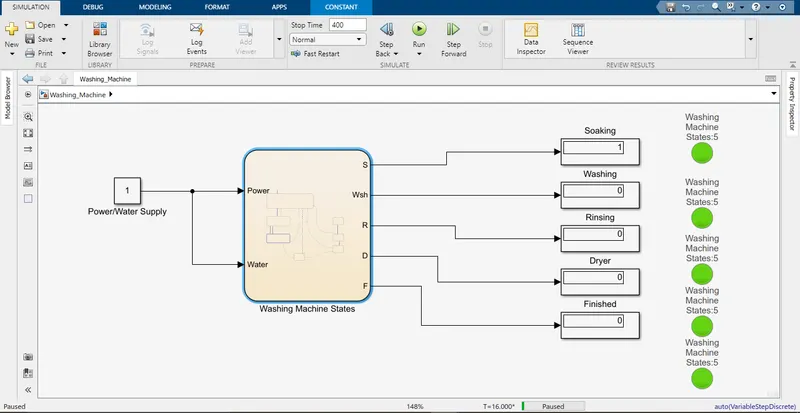
Soaking State Display indicating the value '1'
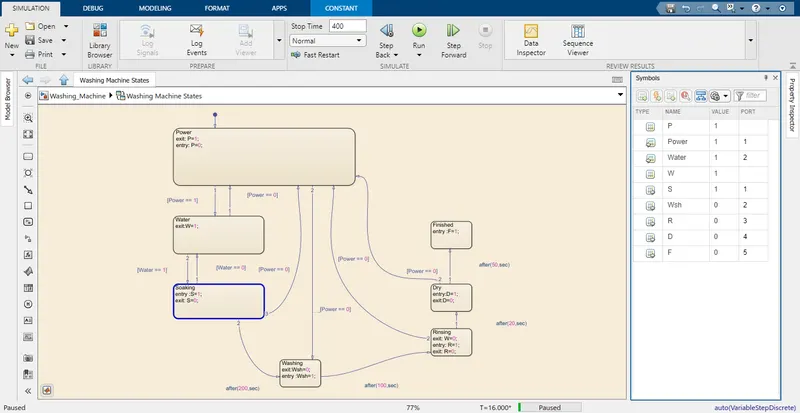
Soaking State is been highlighted for 200 seconds
| SR.NO | NAME | VALUE | PORT |
| 01. | P = Local Data | 1 | |
| 02. | Power = Input Data | 1 | 1 |
| 03. | Water = Input Data | 1 | 2 |
| 04. | W = Local Data | 1 | |
| 05. | S = Output Data | 1 | 1 |
| 06. | Wsh = Output Data | 0 | 2 |
| 07. | R = Output Data | 0 | 3 |
| 08. | D = Output Data | 0 | 4 |
| 09. | F= Output Data | 0 | 5 |
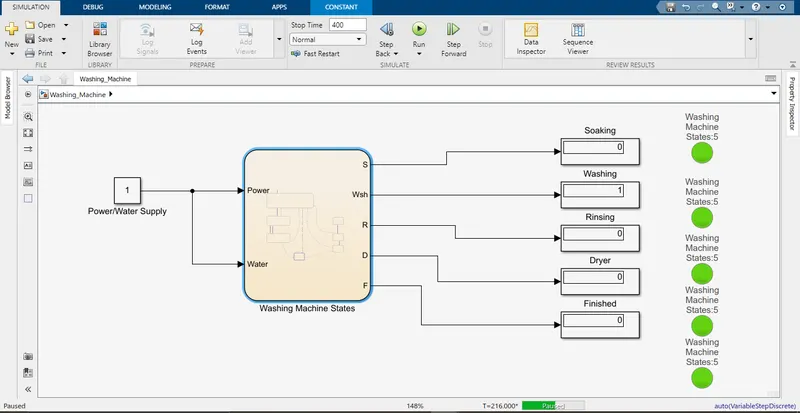
Washing State Display indicating the value '1'
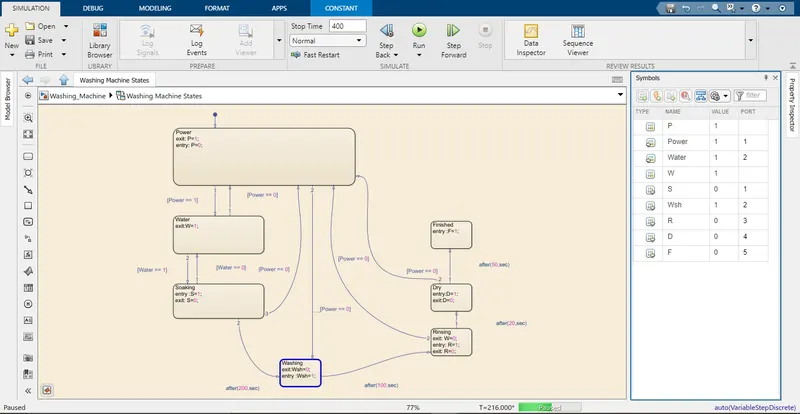
Washing State is been highlighted for 100 seconds
| SR.NO | NAME | VALUE | PORT |
| 01. | P = Local Data | 1 | |
| 02. | Power = Input Data | 1 | 1 |
| 03. | Water = Input Data | 1 | 2 |
| 04. | W = Local Data | 1 | |
| 05. | S = Output Data | 0 | 1 |
| 06. | Wsh = Output Data | 1 | 2 |
| 07. | R = Output Data | 0 | 3 |
| 08. | D = Output Data | 0 | 4 |
| 09. | F= Output Data | 0 | 5 |
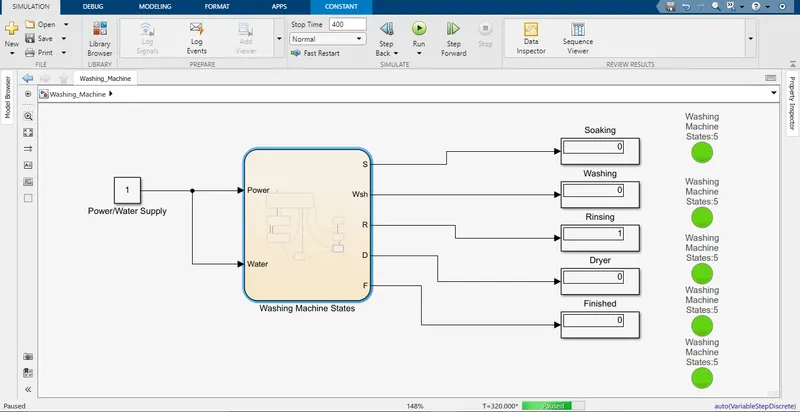
Rinsing State Display indicating the value '1'
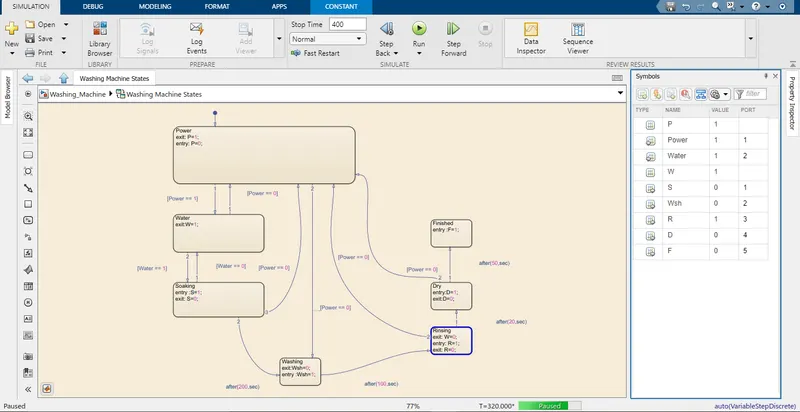
Rinsing State is been highlighted for 20 seconds
| SR.NO | NAME | VALUE | PORT |
| 01. | P = Local Data | 1 | |
| 02. | Power = Input Data | 1 | 1 |
| 03. | Water = Input Data | 1 | 2 |
| 04. | W = Local Data | 1 | |
| 05. | S = Output Data | 0 | 1 |
| 06. | Wsh = Output Data | 0 | 2 |
| 07. | R = Output Data | 1 | 3 |
| 08. | D = Output Data | 0 | 4 |
| 09. | F= Output Data | 0 | 5 |
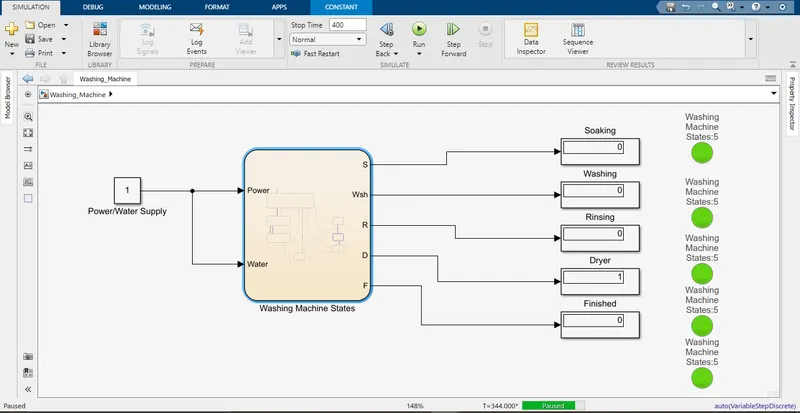
Dryer State Display indicated the value '1'
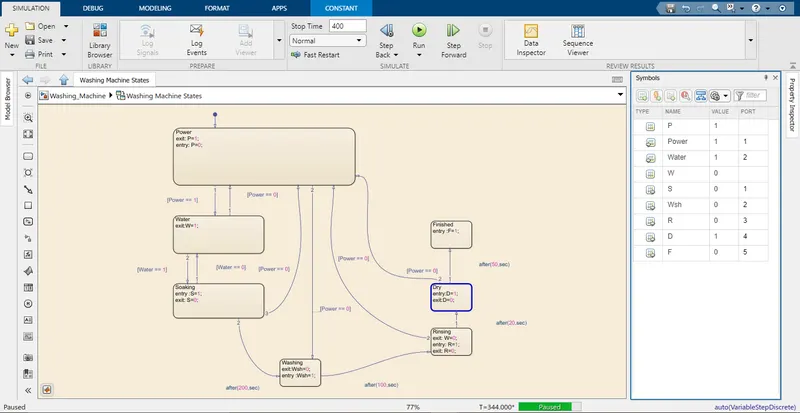
Dryer State is been highlighted for 50 seconds
| SR.NO | NAME | VALUE | PORT |
| 01. | P = Local Data | 1 | |
| 02. | Power = Input Data | 1 | 1 |
| 03. | Water = Input Data | 1 | 2 |
| 04. | W = Local Data | 0 | |
| 05. | S = Output Data | 0 | 1 |
| 06. | Wsh = Output Data | 0 | 2 |
| 07. | R = Output Data | 0 | 3 |
| 08. | D = Output Data | 1 | 4 |
| 09. | F= Output Data | 0 | 5 |
Solution for 4.2 : Staeflow for Gear Shift
-- Give speed input while the simulation is running & display the gear number
Given Data :
Speed Range(kmph) Gear
0 to 15 1
16 to 25 2
26 to 40 3
41 to 60 4
Above 61 5
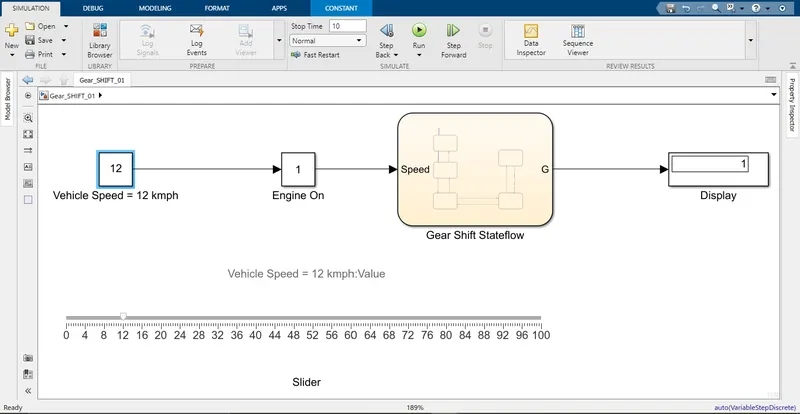
Simulink Model @12kmph Fig 4.2.1
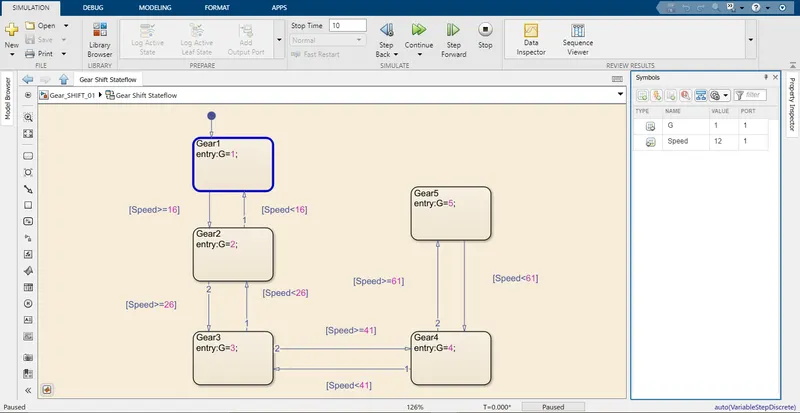
Stateflow Model @12kmph Fig 4.2.2
| SR.NO | NAME | VALUE | PORT |
| 01. | G = Output Data | 1 | 1 |
| 02. | Speed = Input Data | 12 | 1 |
- As, mentioned in the data given we have to model a system in which we have to indicate which gear is selected according to the Speed(kmph).
- So, before modelling the system we need to understand the flow pattern of the 'Gear Shift', we know that while driving a vehicle we change/shift the gear according to the variation of speed i.e. if we want to increase the speed of the vehicle we upshift the gear a normal pattern is from Gear1>>Gear2>>Gear3>>Gear4>>Gear5 and to decrease the speed of the vehicle we downshift the gear i.e. Gear5>>Gear4>>Gear3>>Gear2>>Gear1. Now, to input the vehicle speed we need to add a 'Constant' block Simulink Library >> Sources>>Constant & we also are going to add a 'Slider' block which will be connected with Constant block. The 'Slider' block is used to set value to tune parameters or variables i.e. Simulink Library>>Dashboard>>Slider. We are also going to add a 'Slider Gain' block i.e. Simulink Library>>Math Operation>>Slider Gain this block is used to move the slider to modify scalar gain.
- Now, to model the Gear Shift we are going to add a 'Chart' i.e. Simulink Library>>Sateflow>>Chart. Now, to model gear shift enter into Stateflow window, we are going to add 5 'State' blocks. Now, we are going to assign Gear1,Gear2,Gear3,Gear4,Gear5 in 5 state respectively. For Gear1 we are going to assign entry: & G=1 in this we are going to assign this conditions to remaing state according to the Gear numbers i.e. G=2,G=3,G=4,G=5. Gear1 is the default state this is connected with Gear2 and the condition is given as [Speed>=16]&[Speed<16]. Gear2 is connected with Gear3 and the condition is given as [Speed>=26]&[Speed<26]. Gear3 is connected with Gear4 and the condition is given as [Speed>=41]&[Speed<41]. Gear4 is connected with Gear5 and the condition is given as [Speed>=61]&[Speed<61].
- To indicate which 'Gear' is selected a 'Display' block is added i.e. Simulink Library>>Dashboard>>Display.
- The simulation time is set to default value i.e. '10' seconds.
- From, the Fig 4.2.1 we can observe that the Vehicle Input Speed = 12 kmph hence, we can see Gear1 selected i.e. Display gives the output of '1'.
- From, the Fig 4.2.2 we can observe that the Gear1 is highlighted in 'Blue' colour, in the sysmbols pane we observe that in the value of 'G' we observe the value '1' & for the Speed we can observe the value '12'.
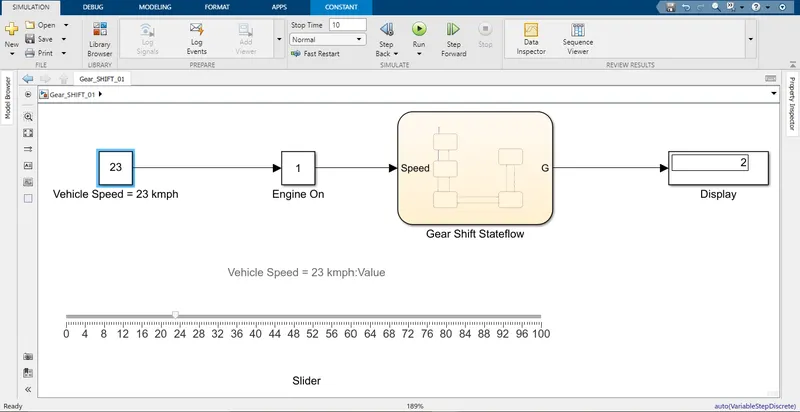
Simulink Model @ 23 kmph Fig 4.2.3
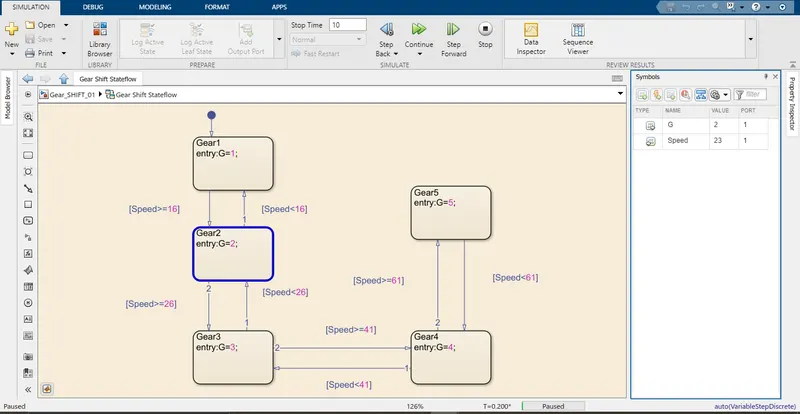
Stateflow Model @ 23 kmph Fig 4.2.4
| SR.NO | NAME | VALUE | PORT |
| 01. | G = Output Data | 2 | 1 |
| 02. | Speed = Input Data | 23 | 1 |
- From, the Fig 4.2.3 we can observe that the Vehicle Input Speed = 23 kmph hence, we can see Gear1 selected i.e. Display gives the output of '2'.
- From, the Fig 4.2.4 we can observe that the Gear2 is highlighted in 'Blue' colour, in the sysmbols pane we observe that in the value of 'G' we observe the value '2' & for the Speed we can observe the value '23'.
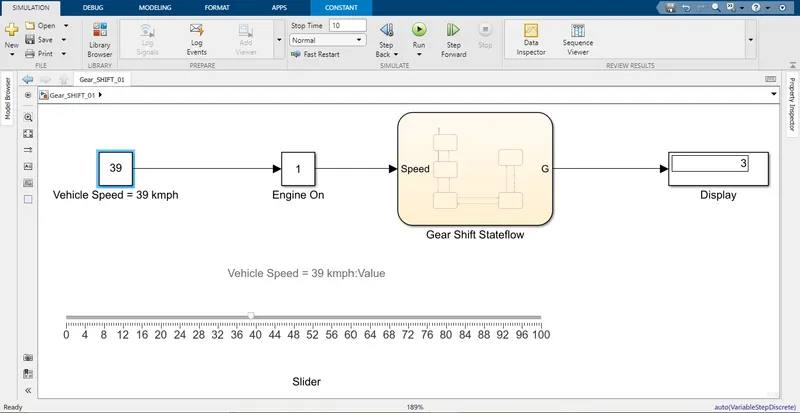
Simulink Model @ 39 kmph Fig 4.2.5
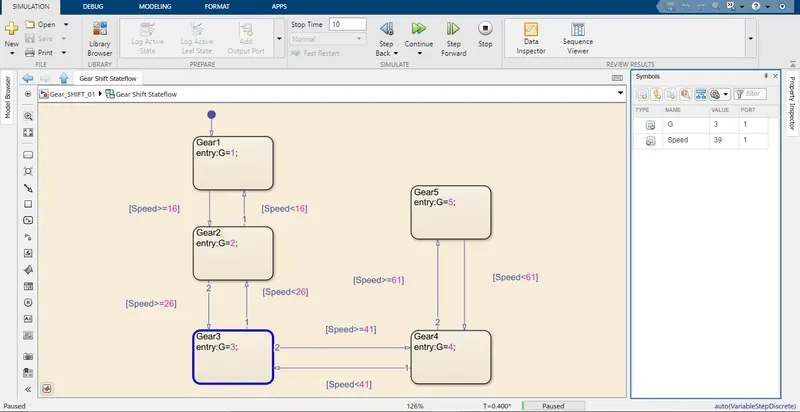
Stateflow Model @ 39 kmph Fig 4.2.6
| SR.NO | NAME | VALUE | PORT |
| 01. | G = Output Data | 3 | 1 |
| 02. | Speed = Input Data | 39 | 1 |
- From, the Fig 4.2.5 we can observe that the Vehicle Input Speed = 39 kmph hence, we can see Gear1 selected i.e. Display gives the output of '3'.
- From, the Fig 4.2.6 we can observe that the Gear3 is highlighted in 'Blue' colour, in the sysmbols pane we observe that in the value of 'G' we observe the value '3' & for the Speed we can observe the value '39'.
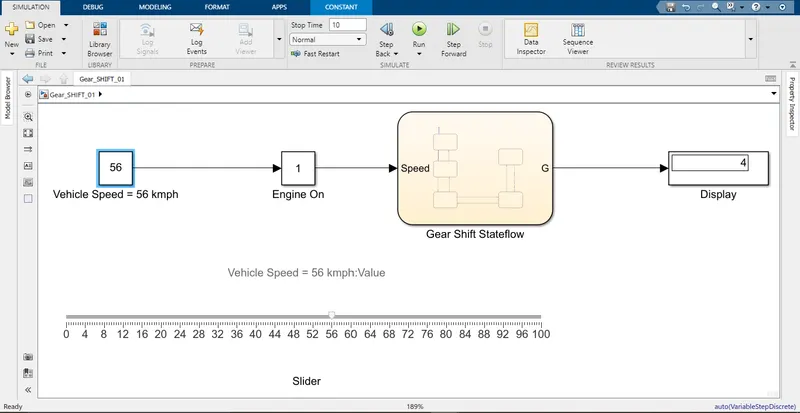
Simulink Model @ 56 kmph Fig 4.2.7
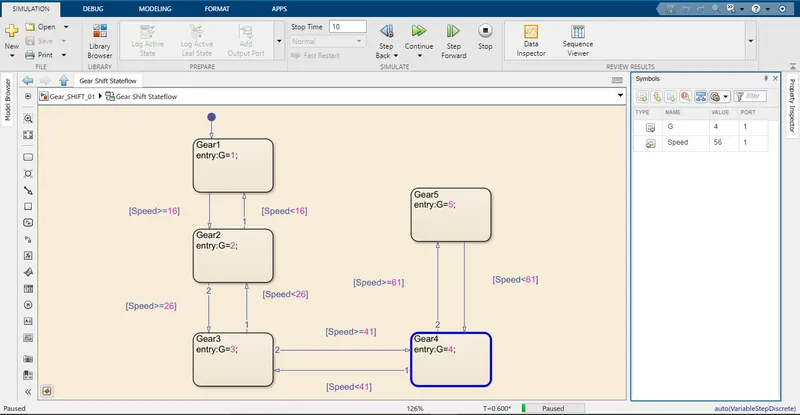
Simulink Model @ 56 kmph Fig 4.2.7
| SR.NO | NAME | VALUE | PORT |
| 01. | G = Output Data | 4 | 1 |
| 02. | Speed = Input Data | 56 | 1 |
- From, the Fig 4.2.7 we can observe that the Vehicle Input Speed = 56 kmph hence, we can see Gear1 selected i.e. Display gives the output of '4'.
- From, the Fig 4.2.8 we can observe that the Gear4 is highlighted in 'Blue' colour, in the sysmbols pane we observe that in the value of 'G' we observe the value '4' & for the Speed we can observe the value '56'.
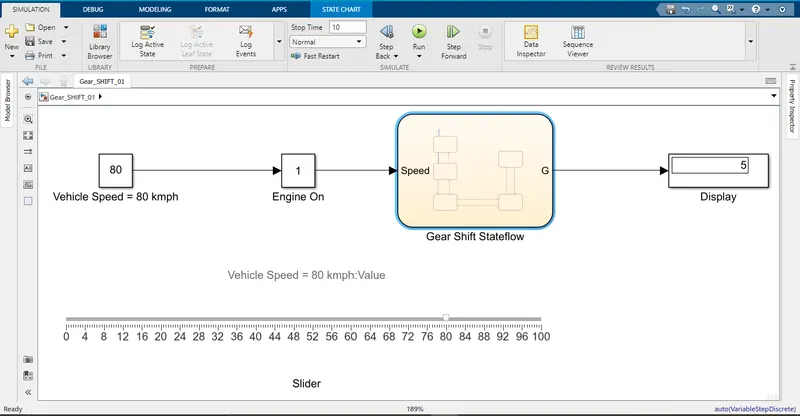
Simulink Model @ 80 kmph Fig 4.2.9
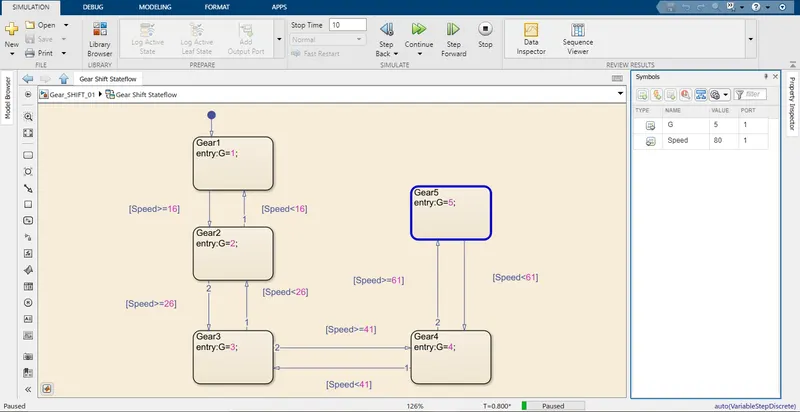
Stateflow Model @ 80 kmph Fig 4.2.10
| SR.NO | NAME | VALUE | PORT |
| 01. | G = Output Data | 5 | 1 |
| 02. | Speed = Input Data | 80 | 1 |
- From, the Fig 4.2.9 we can observe that the Vehicle Input Speed = 80 kmph hence, we can see Gear1 selected i.e. Display gives the output of '5'.
- From, the Fig 4.2.10 we can observe that the Gear4 is highlighted in 'Blue' colour, in the sysmbols pane we observe that in the value of 'G' we observe the value '5' & for the Speed we can observe the value '80'.