Week-4 Challenge WOT Condition Part-2
Solution1. :-What is the difference between mapped and dynamic model of engine, motor and generator? How can you change model type?
-- Powertrain Blockset provides two types of combustion engine models: mapped and dynamic. Mapped engines represent macro engine behavior as a set of lookup tables (brake torque, fuel flow, air mass flow, exhaust temperature, efficiency, and emissions) as functions of commanded load and measured engine speed. Dynamic engines decompose engine behavior into individual component models that account for engine dynamics, most notably intake airflow and turbocharger dynamics.
-- You can switch between engine model types based on your application. Dynamic engine models are suitable for designing control, estimator, and diagnostic algorithms that depend on dynamic subsystem states, for example, in closed-loop AFR control algorithm development. Mapped engine models are suitable for analysis and design activities that do not require engine subsystem dynamic characteristics, for example, in engine and transmission powertrain matching analysis for fuel economy, emissions, and performance tradeoffs
-- Mapped Model: It is based upon lookup tables and not the actual componenets. It is a steady state model and simulation takes less time due to simplicity.
-- Dynamic Model: It is based upon actual commponent model. Each component is modeled separately and simulation takes more time due to complexity.
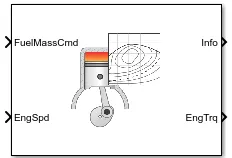
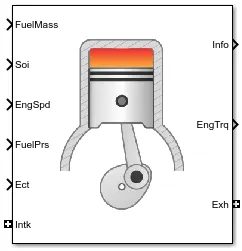
- Engine Mapped - Engine Dynamic
|
Type |
Implementation |
When to Use |
|
|
Mapped |
CiMappedEngine SiMappedEngine |
- Model uses a set of steady-state lookup tables to characterize engine performance. - The tables provide overall engine characteristics, including actual torque, fuel flow rate, BSFC, and engine-out exhaust emissions. |
·If you have engine data from a dynamometer or a design tool like GT-POWER. ·For quasi steady-state engine simulations. |
|
Dynamic |
CiEngine SiEngine |
- Model decomposes the engine behavior into engine characteristics that are separated into lower-level components. By combining components in this way, the models capture the dynamic effects. |
·If you need a more detailed dynamic model and have component-level data. ·To analyze the impact of individual engine components on the overall performance. |
1. Mapped & Dynamic Model of SI/CI Engine : Fig 1.1
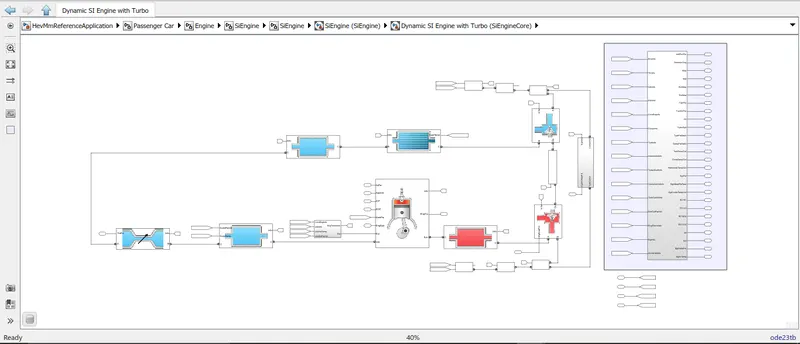
Dynamic Model of a SI Engine
Mapped SI Engine Model :
The Mapped SI Engine block implements a mapped spark-ignition (SI) engine model using power, air mass flow, fuel flow, exhaust temperature, efficiency, and emission performance lookup tables. You can use the block for:
- Hardware-in-the-loop (HIL) engine control design
- Vehicle-level fuel economy and performance simulations
The block enables you to specify lookup tables for these engine characteristics. The lookup tables, developed with the Model-Based Calibration Toolbox™, are functions of commanded torque, Tcmd, brake torque, Tbrake, and engine speed, N. If you select Input engine temperature, the tables are also a function of engine temperature, TempEng.
Dynamic SI Engine Model :
The SI Core Engine block implements a spark-ignition (SI) engine from intake to exhaust port. You can use the block in larger vehicle models, hardware-in-the-loop (HIL) engine control design, or vehicle-level fuel economy and performance simulations.
The SI Core Engine block calculates:
- Brake torque
- Fuel flow
- Port gas mass flow, including exhaust gas recirculation (EGR)
- Air-fuel ratio (AFR)
- Exhaust temperature and exhaust mass flow rate
- Engine-out (EO) exhaust emissions
- Hydrocarbon (HC)
- Carbon monoxide (CO)
- Nitric oxide and nitrogen dioxide (NOx)
- Carbon dioxide (CO2)
- Particulate matter (PM)
Mapped CI Engine Model :
The Mapped CI Engine block implements a mapped compression-ignition (CI) engine model using power, air mass flow, fuel flow, exhaust temperature, efficiency, and emission performance lookup tables. You can use the block for:
- Hardware-in-the-loop (HIL) engine control design
- Vehicle-level fuel economy and performance simulations
The lookup tables, developed with the Model-Based Calibration Toolbox™, are functions of injected fuel mass, F, engine torque, T, engine speed, N, and engine temperature, TempEng.
Dynamic CI Engine Model :
The CI Core Engine block implements a compression-ignition (CI) engine from intake to the exhaust port. You can use the block for hardware-in-the-loop (HIL) engine control design or vehicle-level fuel economy and performance simulations.
The CI Core Engine block calculates:
- Brake torque
- Exhaust temperature
- Air-fuel ratio (AFR)
- Fuel rail pressure
- Engine-out (EO) exhaust emissions:
- Hydrocarbon (HC)
- Carbon monoxide (CO)
- Nitric oxide and nitrogen dioxide (NOx)
- Carbon dioxide (CO2)
- Particulate matter (PM)
-- Now, to change the Model type from Mapped>>Dynamic or Dynamic>>Mapped :
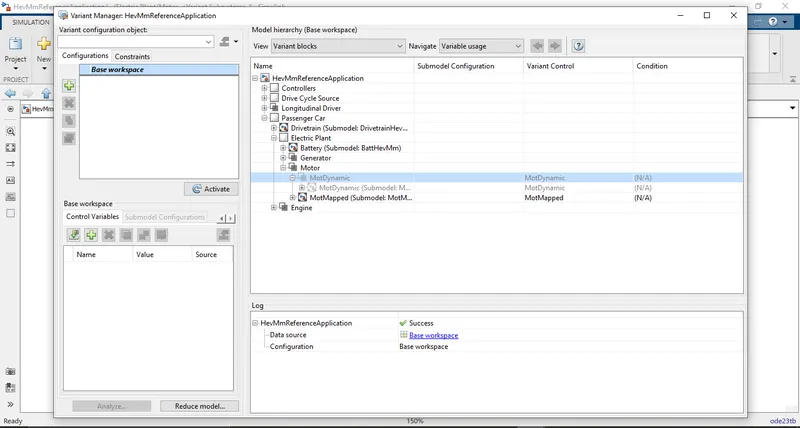
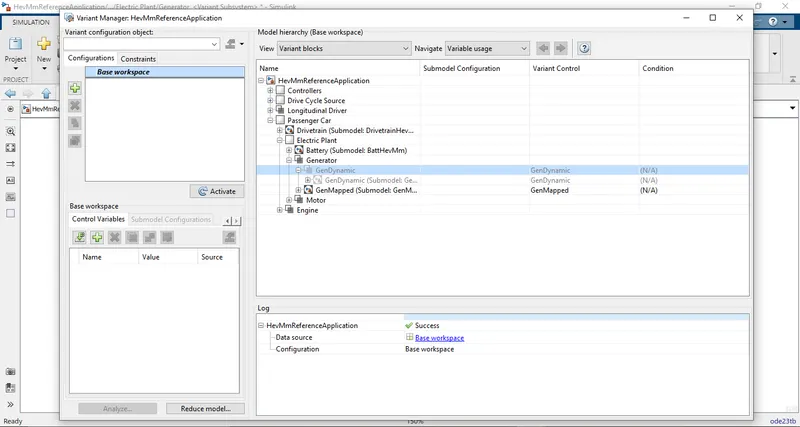
- To change the model type we can do the changes with the help of Variant Manager. We have to select the model which we have to activate/use in the simulation. After this we have select Subsystem & Model Reference>>Convert To>>Variant Subsystem now, we can see a option added 'Variant' select that and now open the Variant Manager and from their you can observe the Model is selected by default right click on that and from their select the option 'Set as Label Mode Active choice'.
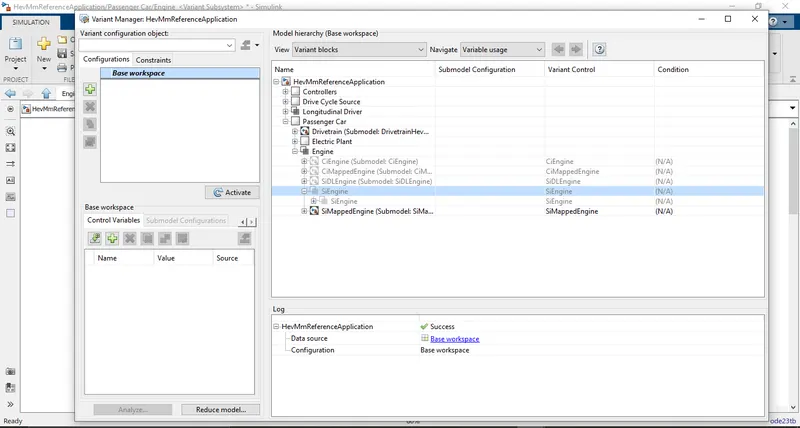
Variant Manager to change the Model Type
2. Mapped & Dynamic Model of Motor : Fig 1.2
Inside view of Mapped Motor :
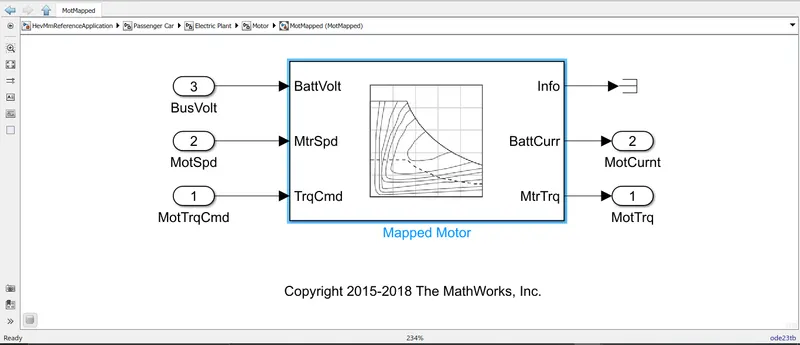
The Mapped Motor block implements a mapped motor and drive electronics operating in torque-control mode. The output torque tracks the torque reference demand and includes a motor-response and drive-response time constant. Use the block for fast system-level simulations when you do not know detailed motor parameters, for example, for motor power and torque tradeoff studies. The block assumes that the speed fluctuations due to mechanical load do not affect the motor torque tracking.
You can specify:
- Port configuration — Input torque or speed.
- Electrical torque range — Torque speed envelope or maximum motor power and torque.
- Electrical loss — Single operating point, measured efficiency, or measured loss. If you have Model-Based Calibration Toolbox™, you can virtually calibrate the measured loss tables.
Inside view of Dynamic Motor :
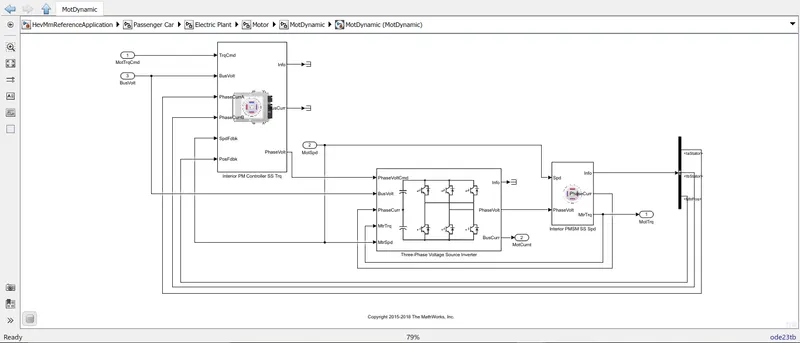
- By default a Flux-Based PMSM Motor is used for Simulation.
Input Ports/Values used for Simulation :
> Rotor Shaft Torque
> Rotor Shaft Speed
> Stator Terminal Voltage
Output Ports/Values used for Simulation :
> Bus Signal
> Phase a,b,c current
> Motor Torque
> Motor Speed
Now, to change the Model Type we have to follow the same procedure as mentioned above in the Engine Section
3. 2. Mapped & Dynamic Model of Generator : Fig 1.3
Inside view of Mapped Genrator :
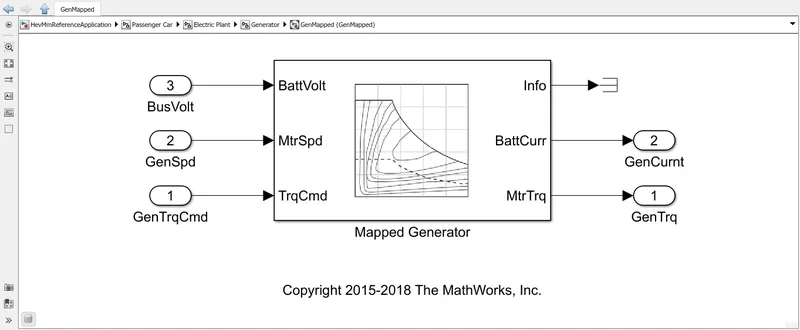
Input Ports/Values used for Simulation :
> Generator Torque Command
> Generator Speed
> Bus Voltage
Output Ports/Values used for Simulation :
> Generator Torque
> Generator Current
Inside view of Dynamic Genrator :
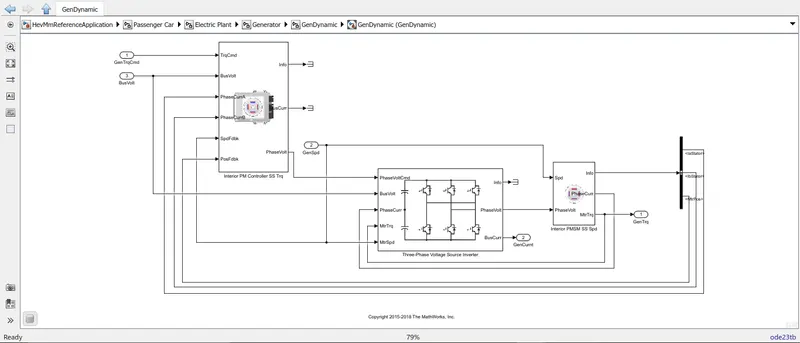
- By default a Flux-Based PMSM Motor/Generator is used for Simulation.
Input Ports/Values used for Simulation :
> Generator Shaft Torque
> Generator Shaft Speed
> Stator Terminal Voltage
Output Ports/Values used for Simulation :
> Bus Signal
> Phase a,b,c current
> Generator Torque
> Generator Speed
Now, to change the Model Type we have to follow the same procedure as mentioned above in the Engine Section
Solution 2. :- How does the model calculate miles per gallon? Which factors are considered to model fuel flow?
- Miles per gallon gasoline equivalent (MPGe or MPGge) is a measure of the average distance traveled per unit of energy consumed. MPGe is used by the United States Environmental Protection Agency (EPA) to compare energy consumption of alternative energy vehicle, plug-in electric vehicle and other advanced technology vehicles with the energy consumption of conventional internal combustion vehicles rated in miles per U.S.Gallon.
- To calculate the miles per gallon, we have to convert all of the battery power into gallons, this is defined by United States Environmental Protection Agency (EPA) as 33.7killowatt-hours of electricity is equal to 1 gallonof gas.
Model of HEV :
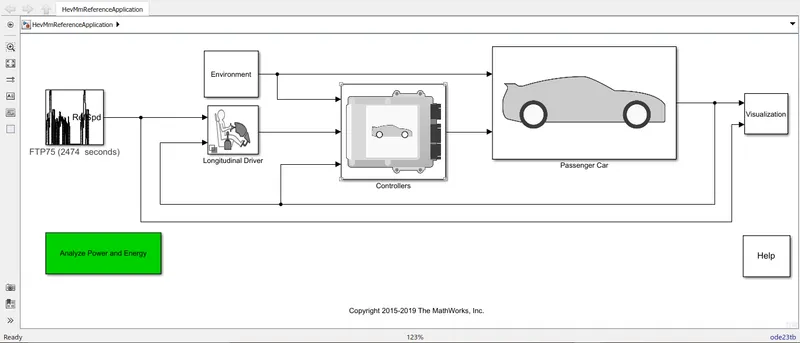
- We can get the fuel economy block from the Visualization block
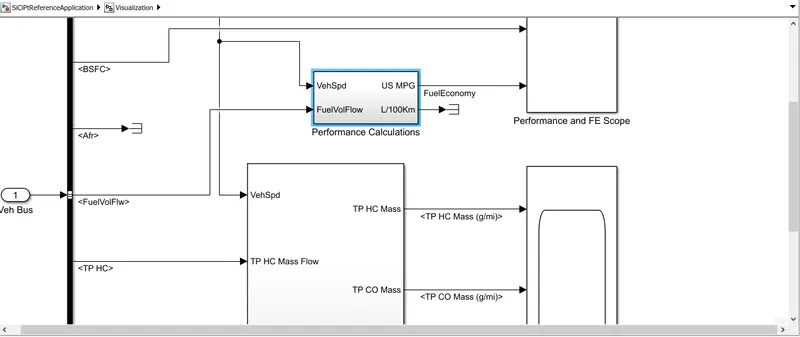
- Inside the Performance Calculations
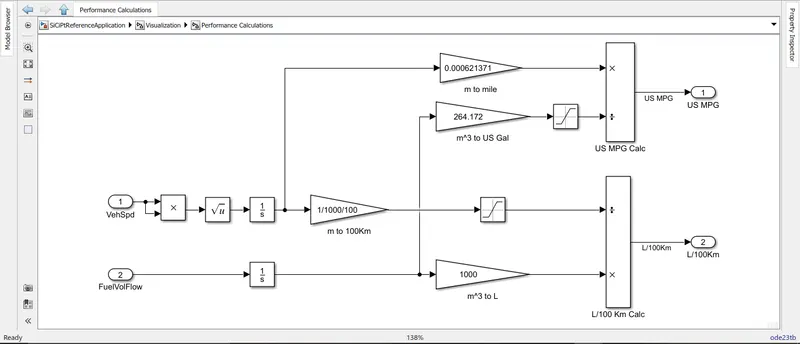
- To calculate fuel economy in Miles Per Gallon(MPG) we need to consider to values i.e. 1.Vehicle Speed 2. Fuel Volume Flow
- To calculate the Vehicle Speed a Speed value is inputed which is then further calculated using math equations, after this we get the value in meter which is then converted into miles by multiplying the value by 0.000621371.
- To calculate the Fuel Flow, the volume of fuel flow entered is considered which is then converted from m^3 to US Gallon by dividing with 264.172.
- Factors are considered to model fuel flow
1. Vehicle Speed
2. Vehicle Fuel Volume Flow
Solution 3. :- Run the HEV ReferenceApplication with WOT drive cycle. Change the grade and wind velocity in the environment block. Comment on the results.
Given Data : We have to import the 'HEVMmReferenceApplication' file from the 'Powertrain Blockset'. We have to run the Simulation by using Wide Open Throttle(WOT) drive cycle.
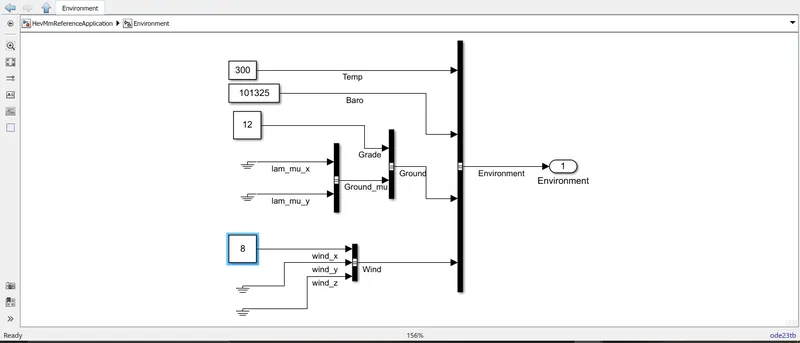
Assumptions : Grade Angle : 12; Wind Velocity : 8
HEV Model :
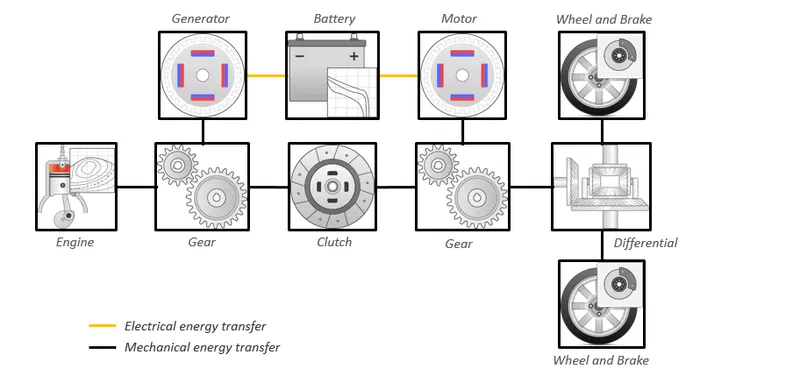
Main Components :
- SI/CI Engine
- Geartrain(Box)
- Clutch
- Differential
- Electric Motor
- Generator
- Battery
- Wheel and Brake
The IC Engine arrangement is in 'Series' whereas the Electrical Motor arrangement is in 'Parallel'
-- Drive Cycle Selected :- Wide Open Throttle(WOT) For 100seconds
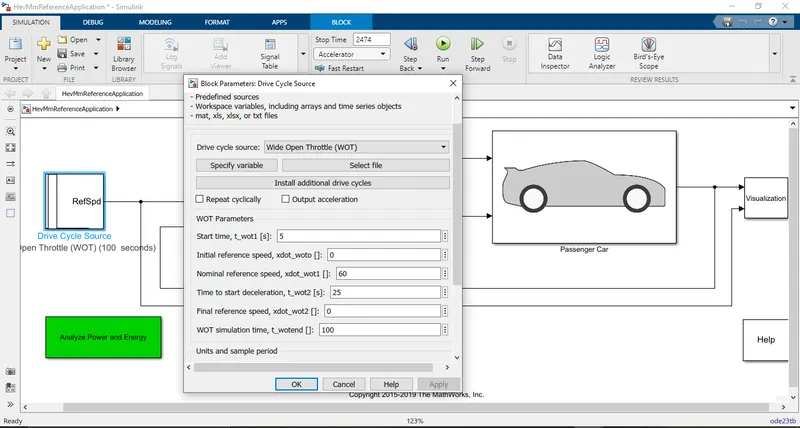
-- Parameters Updated>>Enviroment>>Grade&Wind Velocity
-- Output Results
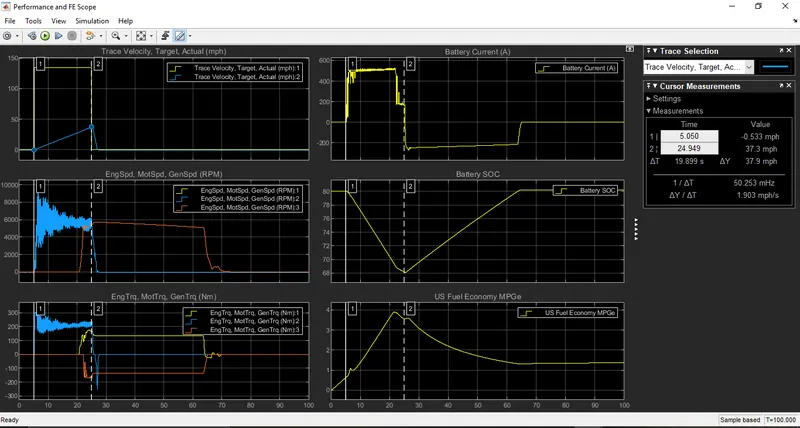
- We have considered Grade Angle = 12; Wind Velocity = 8; Simulation Time = 100seconds; WOT Deceleration = 25seconds
- We can observe from the output result that when the Full Throttle is been given for 25seconds the maximum speed of 37.9mph is acheived at time frame of 19.899seconds, after the 25 seconds time peroid the vehicle decelerates upto 100seconds.
- We also observe the Battery SOC falls upto 68% to reach the WOT(25seconds), as soon as the vehicle deceleration starts the regenrative braking system is enabled we can observe the rise in the Battery SOC 80%.
- We observe that the Battery draws Current around 500Amps upto 25seconds whereas during deceleration it gets charged around 220Amps and stops charging when the Engine is turned 'OFF'.
Solution 4. :- Keeping all other parameters same, compare the simulated results of hybrid and pure electric powertrains.
Given Data : We have to import the 'EVReferenceApplication' file from the 'Powertrain Blockset'. We have to run the Simulation by using Wide Open Throttle(WOT) drive cycle.
Assumptions : Grade Angle : 12; Wind Velocity : 8
EV Model :
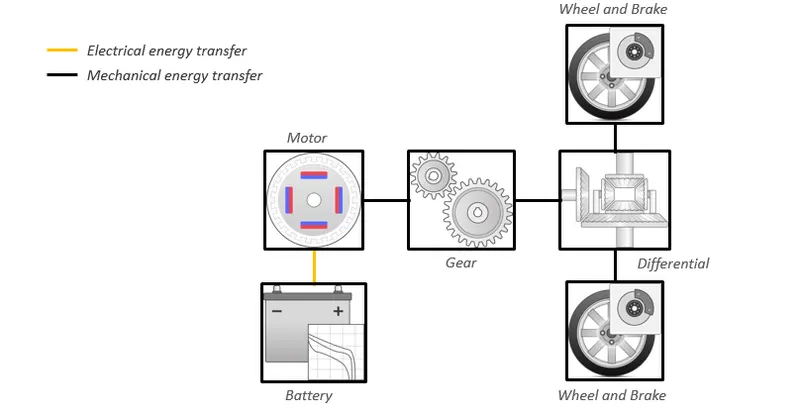
Main Components :
- Electric Motor
- Geartrain(box)
- Battery
- Differential
- Wheel and Brake
-- Drive Cycle Selected :- Wide Open Throttle(WOT) For 100seconds
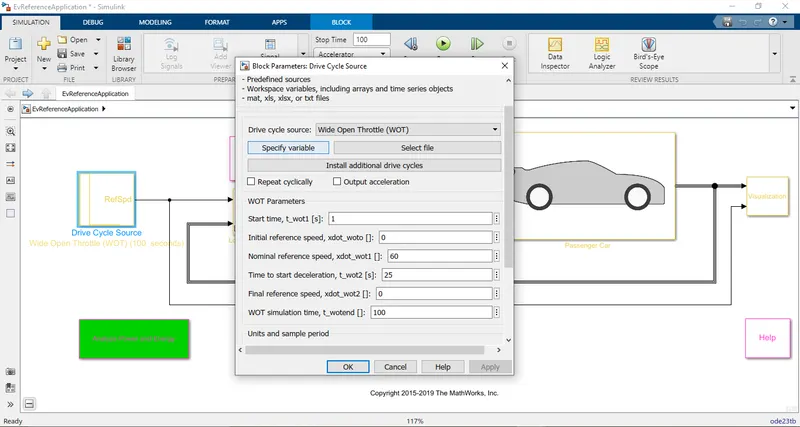
-- Parameters Updated>>Enviroment>>Grade&Wind Velocity
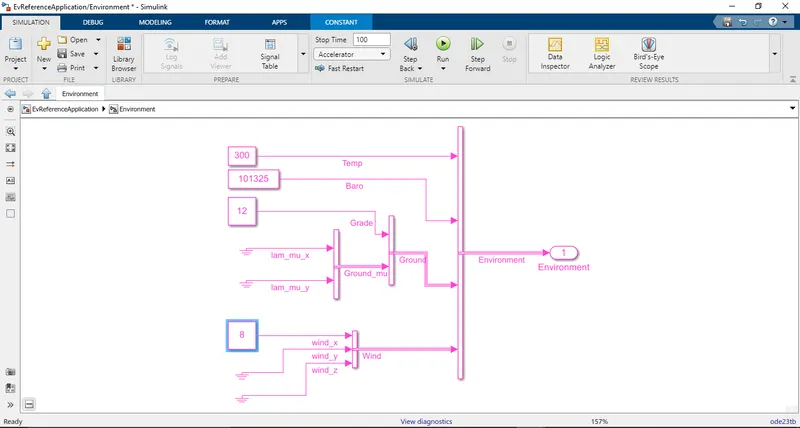
-- Output Results of EV Model
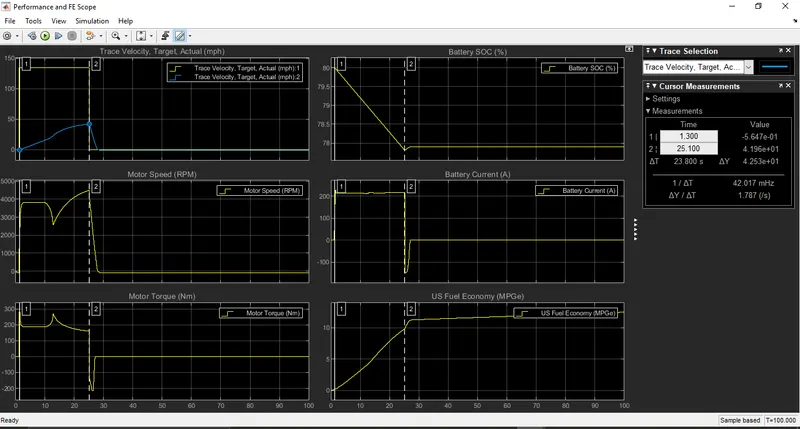
- We have considered Grade Angle = 12; Wind Velocity = 8; Simulation Time = 100seconds; WOT Deceleration = 25seconds
- We can observe from the output result that when the Full Throttle is been given for 25seconds the maximum speed of 42.53mph is acheived at time frame of 23.800seconds, after the 25 seconds time peroid the vehicle decelerates upto 100seconds.
- We also observe the Battery SOC falls upto 76% to reach the WOT(25seconds), as soon as the vehicle deceleration starts the regenrative braking system is enabled we can observe there is very less amount of current produced so the graph remains constant.
- We observe that the Battery draws Current around 200Amps upto 25seconds whereas during deceleration it gets charged around 120Amps and stops charging when the Electric Motor is turned 'OFF'.
-- Output Results of HEV Model
-- COMPARSION RESULT OF HEV & EV
| SR.NO | DESCRIPTION | HYBRID ELECTRIC VEHICLE | ELECTRIC VEHICLE |
| 1. | SPEED(MPH) | 37.9mph @19.899seconds | 42.53 @23.800seconds |
| 2. | BATTERY SOC(%) | LEVEL = 68% | LEVEL = 76% |
| 3. | BATTERY CURRENT(AMPS) | LEVEL = 500AMPS | LEVEL = 200AMPS |
- The first difference observed is in the speed the HEV achieved 37.9mph @19.899seconds whereas the EV achieved 42.53mph @23.80seconds here we can say the EV is more efficient due to less complexity and the Power source remaining at one point whereas in the HEV the Power source keeps on changing according to the Speed of the vehicle.
- The second difference observed was in the amount of Battery SOC in the case of HEV it went down upto 68% and once's the vehicle decelerates the regenerative braking system is activated we can observe the Battery SOC rising to 80% whereas, in the case of EV it went down upto 76% which was less compared to HEV but when the vehicle decelerates the regenerative system activated the amount of current produces is very less we can observe in the graph as there is no separate generator through which the battery can charge & in the case of EV the battery gets on depleted till its empty.