Final Project: Design of an Electric Vehicle
Final Project: Design of an Electric Vehicle
AIM: The aim of the project is to develop an electric vehicle model using Simulink software and carry out a system-level study of the same.
OBJECTIVES:
- System-Level Configuration
- Model Parameters
- Results
- Conclusion
THEORY
Introduction:
In the present world, the rate at which fossil fuels are being consumed is so alarming that if the trend continues, we would reach a stage where we will no longer have enough energy to power the world. If we keep burning fossil fuels at our current rate, it is generally estimated that all our fossil fuels will be depleted by 2060. In 2018, the demand for oil rose by 1.3% - which is almost double the average annual rate seen over the 10 years prior. With demand predominately driven by the transport sector, our oil reserves are running out faster than our other fossil fuels. In fact, if we don’t find any additional oil reserves, it’s estimated that our known oil deposits will be gone by 2052. So it is high time we shift to alternative sources of energy and utilize alternative methods to power the world.
Vehicle emissions are one of the major causes of urban traffic pollutions around the globe. Around the globe, the amount of CO, NO, and HC emissions are 60,50, and 30 percentages and it is caused by automobiles. The rapid growth of automobiles has caused some serious impacts like high oil consumption, traffic congestion, and an increase in the amount of Co2 in the atmosphere. Motor vehicles give off more than half of all carbon monoxide and hydrocarbon emissions. These emissions, including microscopic particles, can contribute to breathing and heart problems along with an elevated risk of cancer. Not just health problems but emissions from these vehicles can cause global warming with very high heat waves and can contribute to climate change, which is the priority calling of the 21st century. Because of all the above reasons, we are undergoing a shift from conventional IC engine vehicles to electric-powered vehicles.
As EVs become more mainstream, the costs are dropping rapidly and there are a wide variety of benefits for drivers making the switch. From the environmental impact to the savings you can make on fuel, tax, and maintenance costs, electric vehicles could help you save significant amounts of money. Some of the major benefits of IC engine are listed below:
- COST OF ELECTRIC CARS: EVs offer an outstanding value over the long term and can be an excellent investment for drivers looking for a cheaper, more efficient way to get around.
- CHEAPER TO MAINTAIN: From tax incentives and special government grants to enhanced fuel efficiency, the lower cost of electricity, and reduced maintenance requirements, you could spend far less on an electric vehicle than you do on your current car.
- BETTER FOR THE ENVIRONMENT: Fully electric cars have zero tailpipe emissions making them greener, cleaner, and better for the environment than petrol or diesel cars. A Plug-in hybrid pairs a small battery and electric motor, with a typical range of around 30 miles, with fuel-efficient petrol or diesel engine. Plug-in hybrids driven in electric mode emit zero tailpipe emissions and the electric range is well within the average UK daily distance driven of 30 miles. With newer technology helping create even more environmentally-friendly batteries, advances in hydrogen, and even more efficient, quieter EV motors, the future of driving is bright and clean.
- FAST AND EASY HOME CHARGING: Once installed, you’ll be able to charge your EV by simply plugging in the charging cable when you’ve parked up. It’s as easy as charging your mobile phone. Using a 7kW home charging port, most EVs can charge to full capacity in around 5- 10 hours so your car will be ready to go when you are. Rapid chargers can speed up the process, even more, charging most cars to about 80% in under an hour.
Classification:
There are mainly 3 kinds of electric vehicles:
- BEV
- HEV
- PHEV
1. BEV (battery operated electric vehicle)
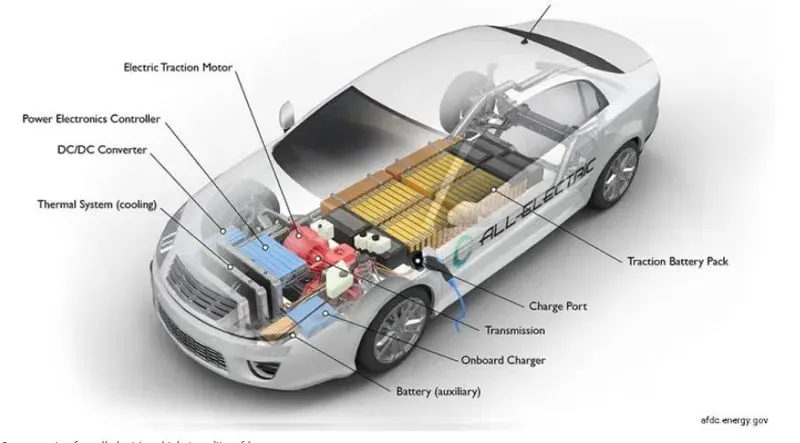
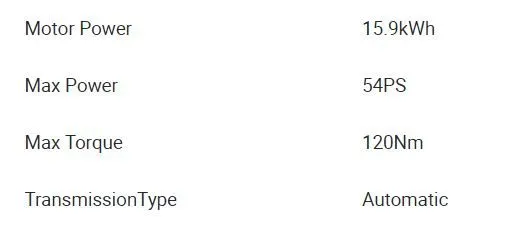
- These are the vehicles that are fully electric and do not contain any other source of actuation other than batteries and motors.
- There is zero emission in these motors
- The battery is charged by an external power source such as DC fast charger or AC fast charger.
- On average, BEV takes around 8 hrs to get fully charged but this time can be reduced to 1 hr with a DC fast charger.
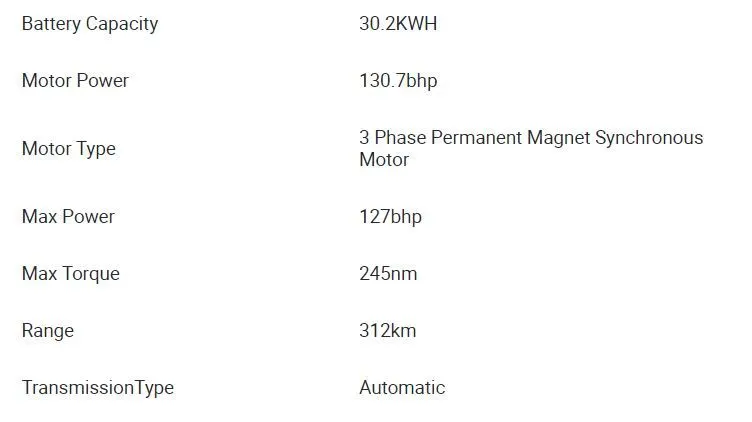
- The range of these vehicles is between 250-500 kilometers
Examples are:
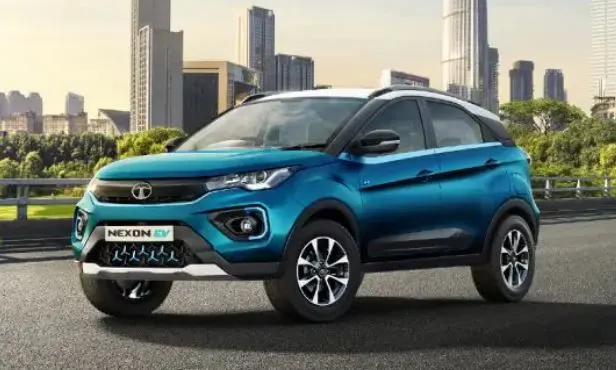
1. Tata Nexon EV
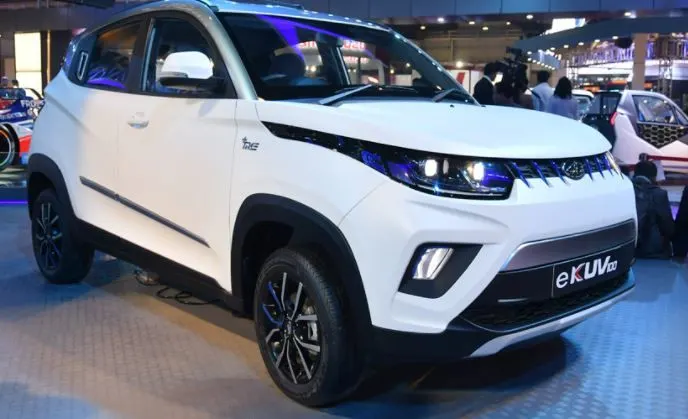
2. Mahindra Ekuv
2. (PHEV)PLUG -IN HYBRID ELECTRIC VEHCILES
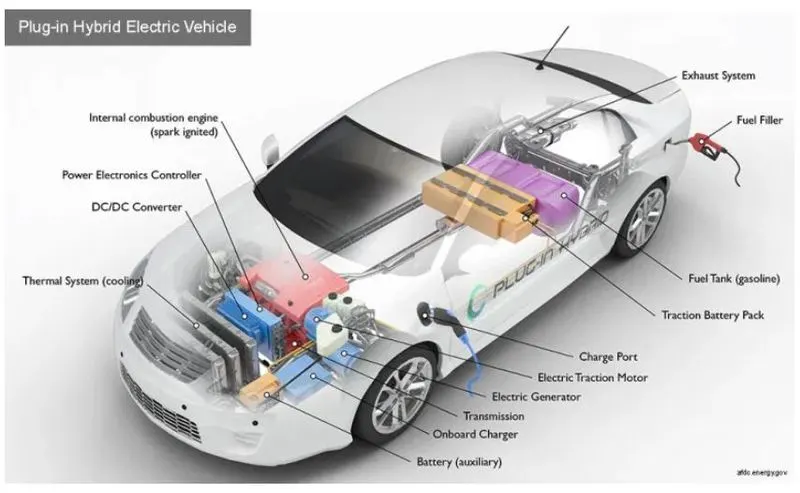
- They can recharge their battries through regen braking or via an external source
- The HEVs travel about 3-4kms before the engine is switched on
- PHEVs can go up to 65kms before the engine provides the required assistance for the propulsion of the vehicle.
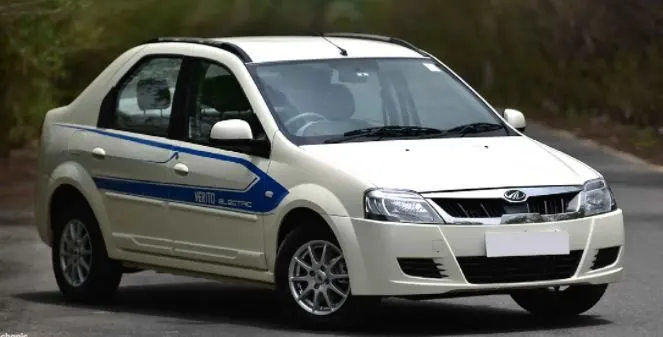
Examples:
1.Mahindra e-Verito

3. HYBRID VEHICLES
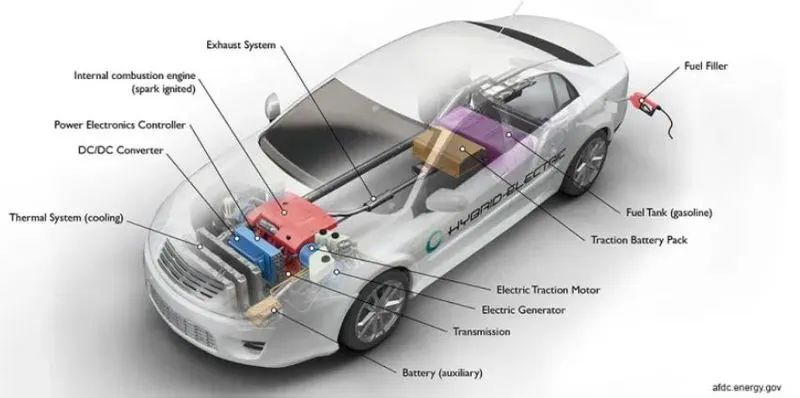
- Powered by both electricity and fuel.
- They don't have an external electric port but the battery gets recharged by regenerative braking.
- Electric motos start the EV but the propulsion is carried out by engine
- The work is controlled by the engine control unit
Example:
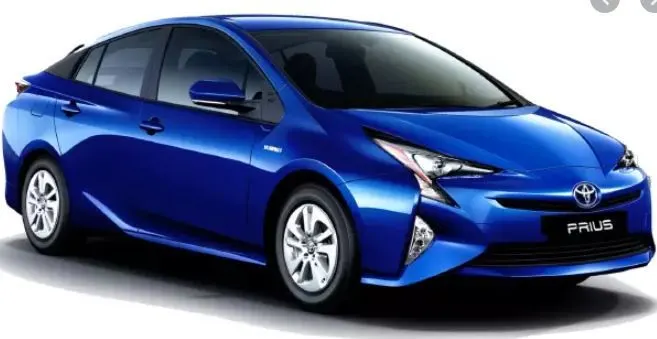
1. Toyota Prius
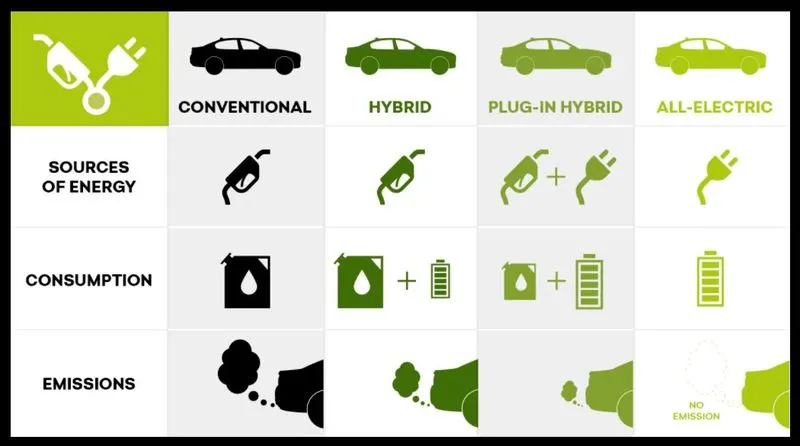
A small comparison can be understood from the following fig:
THERE ARE FURTHER CLASSIFICATIONS :
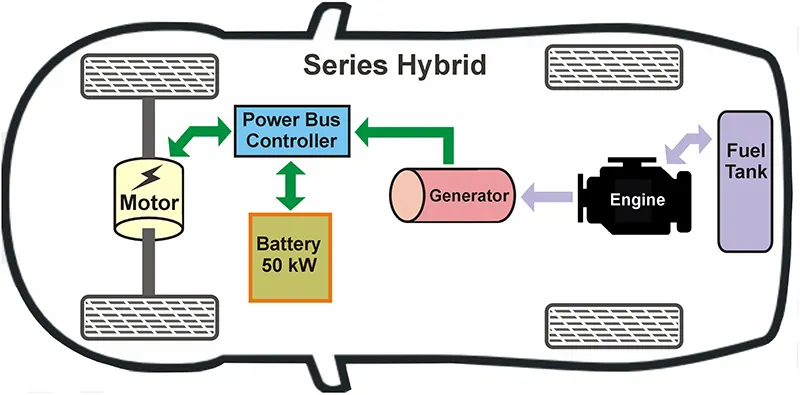
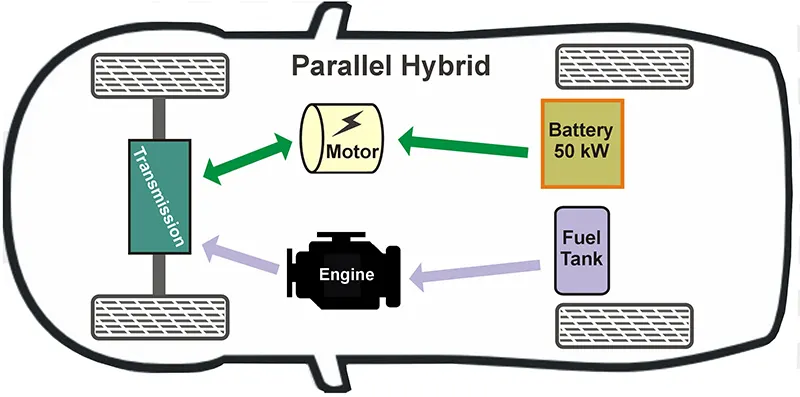
Hybrid electric vehicles (HEVs) can be broken down further into sub-forms. In principle, there are two ways of doing this. In the first method, they are classified according to the drivetrain set-up, as series, parallel and power-split hybrids.
A SERIES HYBRID
is always powered purely by the electric motor. The internal combustion engine is there only to recharge the batteries. This hybrid comes to the fore in urban traffic and, above all, in stop-and-go driving, where conventional cars’ internal combustion engines are less efficient.
A PARALLEL HYBRID
can be powered either by the internal combustion engine alone, by the electric motor alone, or by both combined. It is more efficient than a series hybrid at higher speeds when it can draw on the potential offered by the two-motor combo if the need arises.
A POWER-SPLIT HYBRID
can switch between the series and parallel modes to harness the advantages of each. This means that it can be powered by an electric motor only, by an internal combustion engine only, or by a combination of the two.
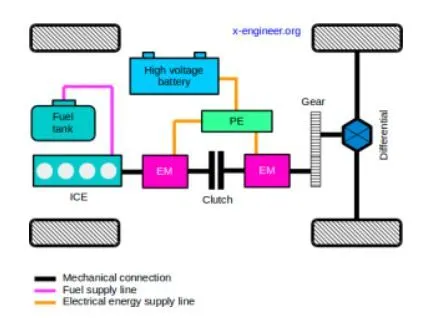
The second method classifies hybrid electric vehicles, according to their degree of hybridization, like micro, mild, full, and plug-in hybrids.
MICRO-HYBRID
All that stands a micro-hybrid apart from an ordinary internal combustion engine vehicle is its start-stop system and brake energy regeneration. A micro-hybrid uses this recovered energy to recharge the 12V battery, resulting in reduced fuel consumption by the internal combustion engine and hence lower CO2 emissions. (This may sound like we are stating the obvious, but five to ten years ago micro hybrids were a huge topic of conversation around the world.)
A MILD HYBRID
is fitted with an electric motor, but still uses an internal combustion engine to power the wheels throughout each journey. The electric motor’s role in traffic is to assist the ICE, for example, when starting off or accelerating. It tends to be accompanied by an auxiliary battery with a larger electricity capacity to enhance the regenerative braking. This, in turn, boosts fuel efficiency further, thereby pushing down CO2 emissions.
A FULL HYBRID
can be driven solely on electric propulsion, the only limiting factor being the battery capacity.
Now there is also a category of vehicles that uses hydrogen as a fuel for propulsion. They are FCEVs abbreviation for Fuel Cell Electric Vehicles. A fuel cell electric vehicle (FCEV), like a BEV, only has an electric motor, but it uses a different method to store and extract electricity. In FCEVs, much of the traction battery is replaced by a hydrogen tank and a set of fuel cells in which a chemical reaction transforms hydrogen into electricity and water vapor. This may sound like a highly promising solution, but when we take into account the design complexity and production costs, hydrogen remains a long way off. THIS IS AN AREA OF HIGH PROSPECTS.
------------------------------------------------------------------------------------------------------------------------------------
THE MAIN AIM OF THE PROJECT IS TO DEVELOP A SIMULINK MODEL OF AN ELECTRIC VEHICLE FROM SCRATCH AND SIMULATE IT WITH A DRIVE CYCLE AND OBTAIN THE OUTPUTS
To develop the model, we need Simulink software with a Powertrain Block set library. It provides fully assembled reference application models of automotive powertrains, including gasoline, diesel, hybrid, and electric systems. It includes a component library for simulating engine subsystems, transmission assemblies, traction motors, battery packs, and controller models. Powertrain Blockset also includes a dynamometer model for virtual testing. MDF file support provides a standards-based interface to calibration tools for data import.
The following are the main components used for the same:
1. Drive cycle Source
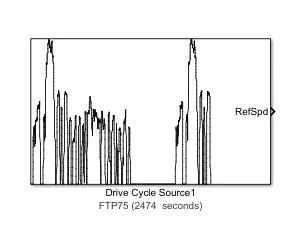
The Drive Cycle Source block generates a standard or user-specified longitudinal drive cycle. The block output is the specified vehicle longitudinal speed, which you can use to.
Drive cycles from predefined sources. By default, the block includes the FTP–75 drive cycle. To install additional drive cycles from a support package, see Install Drive Cycle Data. The support package has drive cycles that include the gear shift schedules, for example, JC08 and CUEDC.
2. Longitudinal driver
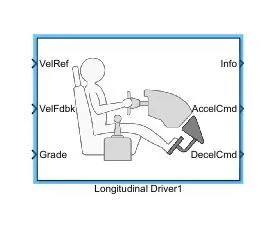
The Longitudinal Driver block implements a longitudinal speed-tracking controller. Based on reference and feedback velocities, the block generates normalized acceleration and braking commands that can vary from 0 through 1. You can use the block to model the dynamic response of a driver or to generate the commands necessary to track a longitudinal drive cycle.
3. Controlled PWM source
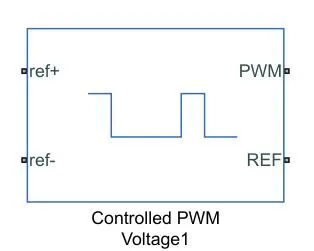
The Controlled PWM Voltage block represents a pulse-width modulated (PWM) voltage source. The block has two modeling variants, accessible by right-clicking the block in your block diagram and then selecting the appropriate option from the context menu, under Simscape > Block choices:
Electrical input ports — The block calculates the duty cycle based on the reference voltage across its ref+ and ref- ports. This modeling variant is the default.
PS input — Specify the duty cycle value directly by using an input physical signal port.
4. H-bridge
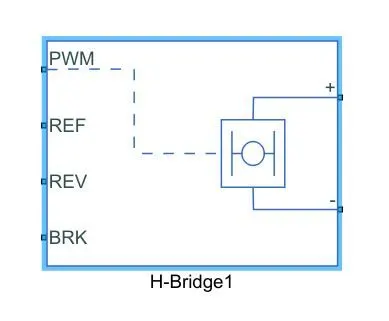
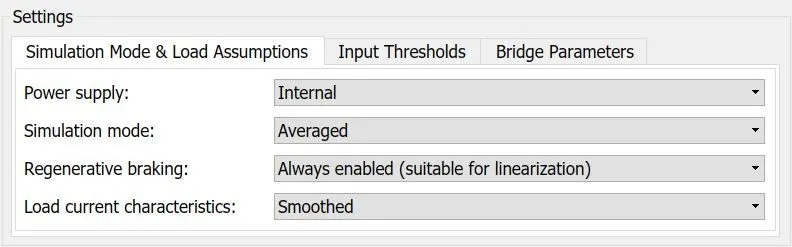
The H-Bridge block represents an H-bridge motor driver. The block has the following two Simulation mode options:
Set the Simulation mode parameter to Averaged to speed up simulations when driving the H-Bridge block with a Controlled PWM Voltage block. You must also set the Simulation mode parameter of the Controlled PWM Voltage block to Averaged mode. This applies the average of the demanded PWM voltage to the motor. The accuracy of the Averaged mode simulation results relies on the validity of your assumption about the load current. If you specify that the current is Unsmoothed or discontinuous, then the accuracy also depends on the values you provide for load resistance and inductance being representative. This mode also makes some simplifying assumptions about the underlying equations for the case when the current is discontinuous. For typical motor and bridge parameters, accuracy should be within a few percent. To verify Averaged mode accuracy, run the simulation using the PWM mode and compare the results to those obtained from using the Averaged mode.
5. Vehicle Body
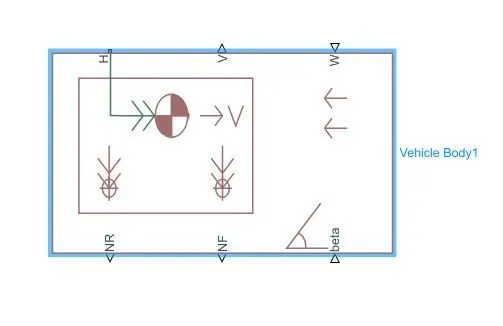
The Vehicle Body block represents a two-axle vehicle body in longitudinal motion. The vehicle can have the same or a different number of wheels on each axle. For example, two wheels on the front axle and one wheel on the rear axle. The vehicle wheels are assumed identical in size. The vehicle can also have a center of gravity (CG) that is at or below the plane of travel.
The block accounts for body mass, aerodynamic drag, road incline, and weight distribution between axles due to acceleration and road profile. Optionally include pitch and suspension dynamics. The vehicle does not move vertically relative to the ground.
The block has an option to include an externally defined mass and an externally defined inertia. The mass, inertia, and center of gravity of the vehicle body can vary over the course of simulation in response to system changes.
6. Tire
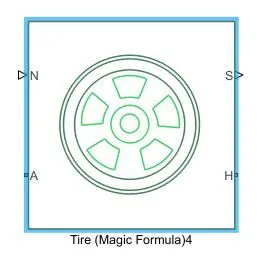
The Tire (Magic Formula) block models a tire with longitudinal behavior given by the Magic Formula, an empirical equation based on four fitting coefficients. The block can model tire dynamics under constant or variable pavement conditions.
The Tire (Magic Formula) block models the tire as a rigid wheel-tire combination in contact with the road and subject to slip. When torque is applied to the wheel axle, the tire pushes on the ground (while subject to contact friction) and transfers the resulting reaction as a force back on the wheel. This action pushes the wheel forward or backward. If you include the optional tire compliance, the tire also flexibly deforms under load.
. Dc Motor
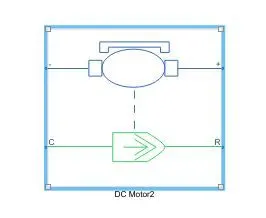
The DC Motor block represents the electrical and torque characteristics of a DC motor using the following equivalent circuit model:
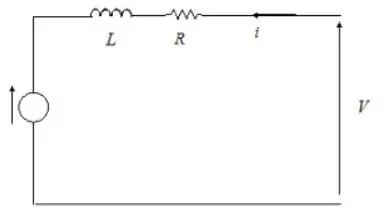
You specify the equivalent circuit parameters for this model when you set the Model parameterization parameter to By equivalent circuit parameters. The resistor R corresponds to the resistance you specify in the Armature resistance parameter. The inductor L corresponds to the inductance you specify in the Armature inductance parameter.
THE MODEL:
The overall model of the EV is given below:
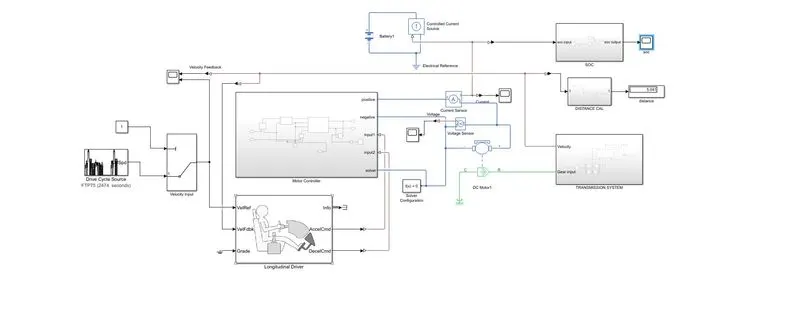
fig(1)
The sub-system models are:
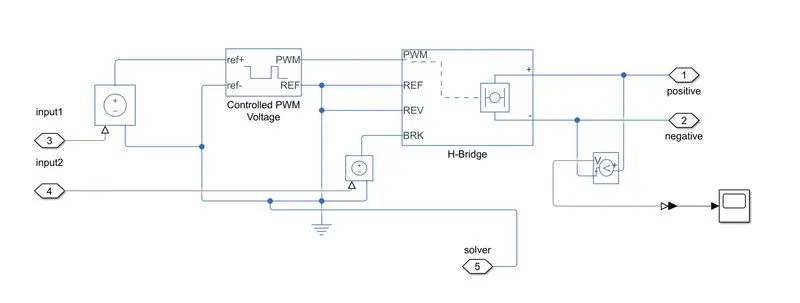
1. The PWM-input sus-system
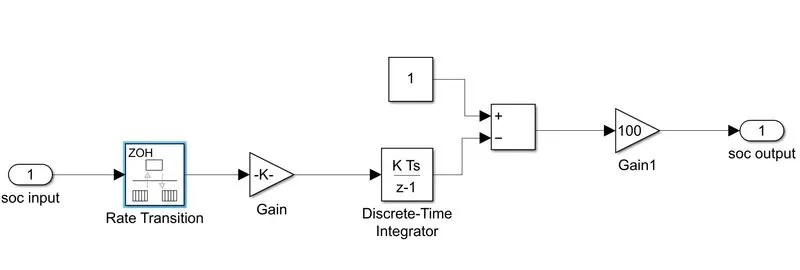
2. SOC sub-system
3. Transmission sub-system
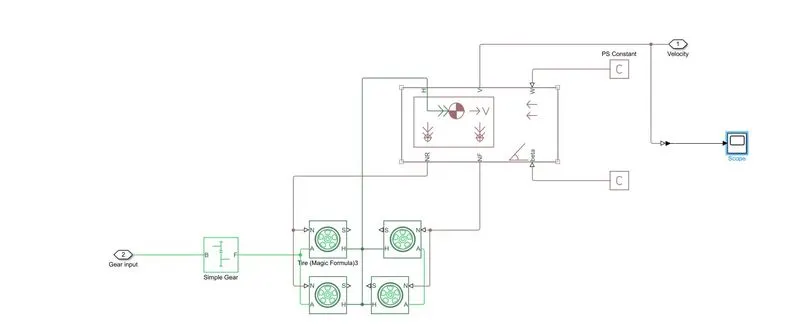
DETAILED EXPLANATION OF THE MODEL
1. The input to the system is given from a drive cycle. The Drive Cycle Source Block is used for the same purpose.
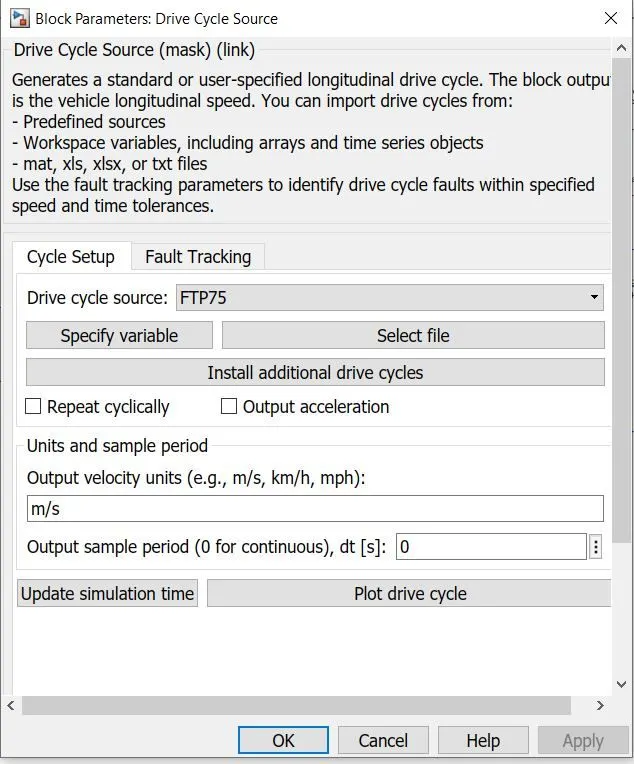
From the drive cycle source, we can change the Drive cycle. Here the FTP75 drive cycle is considered.
2. The connection from the drive cycle is given to the Longitudinal drive block via a Multiport switch. So the driver receives the velocity input from the drive cycle via this port
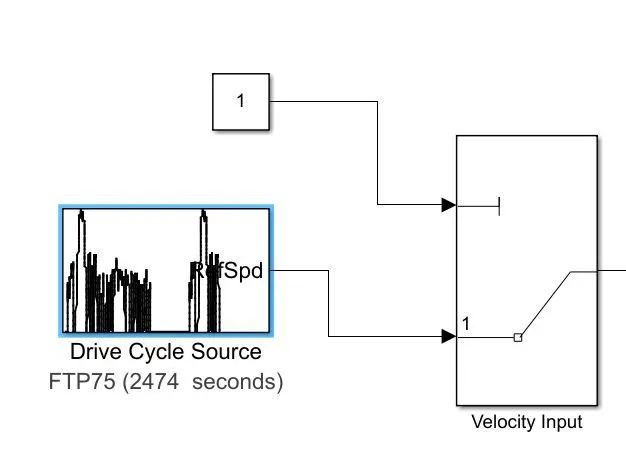
3. The velocity input from the drive cycle is taken into the Longitudinal Driver Block via the 'Velref' input. This value is compared with the actual velocity of the vehicle which is taken from the 'Transmission Sub-system' via the 'VelFdbk'. Here this acts as a PI controller and according to the required speed, the vehicle gives further commands.
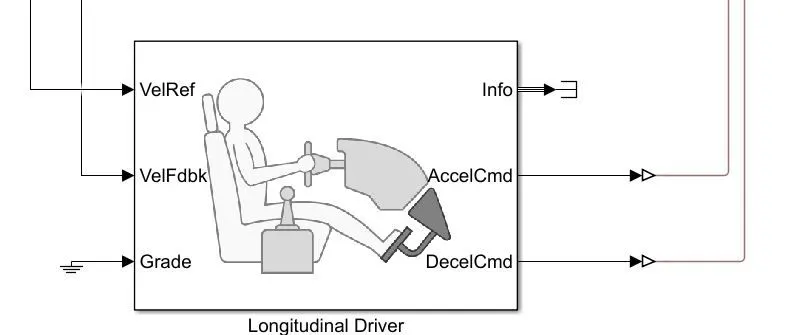
4. With respect to the Reference velocity and feedback velocity, the accel and decel command is given to the PWM source.
If the vehicle speed is more than the reference speed, brakes are applied otherwise acceleration is applied.
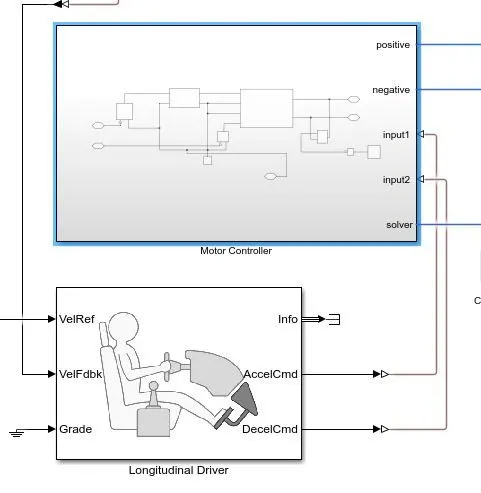
5. Now once the acceleration or brake is applied, the command goes into the PWM generator.
- Now, the acceleration input is given to Input 1
- Brake input is given to input 2
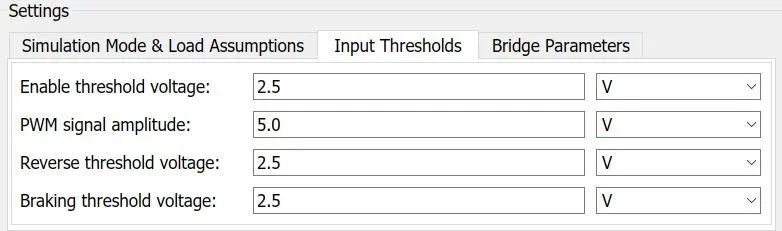
- In the controlled PWM voltage block, all the values are assigned and the connection is given to H bridge
- Since the power source is internal, the energy is obtained from the H bridge source itself
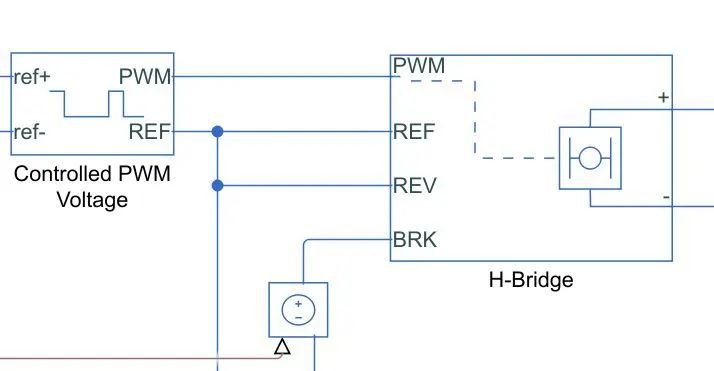
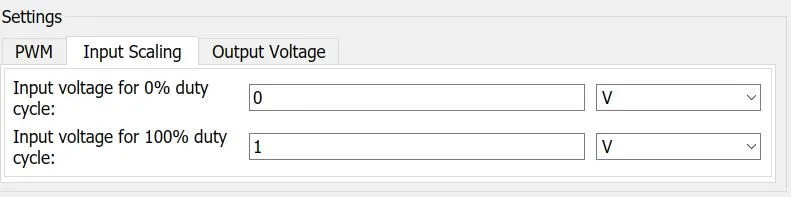
H block Parameters
6. Now, the output from the H bridge is connected to the DC motor. This determines the voltage that is required for the dc machine to operate. This DC machine is further connected to the gear, which makes the rear-wheel rotate.
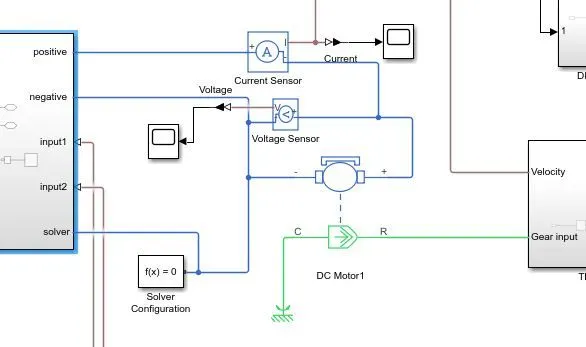
Voltage and current sensors are used to find the DC motor current and the SOC of the battery.
7. The transmission system is what that controls how fast the wheels should rotate, which is controlled by the DC motor.
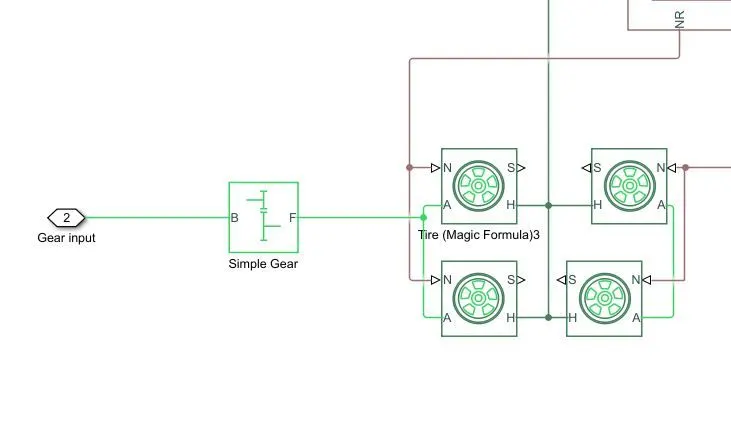
The output of the DC machine is connected to the gear, which is further connected to the wheels. The wheels are connected to the vehicle body Block.
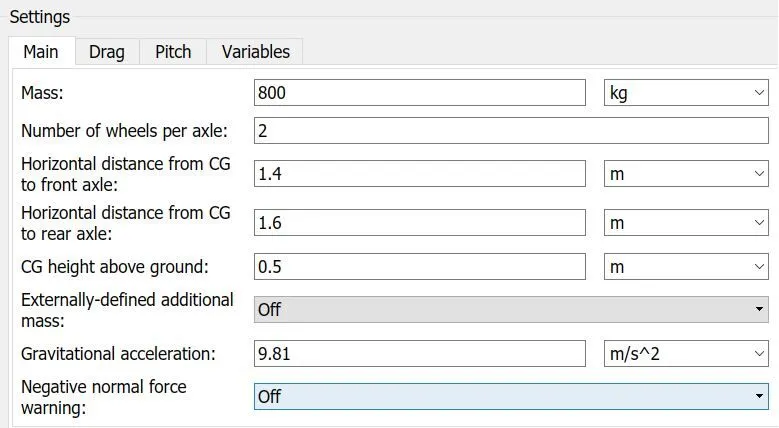
Vehicle body parameters can be changed accordingly.
8. The SOC sub-system gives us how the battery is discharged throughout the whole drive cycle. It has
- gain block
- time integrator
- sum block
- rate transition
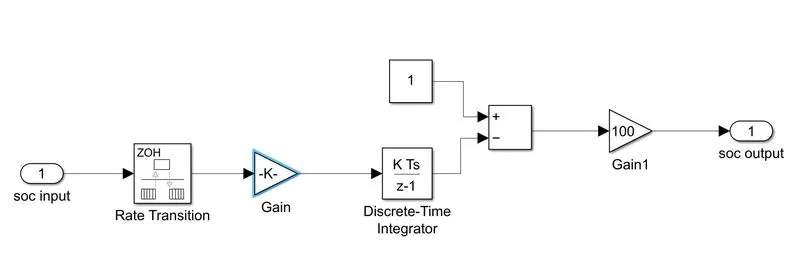
- input from the battery is given to the rate transition block. The Rate Transition block transfers data from the output of a block operating at one rate to the input of a block operating at a different rate.
- The current signal is multiplied by the gain block. The gain block has the value (1/(80*3600)) which is the rated amp hr of the battery.
- This is further connected to a discrete-time integrator. This performs an integration. This is further subtracted from the constant block (1) which denotes 100% SOC.
- Now a gain block is used and the obtained value is multiplied by 100 to get the SOC in percentage
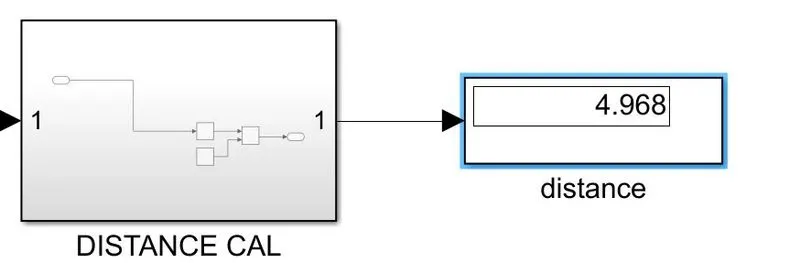
8.In order to calculate the total distance traveled:
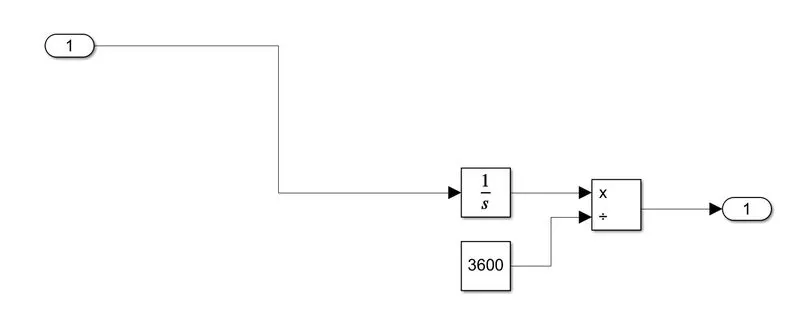
As the integration of velocity gives distance, we use the integrator block. The value is divided by 3600 in order to get the value in Kilomenters.
RESULTS
1. The graph between actual velocity and feedback velocity
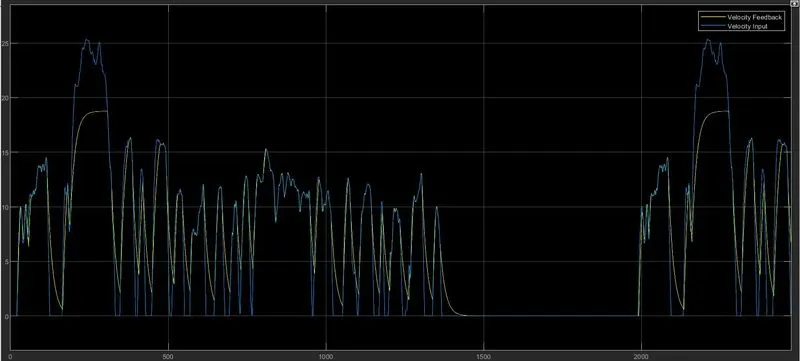
- In the best-case scenario, both the graphs should overlap but the current graph shows considerable variations in the input and feedback velocity.
- These changes can be due to many factors like, vehicle inertia,transmission system, curb weight of the vehicle, road conditions or motor parameters
2. SOC sub-system
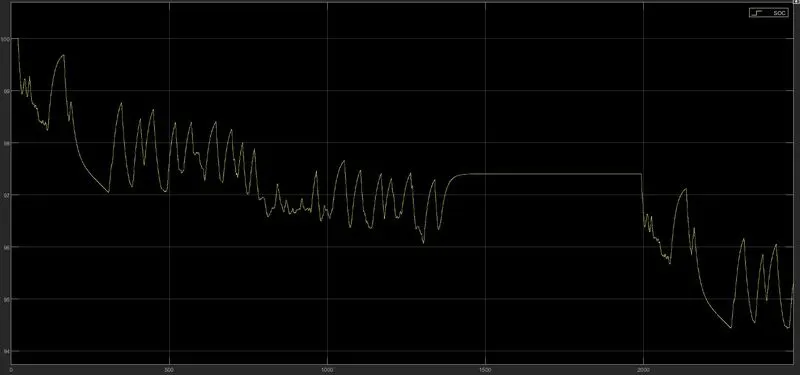
- The state of charge shows how the battery is drained by the end of the drive cycle
- The peaks in the graph show the regenerative action of the motor where it acts as a generator.
- The power is sent back to the battery where it is charged again.
3. DC current
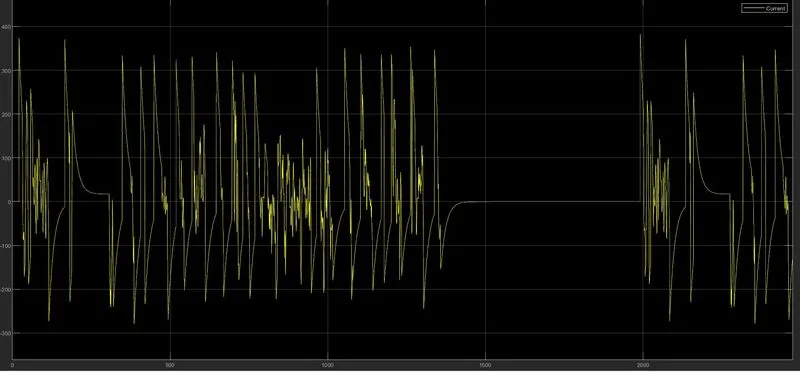
It can be seen that current sometimes becomes negative. This means that the motor is acting as a generator.
From 1300- 2000 it is seen that the value is current is 0. This can be because the vehicle has come to standstill
4. The distance traveled is calculated
------------------------------------------------------------------------------------------------------------------------------------------
CONCLUSION: THE EV MODEL WAS DESIGNED, SIMULATED AND THE RESULTS WERE PLOTTED AND ANALYZED