Final Project: Design of an Electric Vehicle
AIM:
To design a MATLAB model of electric car which uses a battery and a DC motor and simulate under various configurations.
OBJECTIVES:
- Select a suitable configuration of an electric car model
- Selecting various specifications for every component
- Modelling the vehicle and simulating under varying parameters
- Compare and analyse the results for different driving conditions and parameters.
ABSTRACT:

About Electric Vehicles During the last few decades, environmental impact of the petroleum-based transportation infrastructure, along with the peak oil, has led to renewed interest in an electric transportation infrastructure. Electric vehicles differ from fossil fuel-powered vehicles in that the electricity they consume can be generated from a wide range of sources, including fossil fuels, nuclear power, and renewable sources such as tidal power, solar power, and wind power or any combination of those. An electric vehicle (EV), also referred to as an electric drive vehicle, uses one or more electric motors or traction motors for propulsion. Three main types of electric vehicles exist, those that are directly powered from an external power station, those that are powered by stored electricity originally from an external power source, and those that are powered by an on-board electrical generator, such as an internal combustion engine (a hybrid electric vehicle) or a hydrogen fuel cell. Electric vehicles include electric cars, electric trains, electric lorries, electric aeroplanes, electric boats, electric motorcycles and scooters and electric spacecraft. Proposals exist for electric tanks, diesel submarines operating on battery power are, for the duration of the battery run, electric submarines, and some of the lighter UAVs are electrically-powered. Electric vehicles first came into existence in the mid-19th century, when electricity was among the preferred methods for motor vehicle propulsion, providing a level of comfort and ease of operation that could not be achieved by the gasoline cars of the time. The internal combustion engine (ICE) is the dominant propulsion method for motor vehicles but electric power has remained commonplace in other vehicle types, such as trains and smaller vehicles of all types.
PURPOSE OF SIMULATION
This is easier said than done. The development of an electric vehicle is very complex, with a need for multiple new technologies and systems that are highly interdependent upon one another. Engineers need to integrate and connect these new technologies and systems. These include the electric powertrain, which is perhaps the biggest difference between electric cars and traditional vehicles and includes the battery, e-drive and power electronics. New communication systems, including antennas and sensors for autonomous vehicles, are also involved, as well as additional electronics.
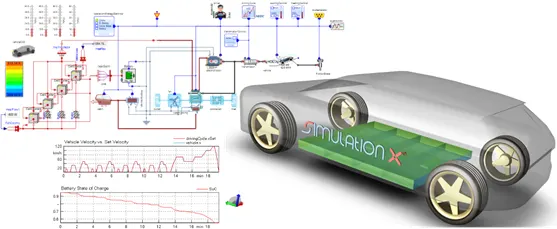
These components all interact with each other and must be carefully engineered so that they work together for optimal vehicle performance. The battery range, for example, is affected by the overall aerodynamics of the car, which have an impact on cooling and energy consumption. Meanwhile, the position and weight of the battery affects the ride and handling of the vehicle. While traditional vehicles can be built one isolated component at a time, electric vehicles require a holistic approach.
Simulation enables a new way of designing vehicles. It allows engineers to fully design a vehicle in a virtual environment and to layout each component alongside the others before testing their ability to work together. These components can be tested in real-world conditions long before they ever make it to the real world, so that when the engineers finally assemble the physical vehicle, they already know how everything will connect, interact, and operate.
Simulation also enables engineers to gain insights on how to improve their designs and assess multiple options before selecting the best choice. 3DEXPERIENCE facilitates a holistic approach to engineering electric vehicle systems as it can integrate different simulation disciplines by referring to a common design model. This creates a full virtual replication of complex systems.
There are plenty of statistics that point to simulation being a powerful tool in the development of electric vehicles. It can reduce electric drive development time and cost by up to 33 percent, and cut back on battery development cycle by as much as half. Battery enclosure weight can also be reduced by up to 33 percent, and aerodynamic drag brought down by up to 25 percent. Meanwhile, antenna placement testing, a crucial factor especially as cars become autonomous as well, can take as little as one day with simulation, as opposed to four weeks without.
Experts predict that electric vehicle adoption will reach critical mass within the next five to six years, a remarkably short time considering how dramatically they will change the face of the automotive industry. Approximately 130 electric vehicle models will be introduced by 2022, as well. Manufacturers must act quickly to keep up with the progression of electric – not to mention autonomous – vehicles, and the use of simulation will be critical in helping them to do so while also reducing cost and ensuring safe and well-performing cars.
BLOCK DIAGRAM:
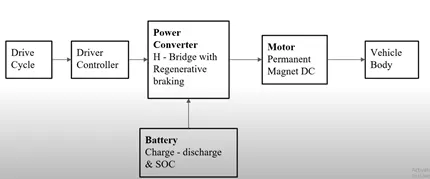
The following is the block diagram of the EV consisting of various components:
- Vehicle Body (chassis with transmission)
- Propulsion motor(DC)
- Controller (H-bridge chopper)
- Battery (DC)
- Driver input
- Driver controller
VEHICLE CONFIGURATION
There are many configurations of the Electric vehicles out in the EV industry, this involves range components of various components with their layout and propulsion requirement.
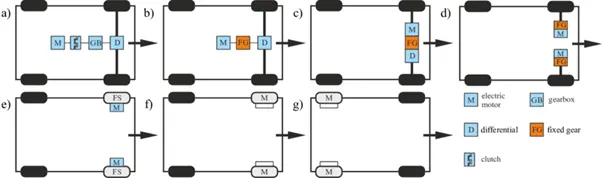
Fig. types of configurations
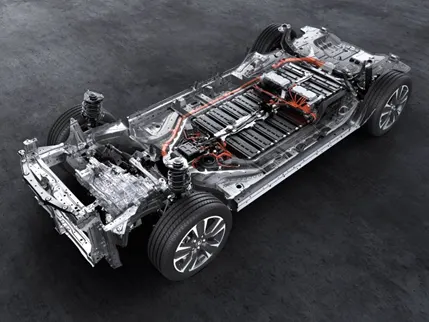
Fig. A typical powertrain configuration
This is a basic and simple electric vehicle configuration powered by a single propulsion motor powering two wheels (FWD/RWD) with most common layout shown below,
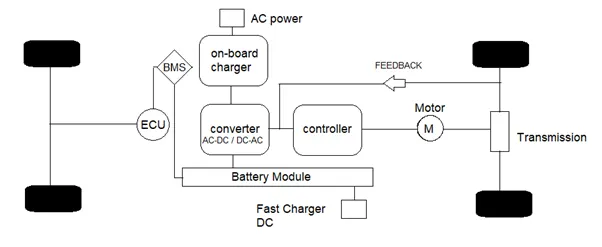
Fig. Basic layout of an electric vehicle
PARAMETERS INVOLVED IN DESIGN OF THE VEHICLE
|
S.NO |
PARAMETERS
|
|
1. Weight of the vehicle 2. Rolling resistance coefficient 3. Density of the air medium (rho) 4. The frontal area of the car 5. The coefficient of drag 6. Gear ration ‘ G’ 7. Tyre radius “ r ” 8. The battery armature voltage 9. The battery armature current 10. The motor ratings 11. Power controller used |
800 kg 0.015 1.225 3 m^2 0.4 3:7 25 inch 350V 350A 75KW 330V Rated H BRIDGE |
SYSTEM LEVEL CONFIGURATION
- VEHICLE DYNAMICS
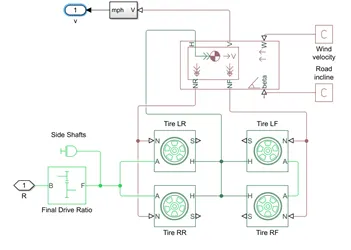
The vehicle dynamics Mainly represents the vehicle body and its physical environment. It consists various blocks mainly the tires with axle, gear transmission and vehicle chassis.
Tire(magic formula)
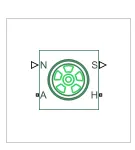
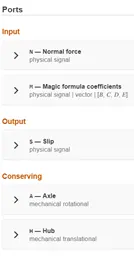
The Tire (Magic Formula) block models a tire with longitudinal behavior given by the Magic Formula [1], an empirical equation based on four fitting coefficients. The block can model tire dynamics under constant or variable pavement conditions.
The longitudinal direction of the tire is the same as its direction of motion as it rolls on pavement. This block is a structural component based on the Tire-Road Interaction (Magic Formula) block.
To increase the fidelity of the tire model, you can specify properties such as tire compliance, inertia, and rolling resistance. However, these properties increase the complexity of the tire model and can slow down simulation. Consider ignoring tire compliance and inertia if simulating the model in real time or if preparing the model for hardware-in-the-loop (HIL) simulation.
Vehicle body
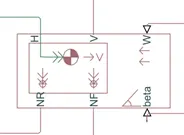
https://www.mathworks.com/help/releases/R2020a/physmod/sdl/ref/vehiclebody.html
The Vehicle Body block represents a two-axle vehicle body in longitudinal motion. The vehicle can have the same or a different number of wheels on each axle. For example, two wheels on the front axle and one wheel on the rear axle. The vehicle wheels are assumed identical in size. The vehicle can also have a center of gravity (CG) that is at or below the plane of travel.
The block accounts for body mass, aerodynamic drag, road incline, and weight distribution between axles due to acceleration and road profile. Optionally include pitch and suspension dynamics. The vehicle does not move vertically relative to the ground.
The block has an option to include an externally-defined mass and an externally-defined inertia. The mass, inertia, and center of gravity of the vehicle body can vary over the course of simulation in response to system changes.
Simple Gear
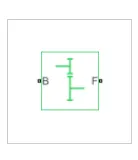
https://www.mathworks.com/help/releases/R2020a/physmod/sdl/ref/simplegear.html
The Simple Gear block represents a gearbox that constrains the connected driveline axes of the base gear, B, and the follower gear, F, to corotate with a fixed ratio that you specify. You choose whether the follower axis rotates in the same or opposite direction as the base axis. If they rotate in the same direction, the angular velocity of the follower, ωF, and the angular velocity of the base, ωB, have the same sign. If they rotate in opposite directions, ωF and ωB have opposite signs.
2.DC PROPULSION MOTOR WITH CONTROLLER
DC motor
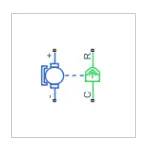
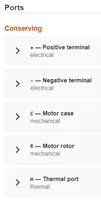
This block represents the electrical and torque characteristics of a DC motor.
The block assumes that no electromagnetic energy is lost, and hence the back-emf and torque constants have the same numerical value when in SI units. Motor parameters can either be specified directly, or derived from no-load speed and stall torque. If no information is available on armature inductance, this parameter can be set to some small non-zero value.
When a positive current flows from the electrical + to - ports, a positive torque acts from the mechanical C to R ports. Motor torque direction can be changed by altering the sign of the back-emf or torque constants.
https://www.mathworks.com/help/releases/R2020a/physmod/sps/ref/dcmotor.html#brebfy9-7
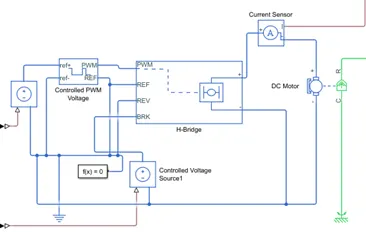
H-bridge motor driver
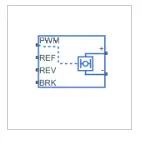
This block represents an H-bridge motor drive. The block can be driven by the Controlled PWM Voltage block in PWM or Averaged mode. In PWM mode, the motor is powered if the PWM port voltage is above the Enable threshold voltage. In Averaged mode, the PWM port voltage divided by the PWM signal amplitude parameter defines the ratio of the on-time to the PWM period. Using this ratio and assumptions about the load, the block applies an average voltage to the load that achieves the correct average load current. The Simulation mode parameter value must be the same for the Controlled PWM Voltage and H-Bridge blocks.
If the REV port voltage is greater than the Reverse threshold voltage, then the output voltage polarity is reversed. If the BRK port voltage is greater than the Braking threshold voltage, then the output terminals are short circuited via one bridge arm in series with the parallel combination of a second bridge arm and a freewheeling diode. Voltages at ports PWM, REV and BRK are defined relative to the REF port.
https://www.mathworks.com/help/releases/R2020a/physmod/sps/ref/hbridge.html
Controlled PWM Voltage
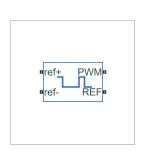
https://www.mathworks.com/help/releases/R2020a/physmod/sps/ref/controlledpwmvoltage.html.
This block creates a Pulse-Width Modulated (PWM) voltage across the PWM and REF ports. The output voltage is zero when the pulse is low, and is equal to the Output voltage amplitude parameter when high. Duty cycle is set by the input value. Right-click the block and select Simscape-> Block choices to switch between electrical +ref/-ref ports and PS input u to specify the input value.
At time zero, the pulse is initialized as high unless the duty cycle is set to zero or the Pulse delay time is greater than zero.
3.BATTERY PACK
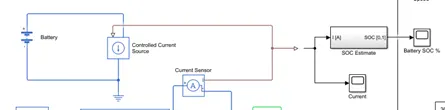
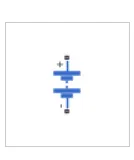
Battery.
https://www.mathworks.com/help/releases/R2020a/physmod/sps/ref/battery.html
This block models a battery. If you select Infinite for the Battery charge capacity parameter, the block models the battery as a series internal resistance and a constant voltage source. If you select Finite for the Battery charge capacity parameter, the block models the battery as a series internal resistance plus a charge-dependent voltage source defined by:
V = Vnom*SOC/(1-beta*(1-SOC))
where SOC is the state of charge and Vnom is the nominal voltage. Coefficient beta is calculated to satisfy a user-defined data point [AH1,V1].
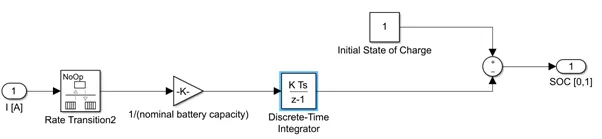
4.SOC Estimate
5.DRIVER INPUT WITH DRIVER CONTROLLER
Longitudinal driver
https://www.mathworks.com/help/releases/R2020a/autoblks/ref/longitudinaldriver.html
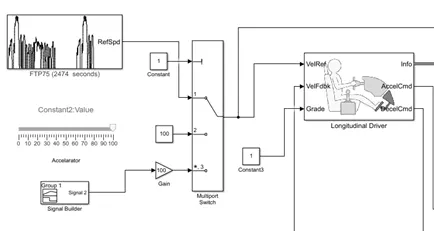
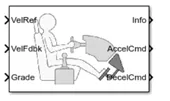
A parametric longitudinal speed tracking controller for generating normalized acceleration and braking commands based on reference and feedback velocities.Use the external actions to input signals that can disable, hold, or override the closed-loop commands determined by the block. The block uses this priority for the input commands: disable, hold, override.
The Longitudinal Driver block implements a longitudinal speed-tracking controller. Based on reference and feedback velocities, the block generates normalized acceleration and braking commands that can vary from 0 through 1. You can use the block to model the dynamic response of a driver or to generate the commands necessary to track a longitudinal drive cycle.
Drive cycle
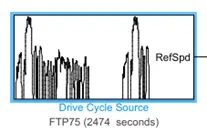
https://www.mathworks.com/help/releases/R2020a/autoblks/ref/drivecyclesource.html
The Drive Cycle Source block generates a standard or user-specified longitudinal drive cycle. The block output is the specified vehicle longitudinal speed, which you can use to:
Predict the engine torque and fuel consumption that a vehicle requires to achieve desired speed and acceleration for a given gear shift reference.
Produce realistic velocity and shift references for closed loop acceleration and braking commands for vehicle control and plant models.
Study, tune, and optimize vehicle control, system performance, and system robustness over multiple drive cycles.
Identify the faults within tolerances specified by standardized tests, including:
EPA dynamometer driving schedules1
Worldwide Harmonised Light Vehicle Test Procedure (WLTP) laboratory tests
Accelarator
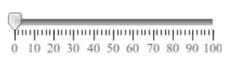
The Slider block tunes the value of the connected block parameter during simulation. For example, you can connect the Slider block to a Gain block in your model and adjust its value during simulation. You can modify the range of the Slider block's scale to fit your data. Use the Slider block with other Dashboard blocks to create an interactive dashboard to control your model.
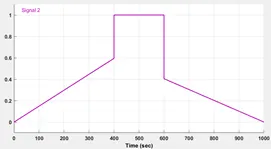
Custom Throttle

The Signal Builder block allows you to create interchangeable groups of piecewise linear signal sources and use them in a model. You can quickly switch the signal groups into and out of a model to facilitate testing. In the Signal Builder window, create signals and define the output waveforms.To open the window, double-click the block.
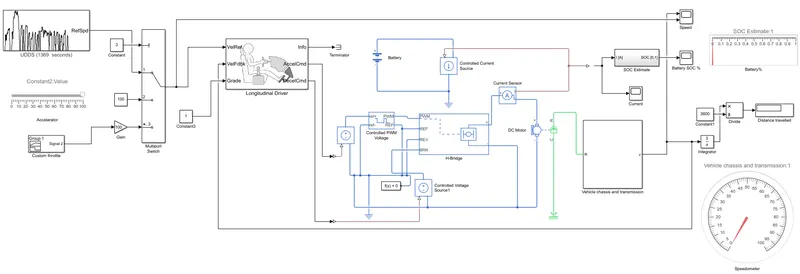
MATLAB SIMULINK MODEL FOR ELECTRIC VEHICLE
SIMULATION RESULTS:
- FOR UDDS
Vehicle speed
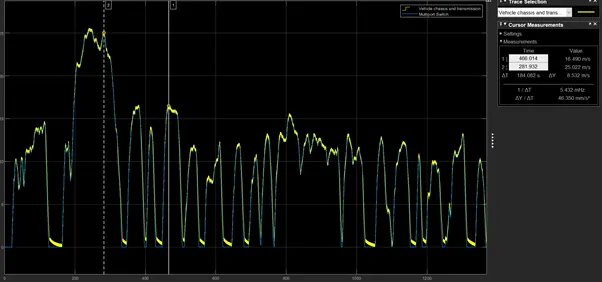
The actual vehicle speed is almost similar to the reference drive cycle speed with a small shift due to environmental and real world conditions with certain assumptions.
Battery SOC %
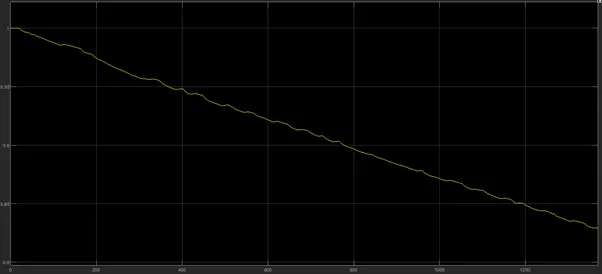
Small pikes can be observed that depict the charging and discharging of the battery due to regenerative braking during the vehicle run.
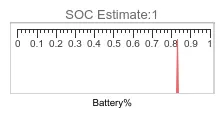
SOC at end of the drive = 82%
Run time= 1369s
Total distance travelled in single charge= 3.489 miles
2.FOR DRIVER ACCELERATOR
Vehicle speed
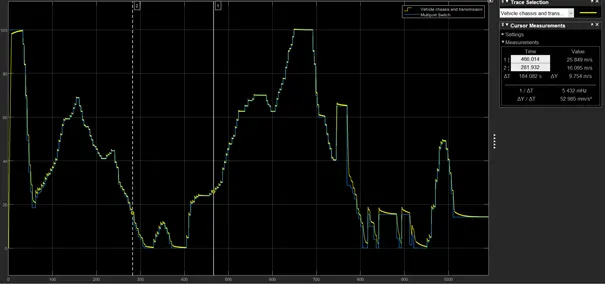
The actual vehicle speed is again almost similar to the reference drive cycle speed with a small shift due to environmental and real world conditions with certain assumptions.
Battery SOC %
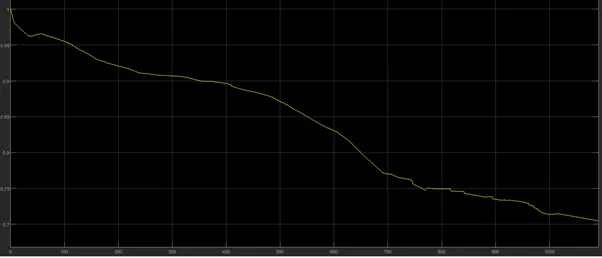
Small pikes can be observed that depict the charging and discharging of the battery due to regenerative braking during the vehicle run.
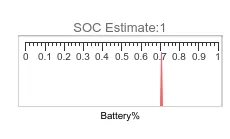
SOC at end of the drive = 70%
Run time= 1200s
Total distance travelled in single charge= 11.54 miles
3.FOR CUSTOM THROTTLE
Vehicle speed
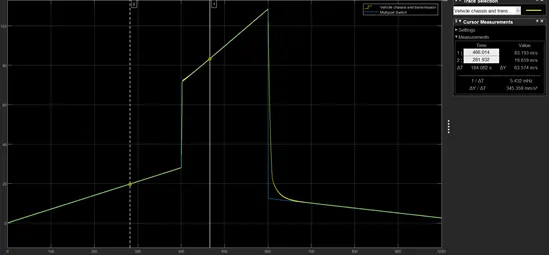
Battery SOC%
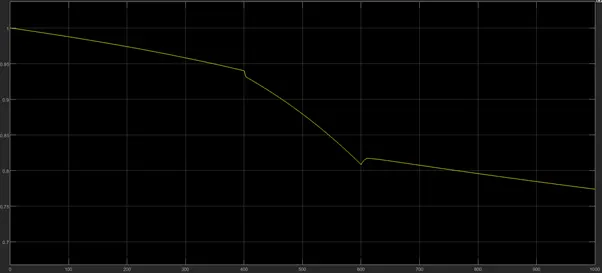
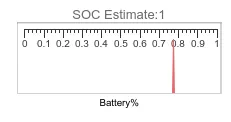
SOC at end of the drive = 78%
Run time= 1000s
Total distance travelled in single charge= 7.53miles
CONCLUSION
The MATLAB Simulink model for an electric vehicle with common configuration and specification was designed and the simulation was carried out for various driving inputs.
The simulation of a vehicle before it is realised into the practical is mandatory before finalising the design as it helps us to determine the performance of the electric vehicle under various environmental conditions.
This model helps in determining suitable rating of the motor, the battery capacity , controlled gain etc.
REFERENCES
https://www.researchgate.net/figure/Configurations-of-the-electric-drive-system_fig1_328227655
https://www.scilab.org/electric-motor-optimization
https://blogs.3ds.com/northamerica/why-simulation-is-crucial-in-electric-vehicle-development/
LINKS:
Simulink file-
https://drive.google.com/file/d/1Tqef9DOsPd_jf_Um-4NjguZlNH_Q7kzV/view?usp=sharing
DOC file-
https://drive.google.com/file/d/1bFBXZZnU_YK6BAemk2u5yYRJy6cQIORe/view?usp=sharing