Final Project
AIM :-
- To select roll bars for a light vehicle sports vehicle based on the given data.
- To prepare and understeer budget of the vehicle.
- To plot the tire stiffness vs load.
1. SELECTION OF ANTI ROLL BARS :-
Given data,
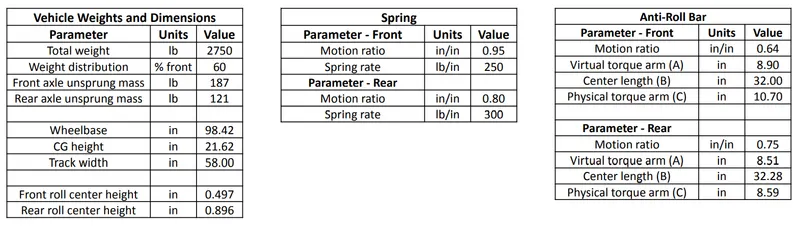
The calculations are done in a spreadsheet as it is required to vary the parameters to reach the targets. The steps for calculation are mentioned below.
- The distance between the front and rear axles to the CG is calculated.
- The roll moment arm length is calculated.
- The front and rear sprung mass are calculated based on the weight distribution.
- The roll moment (lateral and gravity) are calculated.
- The load transfer and total roll stiffness due to elastic component are calculated.
- The lateral load transfer are calculated.
- The load transfer due to axle roll are calculated.
- The tire contribution and total stiffness at wheel center level are calculated.
- The wheel rate and wheel rate contribution are calculated.
- The roll bar contribution are calculated.
- The roll bar stiffness and the roll bar diameter are calculated.
- The roll bar diameter is then converted to mm and adjustments are made in 0.25 mm increment or decrement to reach the auxiliary stiffness targets.
- The roll bar rate for wheel jounce are calculated.
- The roll bar stiffness for roll are calculate.
- The auxiliary stiffness are calculated.
- The roll gradient is varied between 3.5-3.8 deg/g to achieve an auxiliary roll stiffness target of 25-60% front and 0-20% rear.
The results obtained from the calculations are,
Front anti roll bar diameter = 9.54 mm.
Rear anti roll bar diameter = 6.52 mm.
Front auxiliary roll stiffness = 29.92%.
Rear auxiliary roll stiffness = 13.75%.
2. UNDERSTEER BUDGET :-
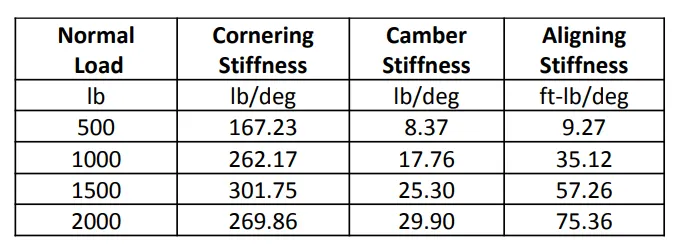
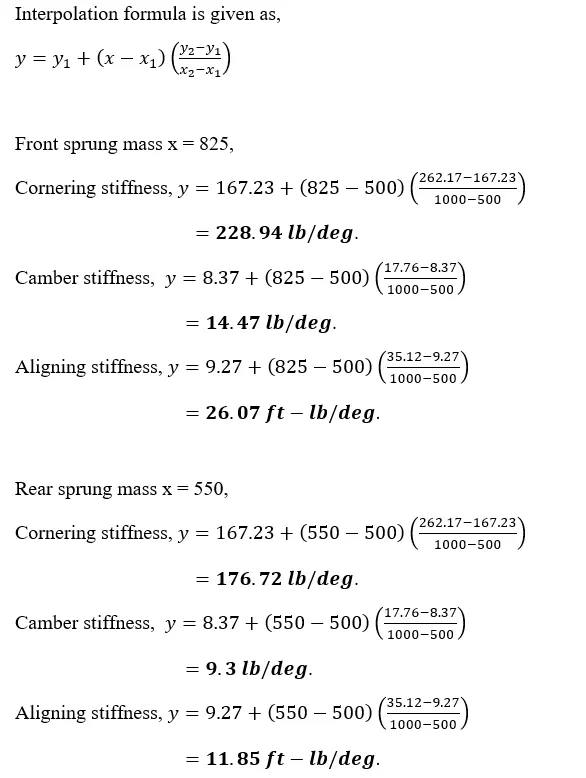
The corner sprung mass is calculated and in order to obtain the cornering stiffness, camber stiffness and aligning stiffness is calculated using interpolation and the below data is used.
In the understeer budget chart, the cornering compliance for front and rear are calculated and from the compliance the understeer is obtained. The parameters taken into consideration for the budget are,
- Weight distribution.
- Rigid body aligning torque.
- Roll steer.
- Roll camber.
- Lateral force compliance steer.
- Lateral force compliance camber.
- Aligning torque compliance steer.
The understeer budget is prepared in a spreadsheet by calculating the above 7 parameters. The contribution chart of the parameters on how they affect the understeer is given below.
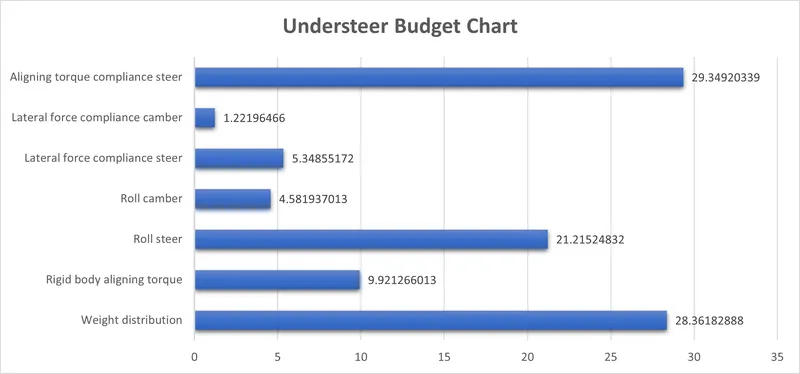
The value of understeer obtained is 1.73 deg/g.
The spreadsheet for the roll bar selection calculation and the understeer budget is provided below.
https://docs.google.com/spreadsheets/d/12ACCbpHlur3U7Idmqp_1w2HQpsfyEZ9aa43MTSug5AA/edit?usp=sharing
3. TIRE STIFFNESS VS LOAD PLOTS :-
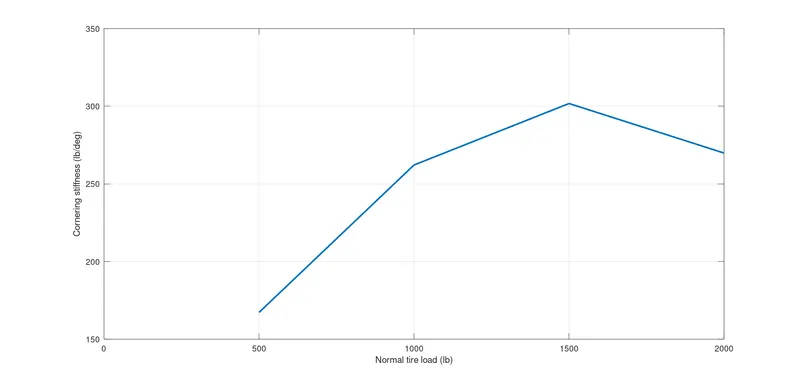
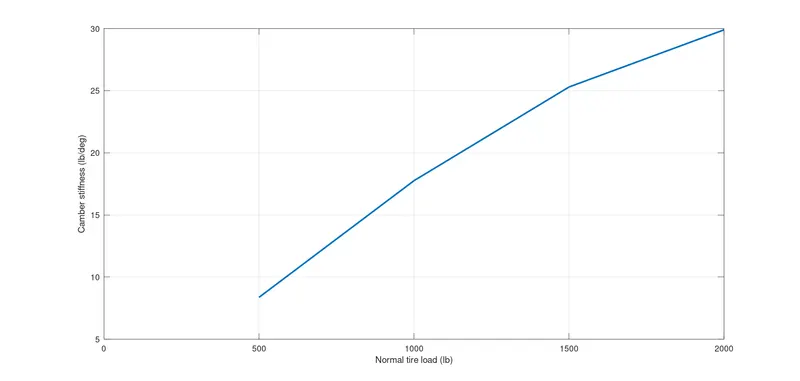
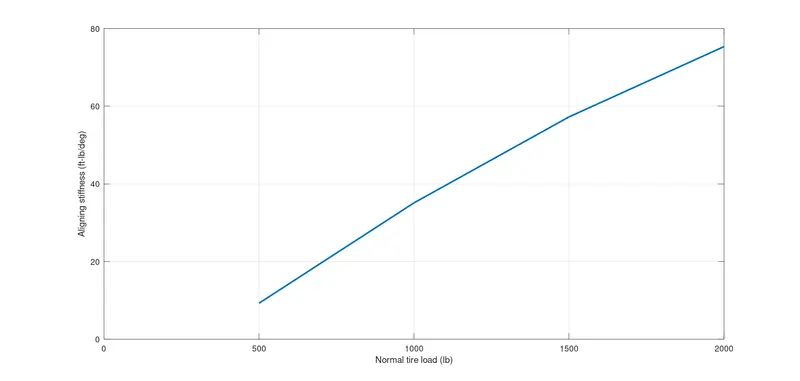
The cornering stiffness, camber stiffness and aligning stiffness of a tire vs the normal load acting on the tire is plotted using MATLAB. The data is taken from the above table where the stiffness for the tire loads are calculated. The script to plot the graph is given below.
% Tire stiffness plots
clear all
close all
clc

% Normal tire load in lb.
l = [500 , 1000 , 1500 , 2000];

% Cornering stiffness in lb/deg.
Cs = [167.23 , 262.17 , 301.75 , 269.86];

% Camber stiffness in lb/deg.
Cbs = [8.37 , 17.76 , 25.3 , 29.9];

% Aligning stiffness in ft-lb/deg.
As = [9.27 , 35.12 , 57.26 , 75.36];

% Plotting the graphs.
figure(1) % Load vs cornering stiffness.
plot(l,Cs,'linewidth',2);
grid on;
xlabel('Normal tire load (lb)');
ylabel('Cornering stiffness (lb/deg)');

figure(2) % Load vs camber stiffness.
plot(l,Cbs,'linewidth',2);
grid on;
xlabel('Normal tire load (lb)');
ylabel('Camber stiffness (lb/deg)');

figure(3) % Load vs aligning stiffness.
plot(l,As,'linewidth',2);
grid on;
xlabel('Normal tire load (lb)');
ylabel('Aligning stiffness (ft-lb/deg)');
The output of the MATLAB code is given below.
Cornering stiffness plot,
Camber stiffness plot,
Aligning stiffness plot,
CONCLUSION :-
- The roll bar diameter is calculated according to the constraints and targets.
- The understeer budget is prepared and the understeer gradient is obtained and the contribution chart is plotted.
- The tire stiffnesses vs the load on the tire are plotted using MATLAB.