Channel flow simulation using CONVERGE CFD
Aim:
The main objective of this project was to simulate and study the velocity, pressure, mass flow rate, and total cell count for all 3 base mesh sizes of the Rectangular Channel using CONVERGE Studio and observe the difference between the contours and line plots generated by running the 3 case study.
Introduction
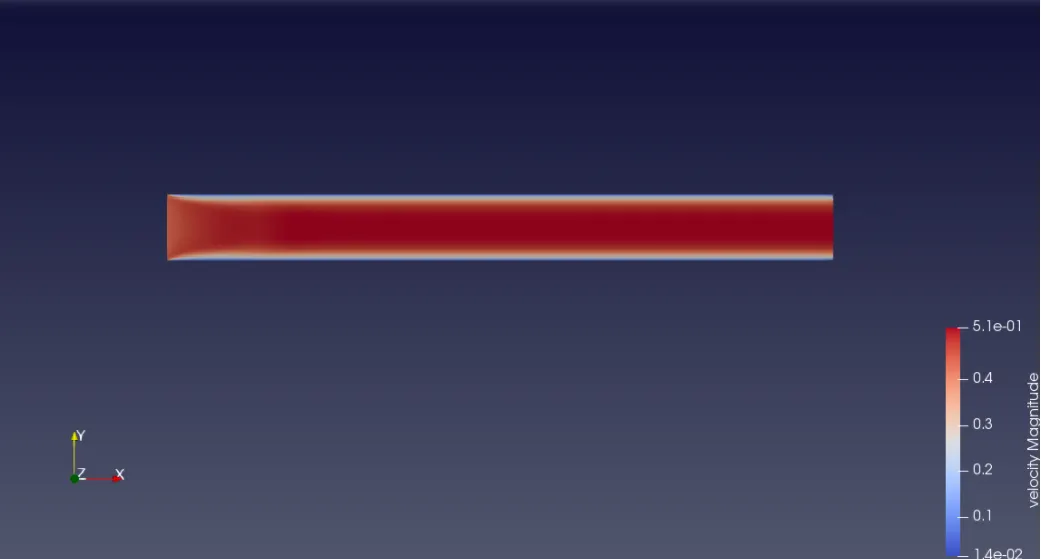
Consider the 2D Channel flow case. The flow normal to a surface has a velocity zero. That is, a fluid that is in direct contact with the surface sticks to the surface and there is no slip. This is known as no slip condition. The fluid property responsible for no slip condition and the development of boundary layer is viscosity. The layer that sticks to the surface slows the adjacent fluid layer because of viscous forces between the fluid layers, which slows the next layer and so on. A consequence of no slip condition is that, all the velocity profiles must have zero values with respect to the surface at the points of contact between a fluid and a solid surface. Therefore, no slip condition is responsible for the development of the parabolic velocity profile. The flow region adjacent to the wall, in which the viscous forces are significant is called boundary layer. Thus, the velocity of the fluid increases from the boundary layer to the central axis in the form of a parabolic profile.
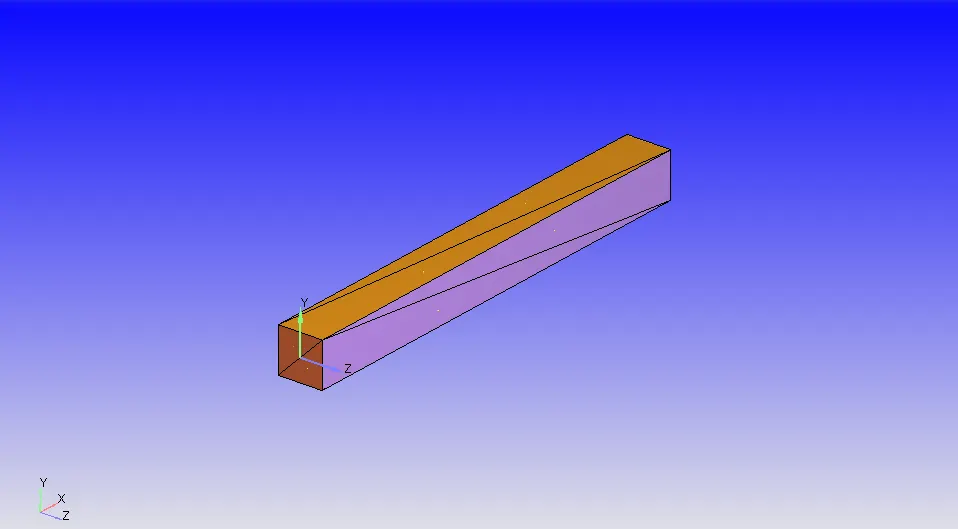
First of all, the box geometry was setup using converge CFD software.
Dx Dy Dz
CENTER 0.05 0.00 0.00
SIZE 0.1 0.01 0.01
*all dimension are in metre.
Each face of the box was split into triangles.
2.Boundary Creation
After creating the box Geometry, The Boundary tag was created along with different boundary id and colouring. A total of 5 different boundaries tag was created for 6 different faces of the box with each face split into two triangles. To create the boundaries naming, the "Boundary" command in the "Geometry" dock was used, and then the faces were appointed to appropriate tags along with id.
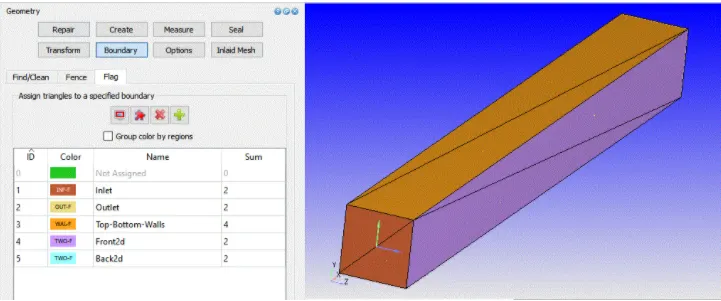
The five different boundaries were Inlet, Outlet, Top-Bottom-Walls, Front2d, and Back2d.
3.Case-Study Setup
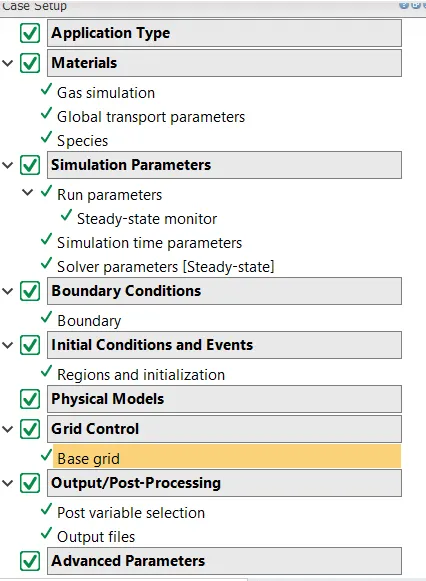
The various parameter was considered while setup this case study. The case study setup dock was used to set up the problem which appears on the right-hand side of the converge studio.
3.1 Application Type:
In order to run a steady-state simulation, firstly, under the Application type in the setup tree, a "Time-based" simulation must be selected.
3.2 Materials:
Under the material tab "Gas simulation" was selected and "Air" as a predefined mixture.
Gas: Air
Global Transport Parameters: Fixed value
by default, the following value is considered.
Prandtl Number : 0.9
Schmidt Number : 0.78
Species: Oxygen-O2 & Nitrogen-N2
3.3 Simulation Parameters
The Steady-state solver was selected for running this case study along with a "Pressure based" solver.
STEADY STATE SIMULATION:
These are the simulation we run if are just interested in the end result and not in how those results are getting formed with time. The time is in CYCLES for STEADY STATE SIMULATION.
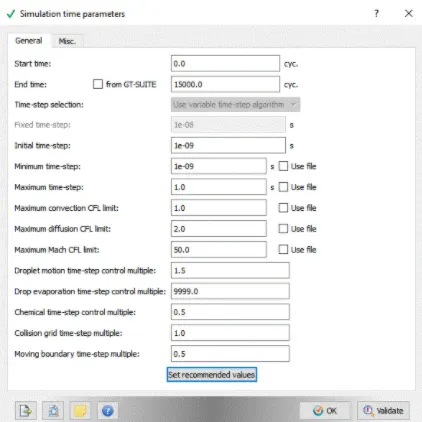
The Following Simulation parameters were selected for running each simulation.
3.4: Boundary Conditions
In this tab, The volumetric region and physics for each boundary were defined.
|
Boundary_Name |
Boundary_Type |
Paramter_Defined |
Boundary ID |
|
1.Inlet |
Inflow |
100001 Pa |
1 |
|
2.Outlet |
OutFlow |
100000 Pa |
2 |
|
3.Top-Bottom-walls |
Wall |
Specified Value(300k) No-Slip Condition |
3 |
|
4.Front2d |
Two_D |
4 |
|
|
5.Back2d |
Two_D |
5 |
3.5: Initial Conditions and Events
Volumetric Region was created in order to assign this to all the boundary tag.
Species:- O2 (0.77) & N2 (0.23)
Pressure :100001Pa
Temperature:300K
3.6: Grid Control
The case study was run using 4 different mesh grid size. So different case study was set up in order to study the effect of value when the mesh is more refined.
4 different base mesh sizes are,
dx = 2.0e-4m, dy = 2.0e-4m, dz = 2.0e-4m
dx = 1.5e-4m, dy = 1.5e-4m, dz = 1.5e-4m
dx = 1.0e-4m, dy = 1.0e-4m, dz = 1.0e-4m
3.7 Output/Post-Processing
Post-Variable Selection- Existing value
Output Files- Time interval for writing 3D output files-100.0
The time interval for writing restart files -1000.0
The case study was solved using CYGWIN and the post-processing was done in ParaView.
SIMULATION RESULTS
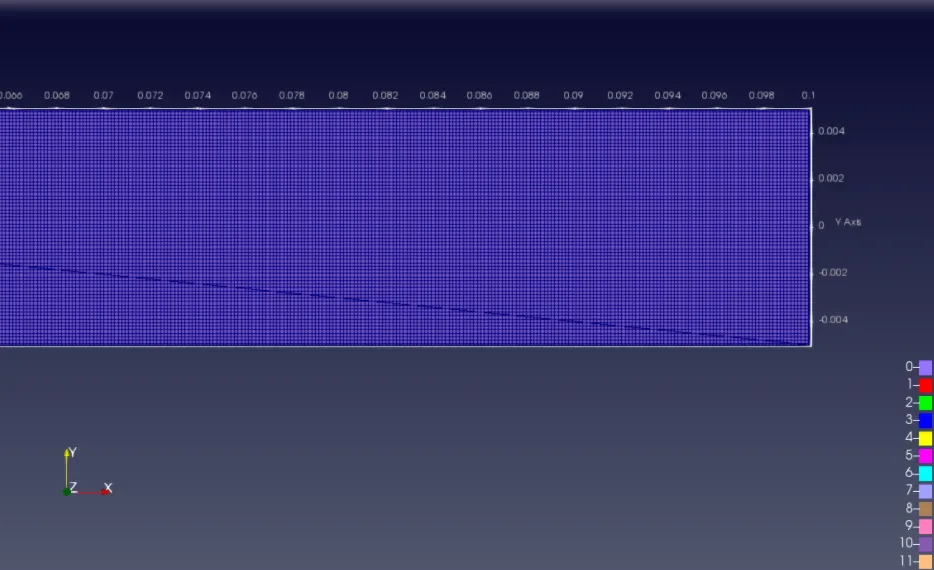
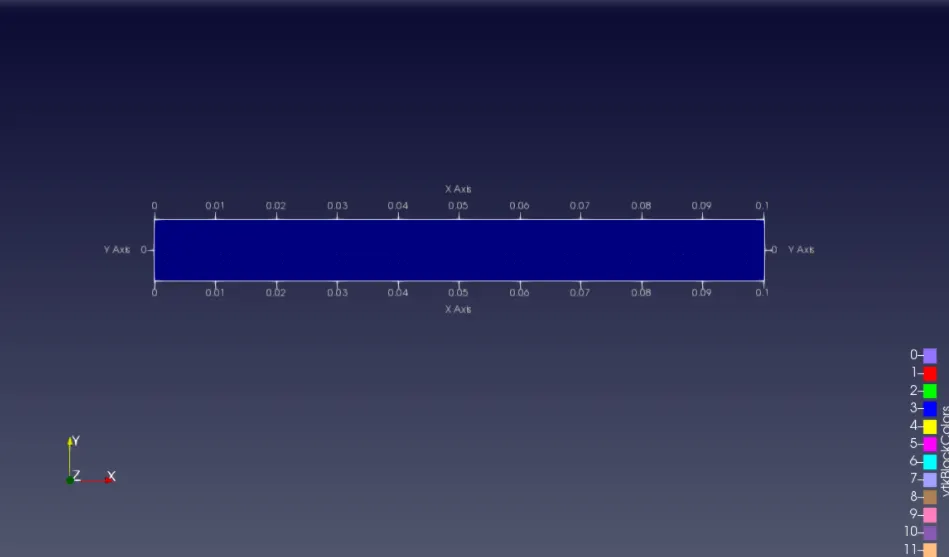
Mesh Size
Case 1:
dx = 2.0e-4m, dy = 2.0e-4m, dz = 2.0e-4m.
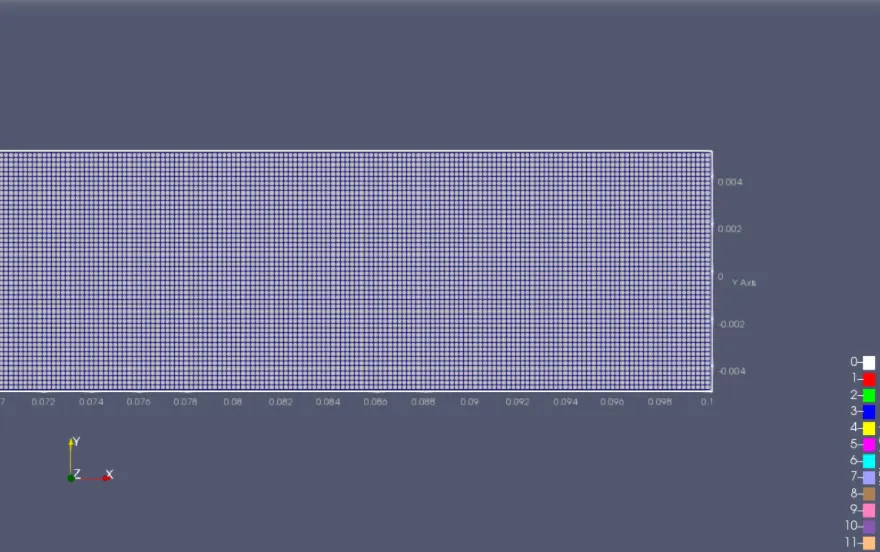
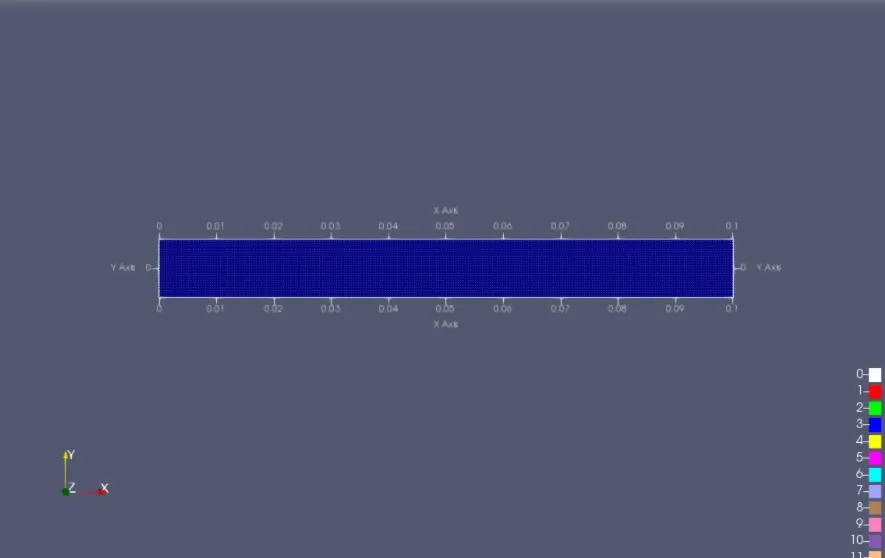
Case 2:
dx = 1.5e-4m, dy = 1.5e-4m, dz = 1.5e-4m.
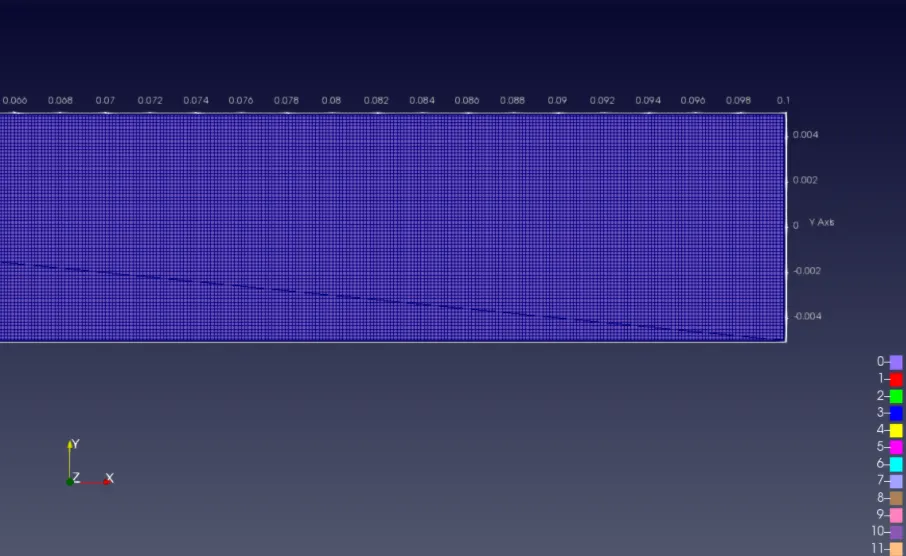
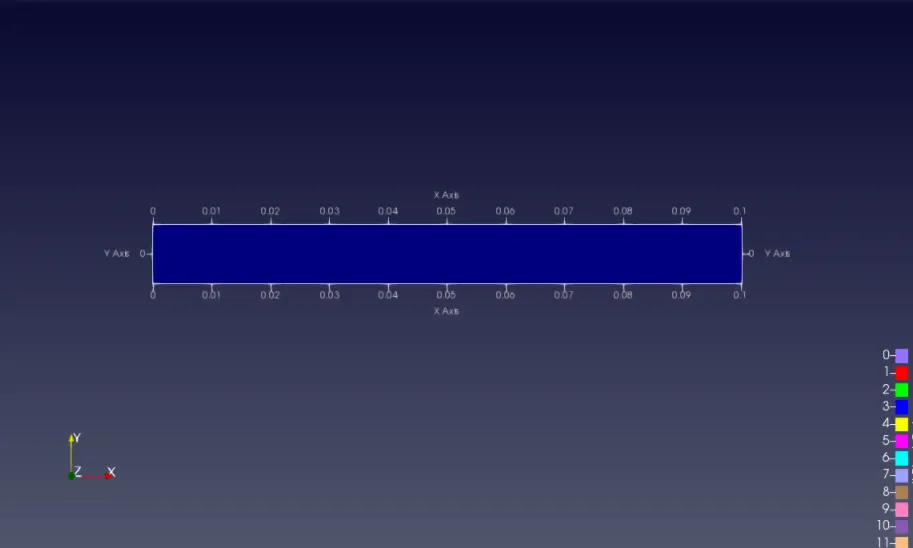
Case 3:
dx = 1e-4m, dy = 1e-4m, dz = 1e-4m.
Line Plots & Contours
Case 1:
dx = 2.0e-4m, dy = 2.0e-4m, dz=2.0e-4m
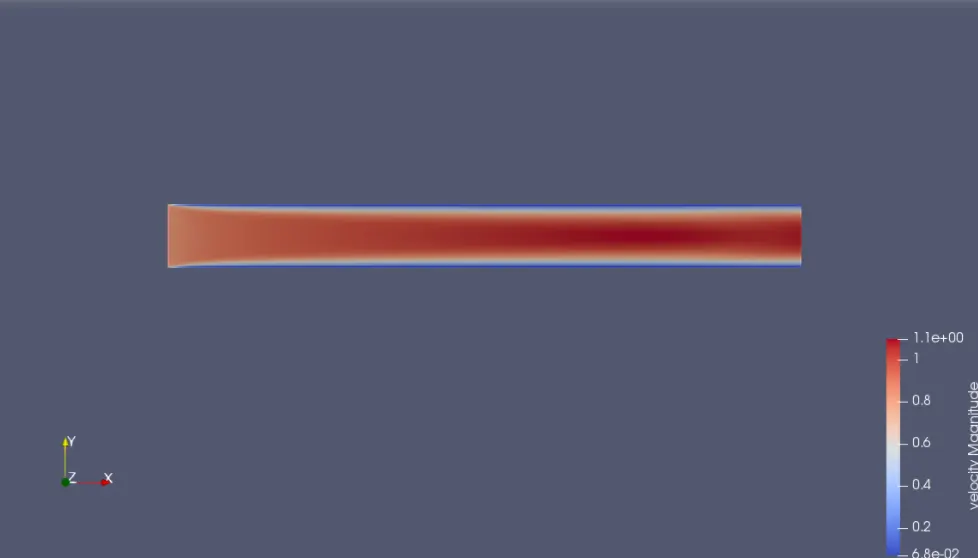
plot 1.1 :(Velocity Contour)
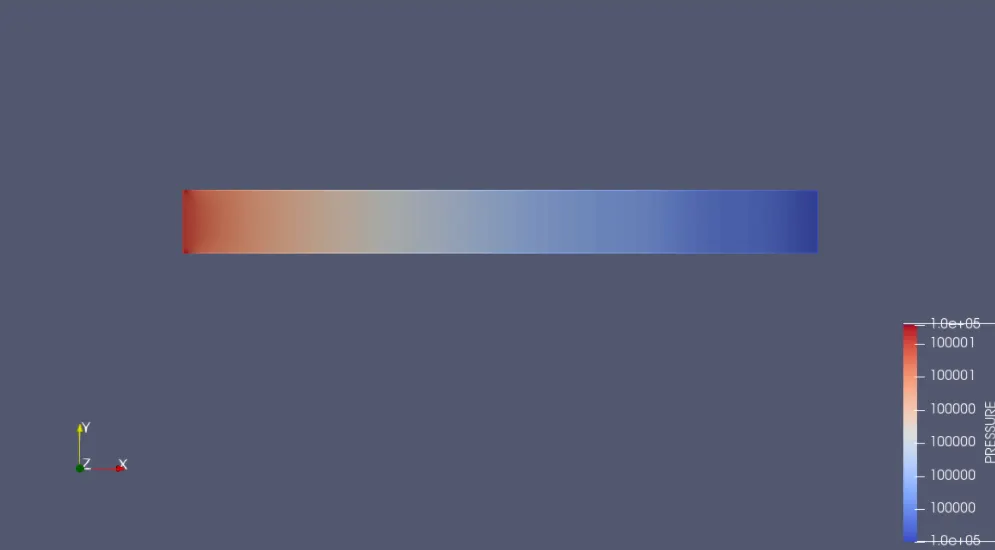
plot 1.2 :(Pressure Contour)
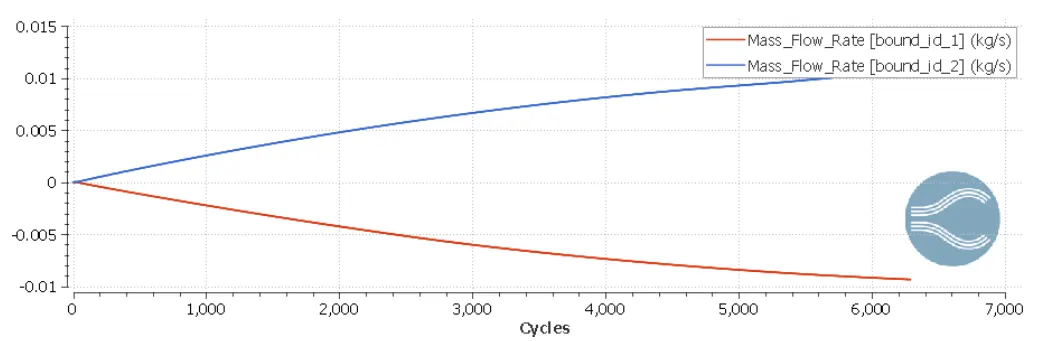
plot 1.3 :(Mass Flow Rate At Inlet And Outlet)
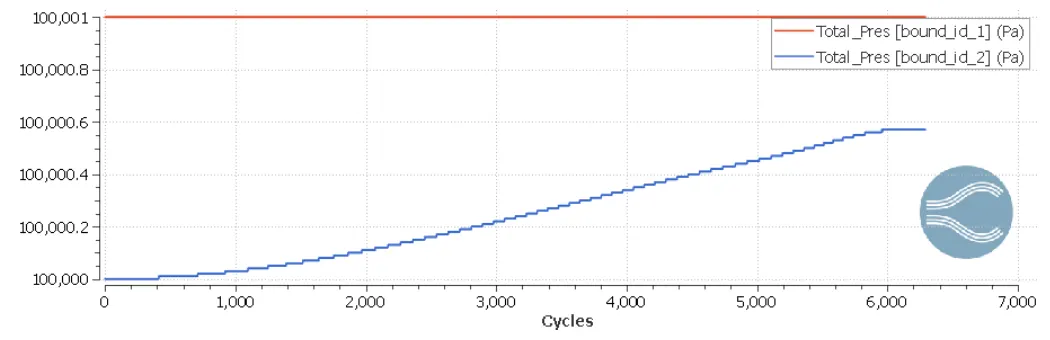
plot 1.4 :(Total Pressure At Inlet And Outlet)
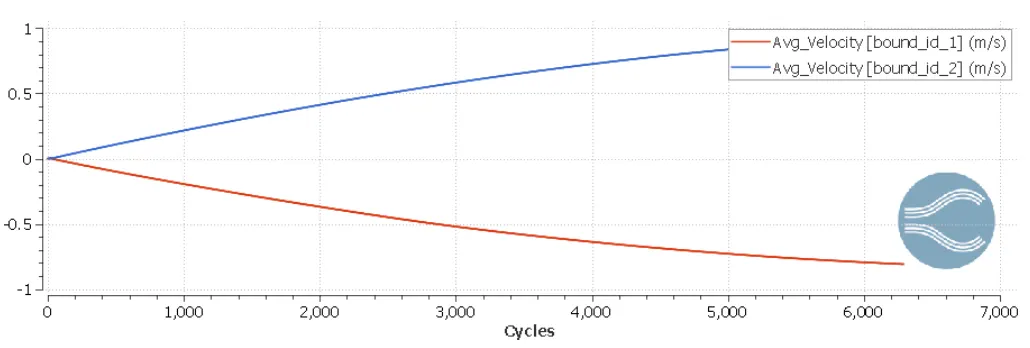
plot 1.5 :(Average Velocity At Inlet And Outlet)
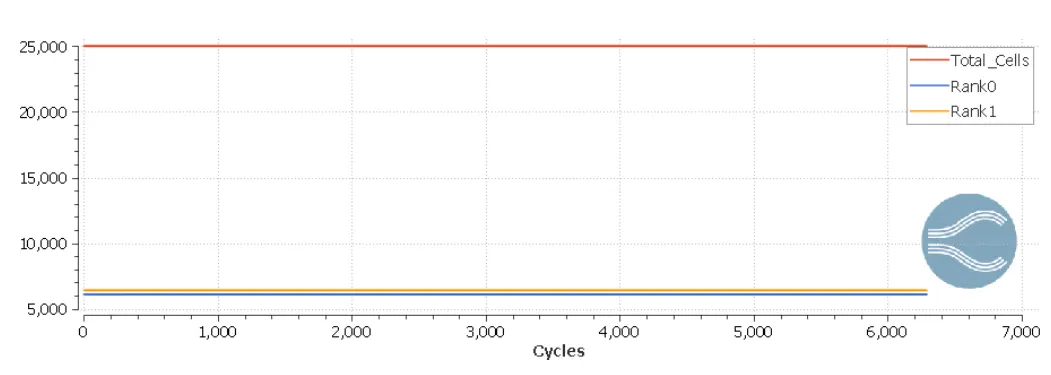
plot 1.6 :(Total Cells)
The Youtube link for the animation of velocity and pressure contours for the grid size of (2.0e-4) are given below
https://www.youtube.com/watch?v=SzYkXd1jRas
https://www.youtube.com/watch?v=obzqh0six6A
Case 2:
dx = 1.5e-4m, dy = 1.5e-4m, dz = 1.5e-4m.
plot 2.1 :(Velocity Contour)
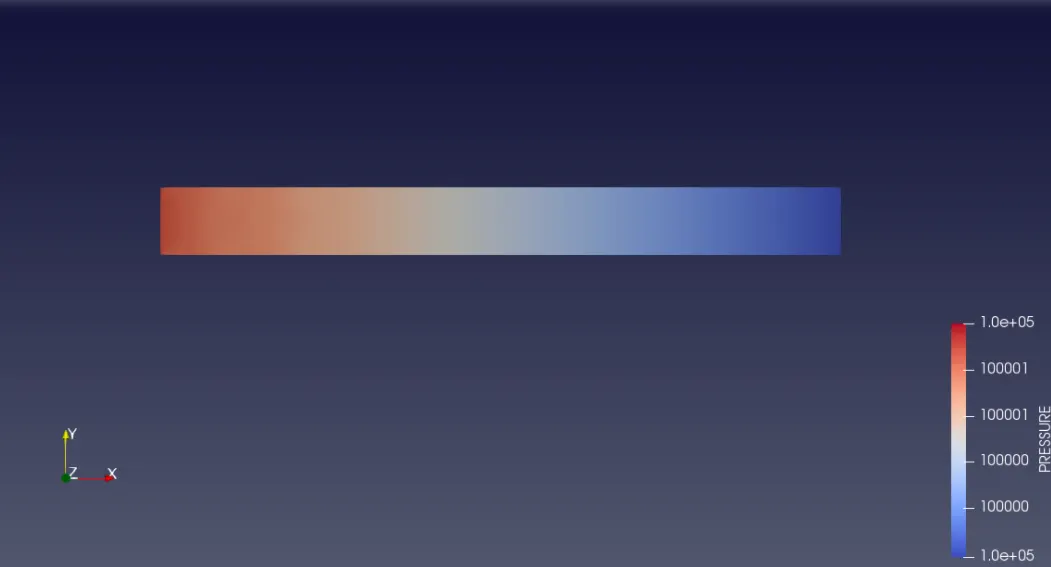
plot 2.2 :(Pressure Contour)
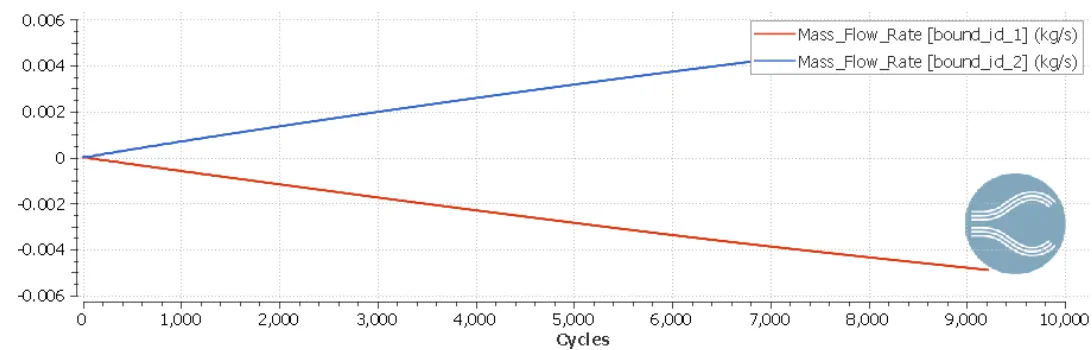
plot 2.3 :(Mass Flow Rate At Inlet And Outlet)
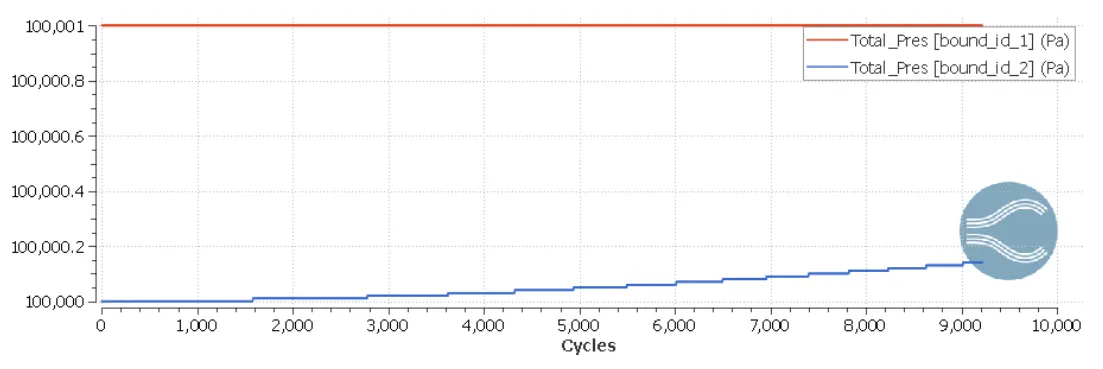
plot 2.4 :(Total Pressure At Inlet And Outlet)
plot 2.5 :( Average Velocity At Inlet And Outlet)
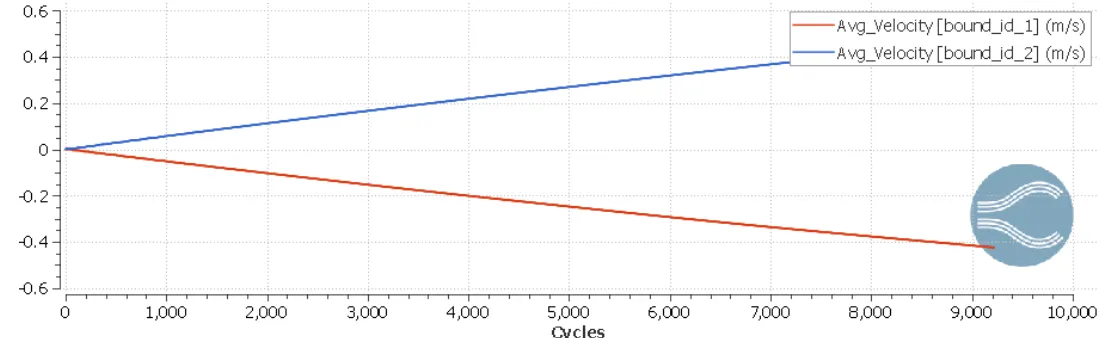
plot 2.6 :(Total Cells)
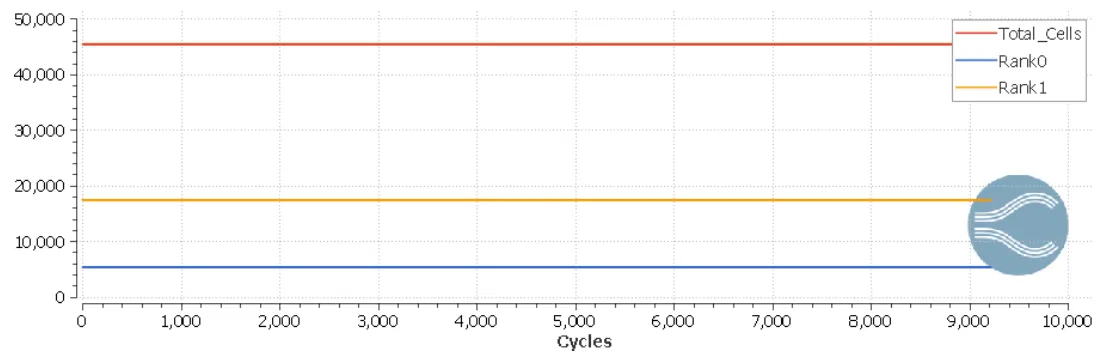
The Youtube link for the animation of velocity and pressure contours for the grid size of (1.5e-4) are given below
https://www.youtube.com/watch?v=9a08KV1g08A
https://www.youtube.com/watch?v=QN4qurBeaLo
Case 3:
dx = 1.0e-4m, dy = 1.0e-4m, dz = 1.0e-4m.
plot 3.1 :(Velocity Contour)
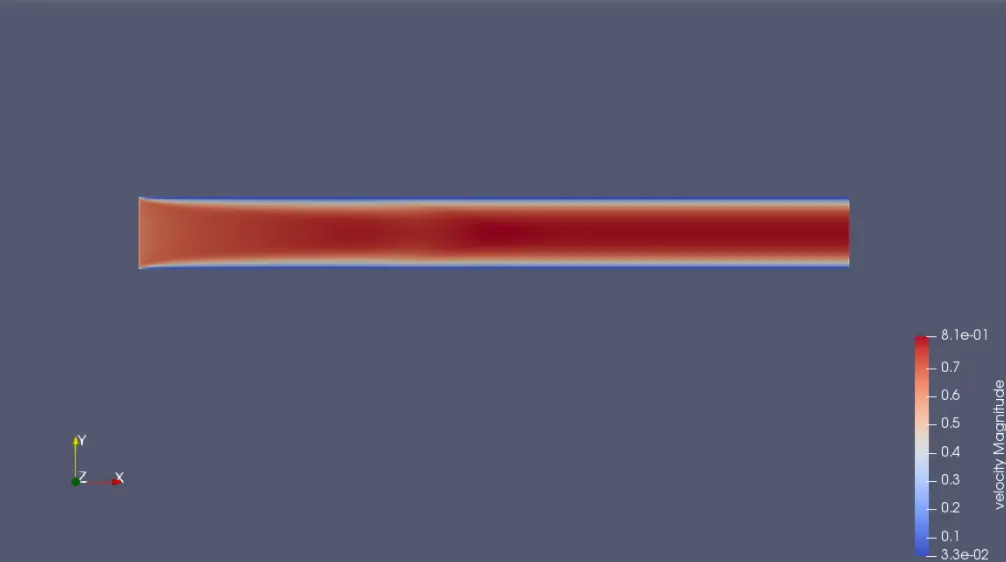
plot 3.2 :(Pressure Contour)
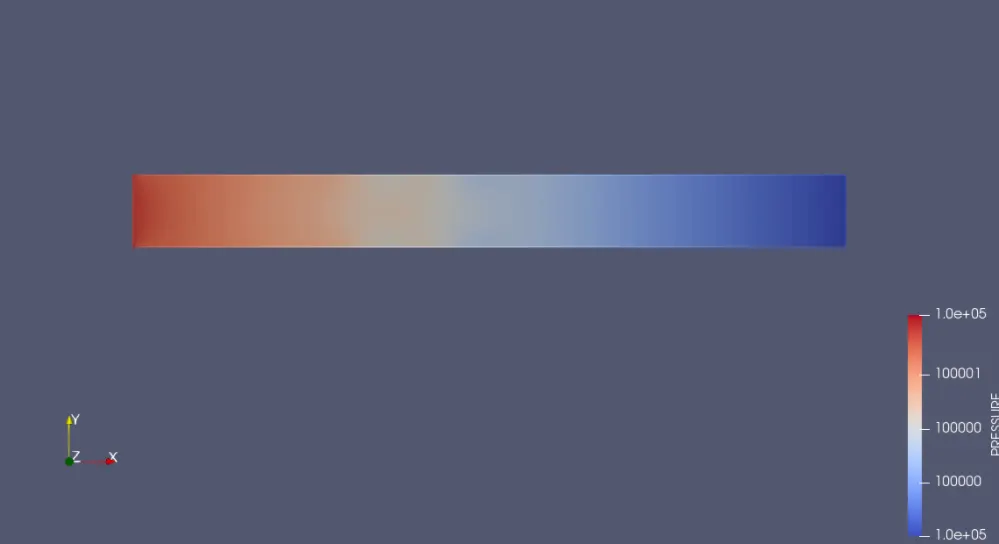
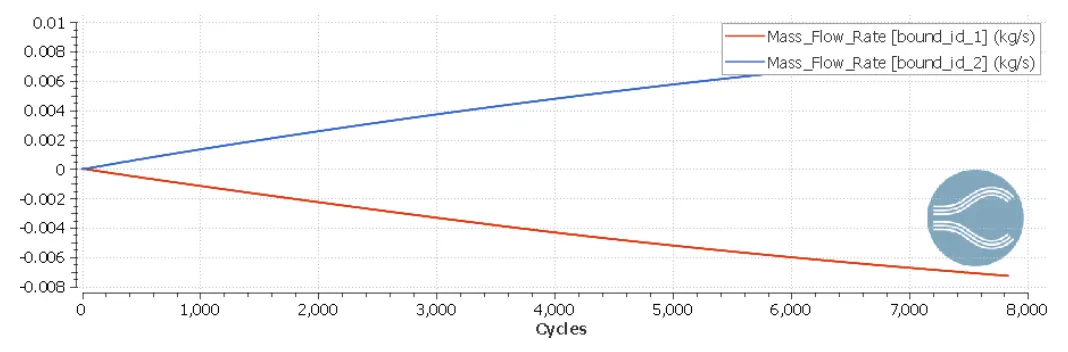
plot 3.3 :(Mass Flow Rate At Inlet And Outlet)
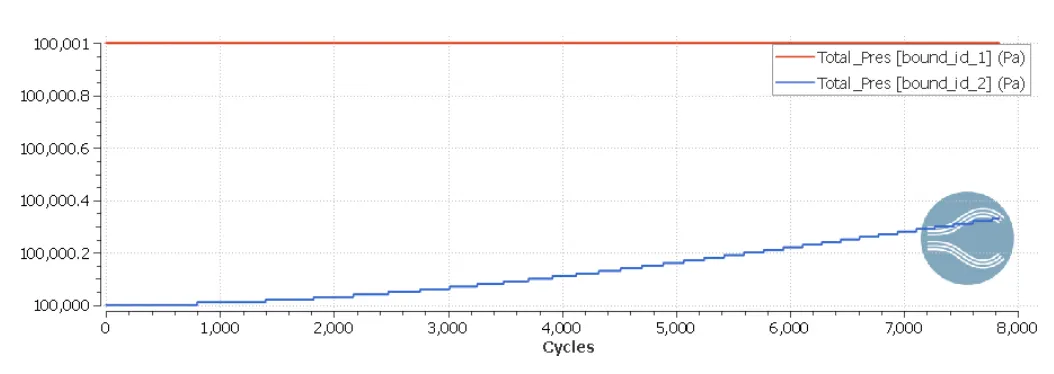
plot 3.4 :(Total Pressure At Inlet And Outlet)
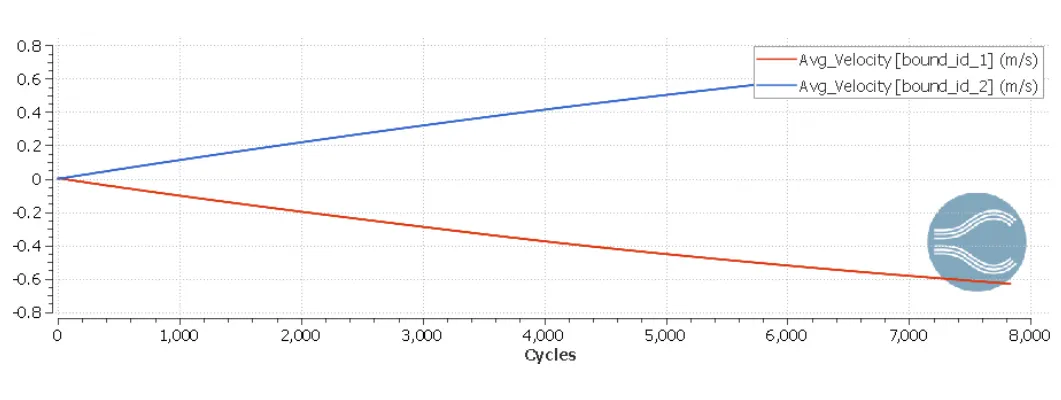
plot 3.5 :( Average Velocity At Inlet And Outlet)
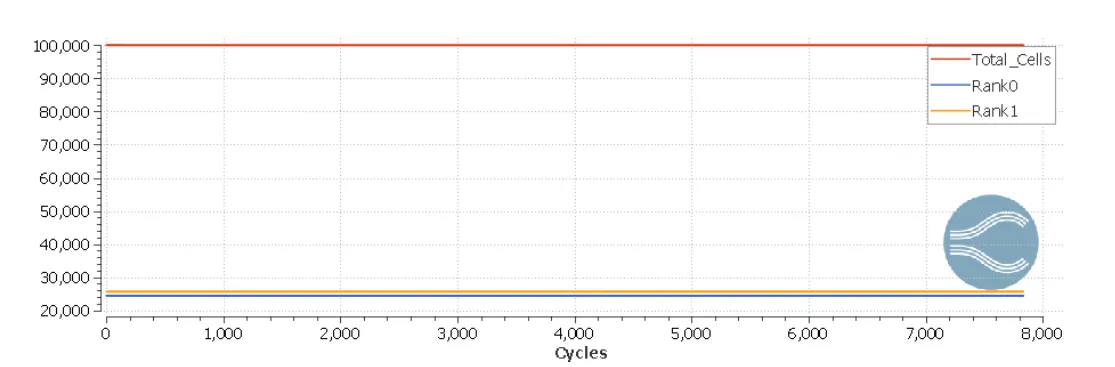
plot 3.6 :(Total Cells)
The Youtube link for the animation of velocity and pressure contours for the grid size of (1e-4) are given below
https://www.youtube.com/watch?v=w6Ewokn9kmc
https://www.youtube.com/watch?v=fKE_1UCIPPQ
Conclusion:
- The mass flow rate plot shows us that the inlet mass flow rate will be negative and the outlet flow rate is positive and hence the mass flow rate is conserved overall.
- Velocity plot shows us that inlet velocity is negative and the outlet is positive.
- The pressure plot shows that total pressure at outlet increases because air along with velocity goes to the outlet and static pressure increases at inlet due to initial condition.
- As the base grid size decreases, the number of grid points in the mesh increases and it
gives more fine mesh. - The decrease in the mesh size gives the results with increased accuracy.
- Simulation time also increase as the number of cycles increase.