Flow over a backward facing step
The case setup :
The model was designed and imported to the converge studio and the bondary flagging was done. the simulation done was a time-based, steady-state simulation. Normal vectors were alligned in such a way that the flow was made to visualize inside the backward facing step body. An inlet pressure of 110.325kP and an outlet pressure of 100.325kPa was applied. The simulation was made for diffrent mesh sizes. The simulation began at 0 cyc and was made to end at 15000 cyc. Converging pressure and velocity contours were observed for each simulation run.
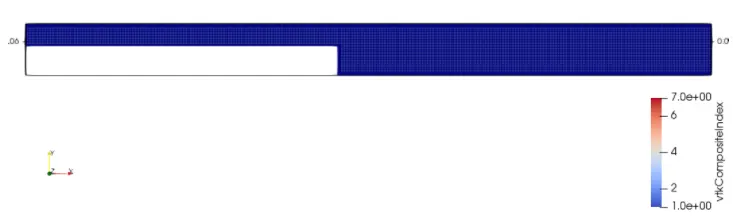
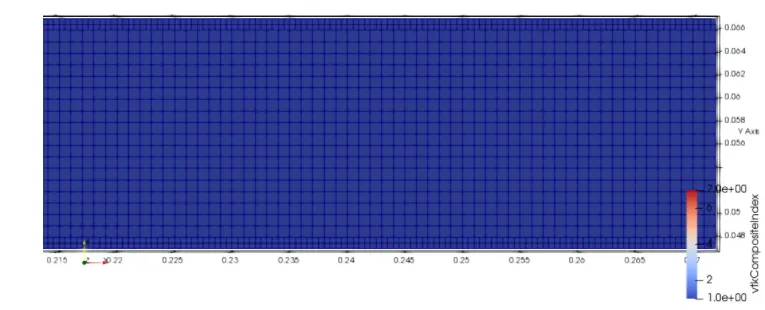
Surface with edges :
Case Study 2:dx=dy=dz=2e-3 m
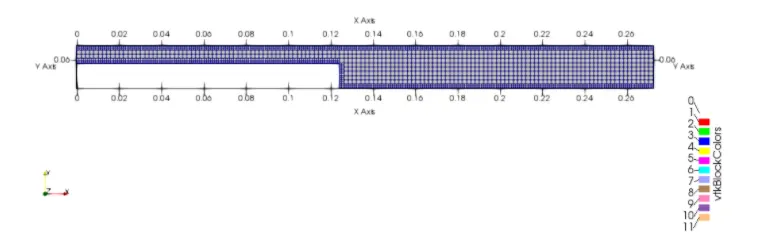
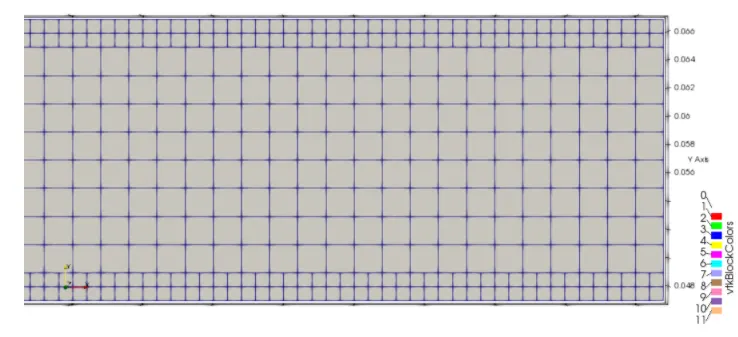
Case Study 2:dx=dy=dz=1.5e-3 m
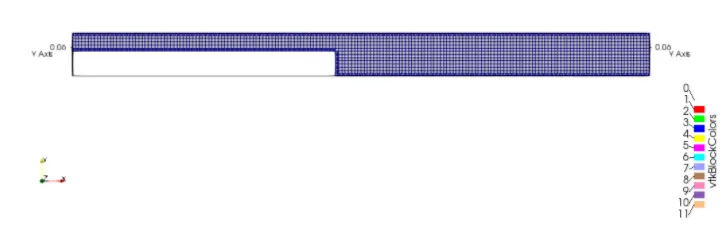
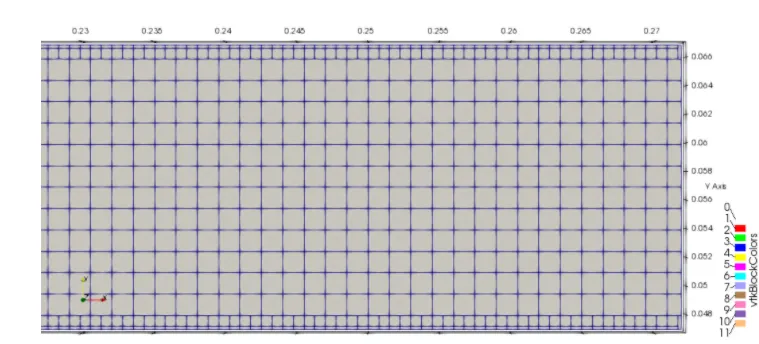
Case Study 3:dx=dy=dz=1.0e-3 m
Line Plots & Contours
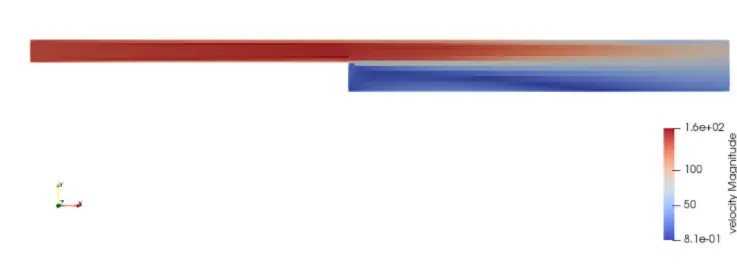
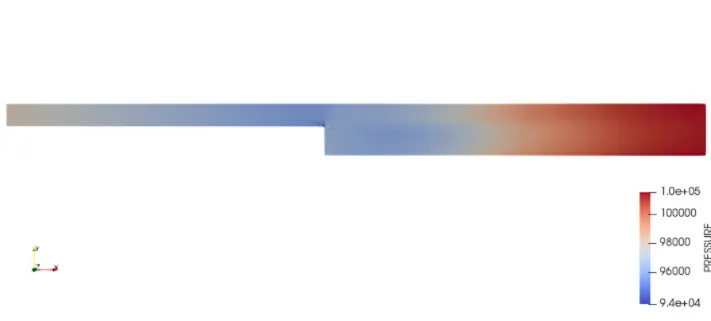
Case Study 1: dx=dy=dz=2e-3 m
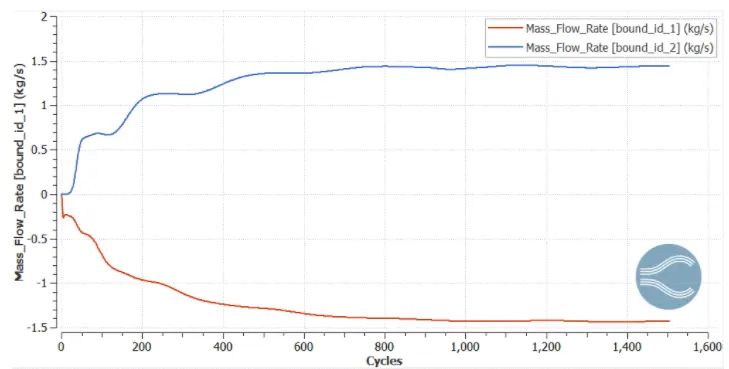
As mass flow rate involves the components like density, pressure, area of the geometry and the velocity of the flow taking place through it. Mass flow rate is the amount of fluid in 'kg' passing through a given area in unit interval of time(s). Initially when the flow starts the mass-flow rate decreases and reaches a steady state value when the solution reaches convergence. As mass flow rate involves the components like density, pressure, area of the geometry and the velocity of the flow taking place through it.
Mass flow rate is the amount of fluid in 'kg' passing through a given area in unit interval of time(s). Initially when the flow starts the mass-flow rate decreasesin the sense at the exit the mass-flow rate is increasing and as the solution reaches the steady state value the mass-flow rate at the exit also comesto a constant value at the exit boundary.
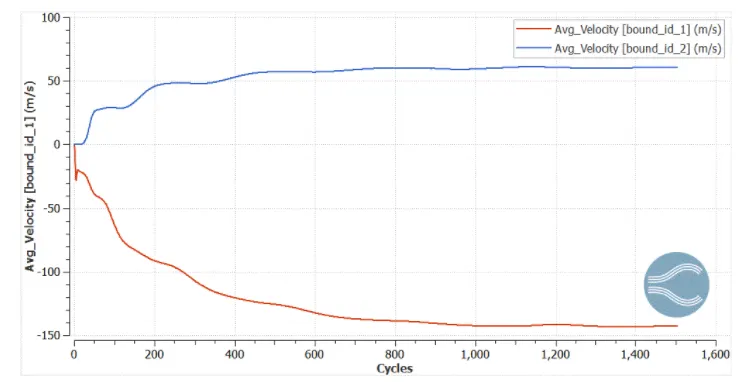
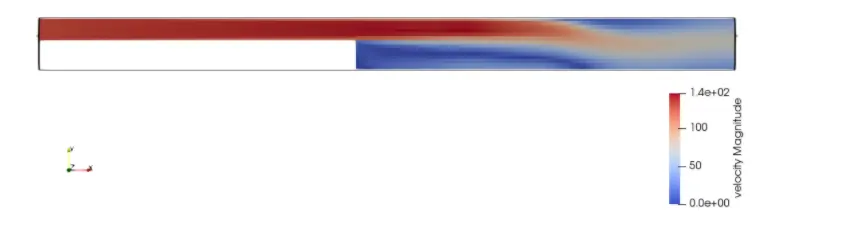
Once the flow crosses the first half of the geometry with increase in area the flow starts to expand and there by the flow starts accelerating which increases the velocity of the flow and when the solution reaches the steady state, the velocity becomes almost a constant value.
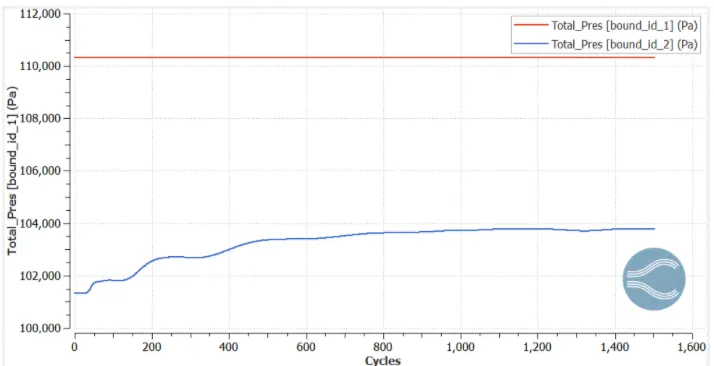
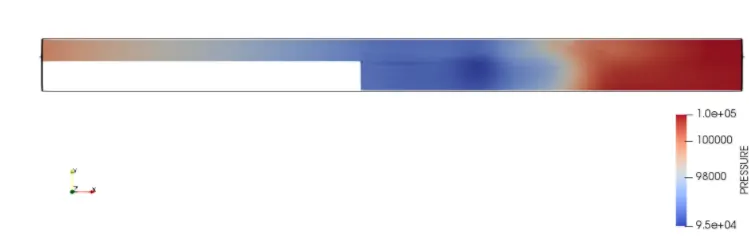
A plot of pressure v/s cycles is shown. Initially at the inlet the pressure is high and as the flow starts from the inlet the pressure increases as the first half is a constant area channel. Once the flow reaches the second half the geometry with increase in area, pressure increases to some extent, because the flow starts expanding due to increasing in area the pressure drops gradually till the flow completely expands and reaches a steady state value once there is no pressure energy left in the flow.
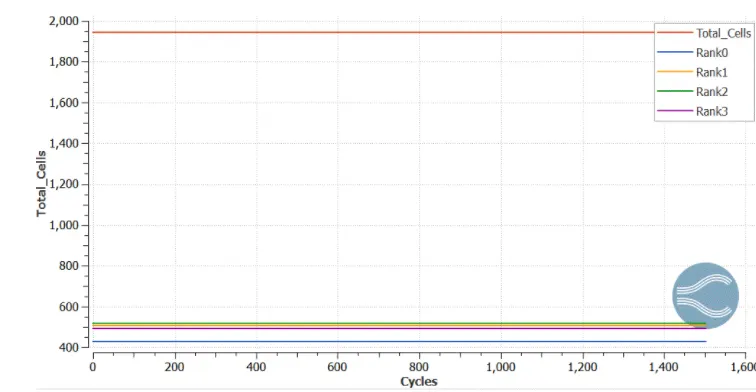
The total cell count is a constant value throughout the simulation and it only depends on the base mesh size of what we give. The main intention of the cell count is that. by increasing the number of elements or the cells the solution can be improved to a converged value and the result obatined will be a accurate one. And also by increasing the total cell count the behaviour of the flow through each element or cell can be observed and results can be inferred.
The links of the youtube videos are
https://www.youtube.com/watch?v=Rdvcs0iFURg
https://www.youtube.com/watch?v=4nyGHnHaEqk
Case Study 2:dx=dy=dz=1.5e-3 m
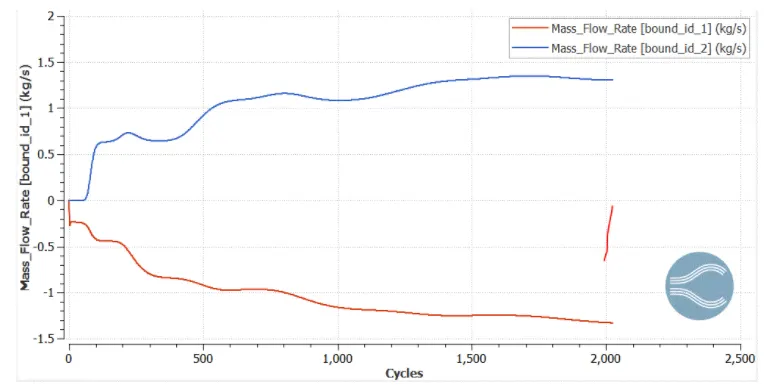
As mass flow rate involves the components like density, pressure, area of the geometry and the velocity of the flow taking place through it. Mass flow rate is the amount of fluid in 'kg' passing through a given area in unit interval of time(s). Initially when the flow starts the mass-flow rate decreases and reaches a steady state value when the solution reaches convergence. As mass flow rate involves the components like density, pressure, area of the geometry and the velocity of the flow taking place through it.
Mass flow rate is the amount of fluid in 'kg' passing through a given area in unit interval of time(s). Initially when the flow starts the mass-flow rate decreases in the sense at the exit the mass-flow rate is increasing and as the solution reaches the steady state value the mass-flow rate at the exit also comes to a constant value at the exit boundary.
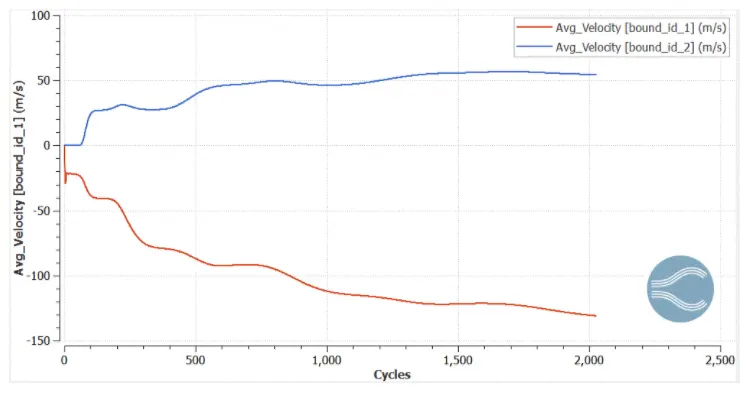
Once the flow crosses the first half of the geometry with increase in area the flow starts to expand and there by the flow starts accelerating which increases the velocity of the flow and when the solution reaches the steady state, the velocity becomes almost a constant value.
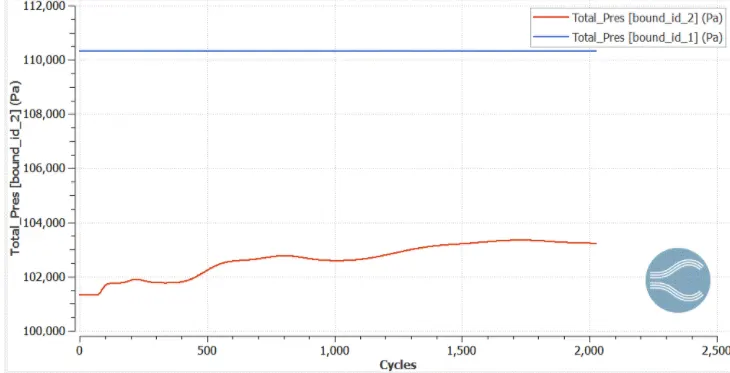
Much finer bheaviour and results of pressure are observed here. A plot of pressure v/s cycles is shown. Initially at the inlet the pressure is high and as the flow starts from the inlet the pressure increases as the first half is a constant area channel. Once the flow reaches the second half the geometry with increase in area, pressure increases to some extent, because the flow starts expanding due to increasing in area the pressure drops gradually till the flow completely expands and reaches a steady state value once there is no pressure energy left in the flow.
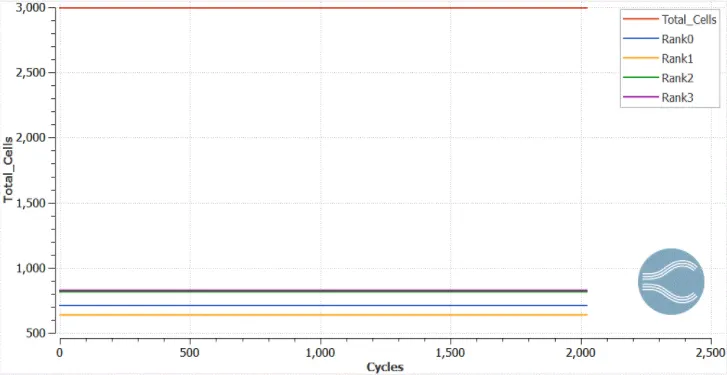
The total cell count is a constant value throughout the simulation and it only depends on the base mesh size of what we give. The main intention of the cell count is that. by increasing the number of elements or the cells the solution can be improved to a converged value and the result obatined will be a accurate one. And also by increasing the total cell count the behaviour of the flow through each element or cell can be observed and results can be inferred.
The links of the youtube videos are
https://www.youtube.com/watch?v=oeeTCNvQjvM
https://youtu.be/U3HxCXObumc
Case Study 3:dx=dy=dz=1.0e-3 m
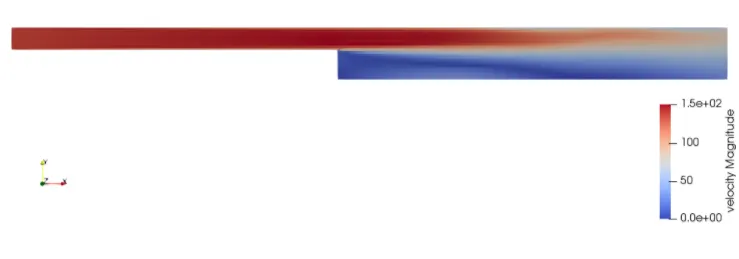
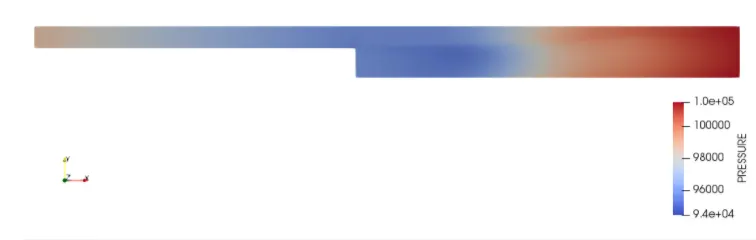
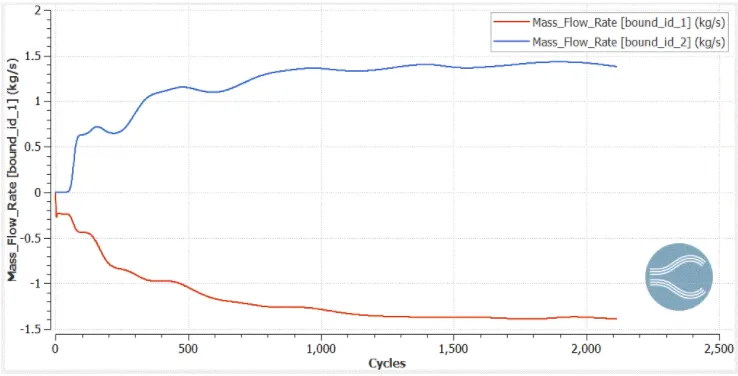
A better plot is obtained here when compared to above two meshes. As mass flow rate involves the components like density, pressure, area of the geometry and the velocity of the flow taking place through it. Mass flow rate is the amount of fluid in 'kg' passing through a given area in unit interval of time(s).Initially when the flow starts the mass-flow rate decreasesand reaches a steady state value when the solution reaches convergence.
As mass flow rate involves the components like density, pressure, area of the geometry and the velocity of the flow taking place through it. Mass flow rate is the amount of fluid in 'kg' passing through a given area in unit interval of time(s). Initially when the flow starts the mass-flow rate decreases in the sense at the exit the mass-flow rate is increasing and as the solution reaches the steady state value the mass-flow rate at the exit also comes to a constant value at the exit boundary.
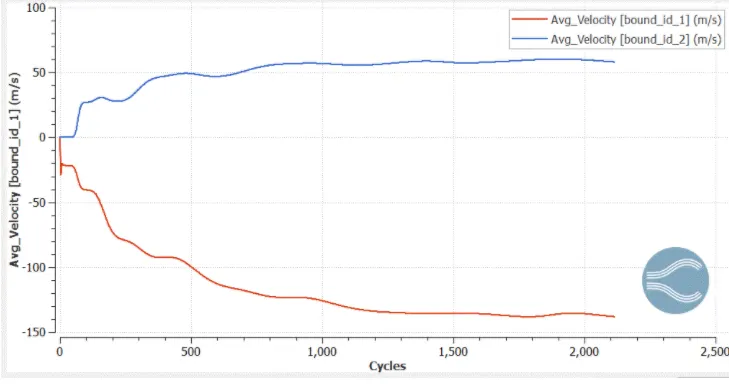
Once the flow crosses the first half of the geometry with increase in area the flow starts to expand and there by the flow starts accelerating which increases the velocity of the flow and when the solution reaches the steady state, the velocity becomes almost a constant value.
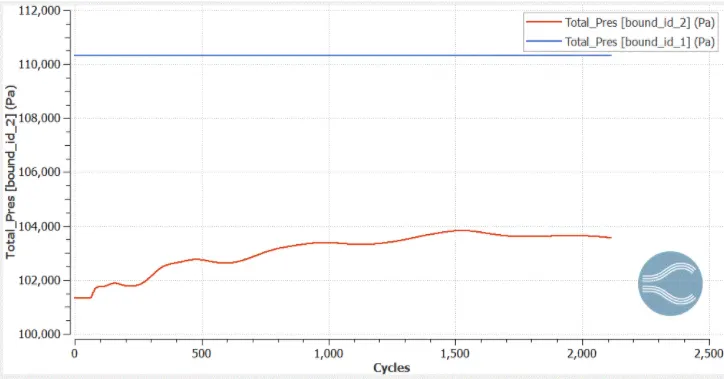
The mesh done here is finer one and the bheaviour and results of pressure are observed here are accurate. A plot of pressure v/s cycles is shown. Initially at the inlet the pressure is high and as the flow starts from the inlet the pressure increases as the first half is a constant area channel.
Once the flow reaches the second half the geometry with increase in area, pressure increases to some extent, because the flow starts expanding due to increasing in area the pressure drops gradually till the flow completely expands and reaches a steady state value once there is no pressure energy left in the flow.
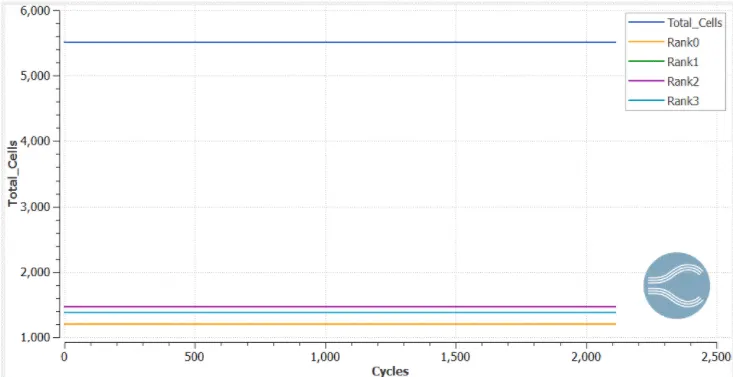
With the increase in mesh size the number of elements are increased here. The total cell count is a constant value throughout the simulation and it only depends on the base mesh size of what we give.The main intention of the cell count is that. by increasing the number of elements or the cells the solution can be improved to a converged value and the result obatined will be a accurate one. And also by increasing the total cell count the behaviour of the flow through each element or cell can be observed and results can be inferred.
The links of the youtube videos are
https://youtu.be/ubRvUWTbwqk
https://youtu.be/RmOJmOw-Mbk
Conclusion
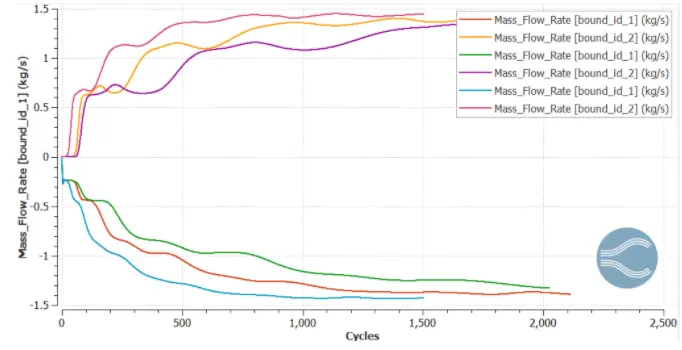
Graph for the average mass flow rate through both inlet and outlet for all the three cases is compared below:- The mass flow rate for all the 3 cases are the same after 2500 cycles approx. the outflow and inflow mass rate are equal to 1.5 kg/s approximately.
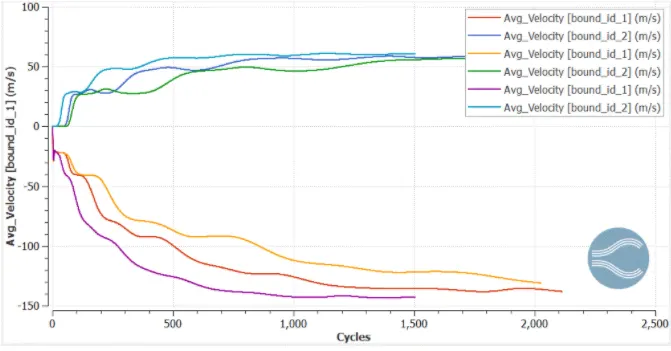
Graph for the average velocity through both inlet and outlet for all the three cases is compared below:- The mass flow rate for all the 3 cases are the same after 2500 cycles approx. the outflow average flow velocity equal to 60m/s approximately.
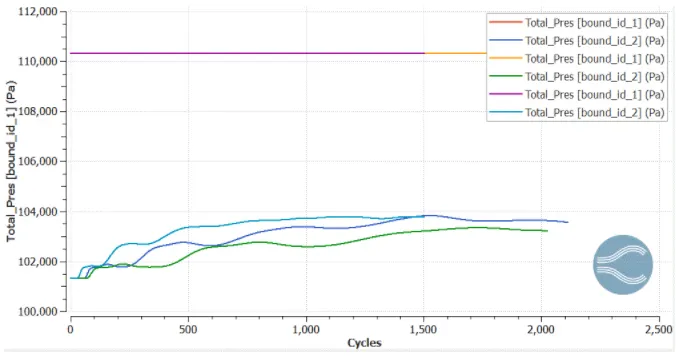
Graph for the Total pressure through both inlet and outlet for all the three cases is compared below:- The mass flow rate for all the 3 cases are the same after 2500 cycles approx. the outflow total pressure equal to 104000 Pa approximately.
Different Zones of Turbulence
The Youtube video showing the different regions of turbulence is
https://www.youtube.com/watch?v=w9NmG7zAhOI