Modeling and Simulation of flow around an Ahmed Body
Aim:
The major objective of this project was to model and set up the simulation of flow around an Ahmed Body using Converge CFD and Comparing the simulation result with the experimental data provided.
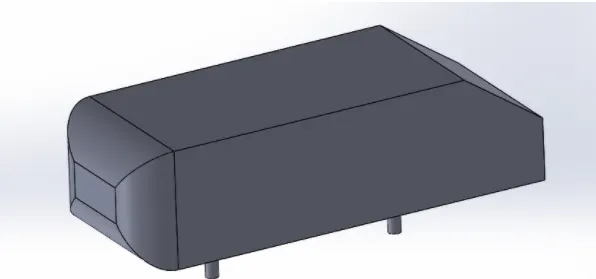
Geometry creation of an Ahmed body using Solidworks
Isometric View
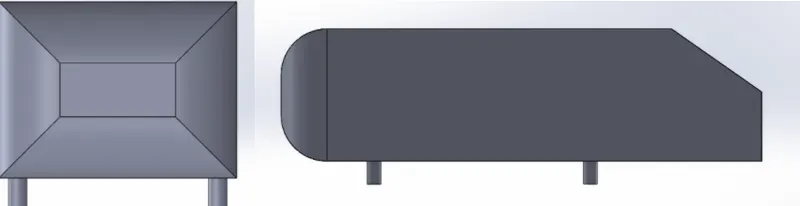
Front View and Side View
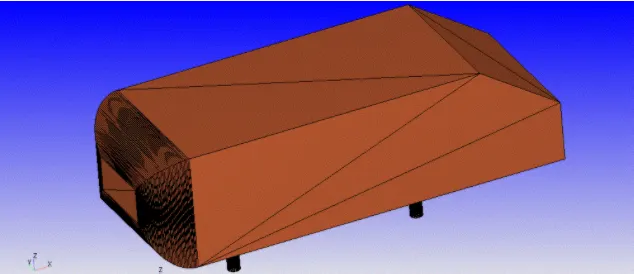
Geometry Creation
The Virtual Wind Tunnel Dimension is :
| Dx(m) | Dy(m) | Dz(m) |
| 10.264 | 4 | 2.5 |
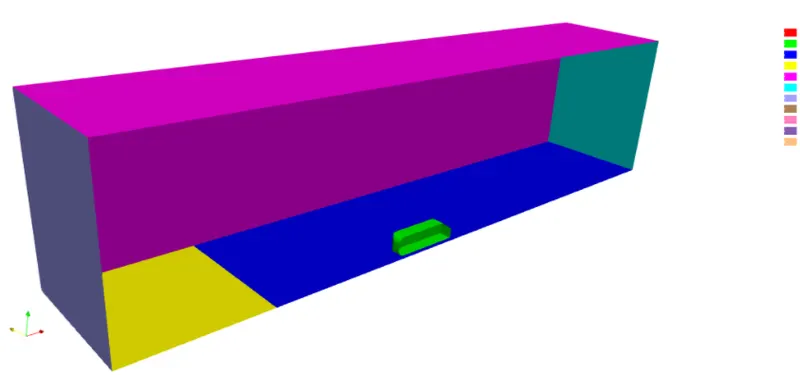
| Inlet | Grey |
| Outlet | Green |
| Symmetry Wall | Pink |
| No-Slip wall | Blue |
| Slip Wall | Yellow |
| Ahmed Body | Green(Leaf color) |
Simulation Results
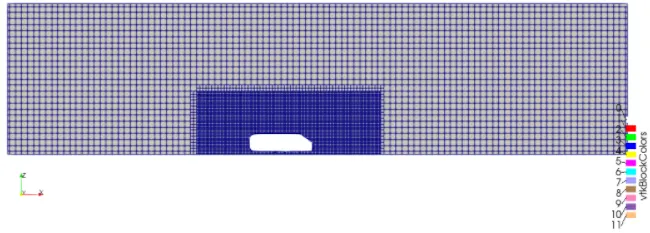
Mesh Model
Converge Plots
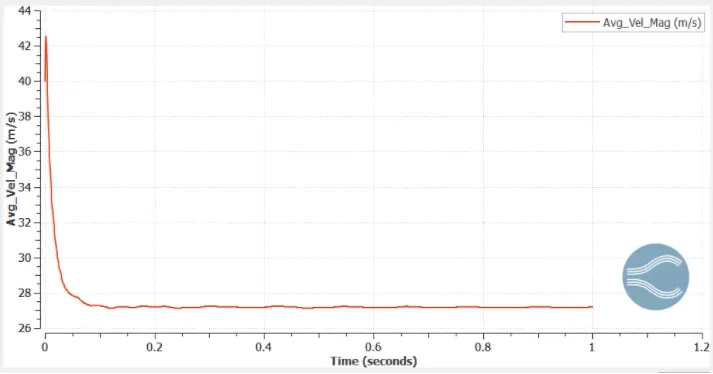
Velocity Plots
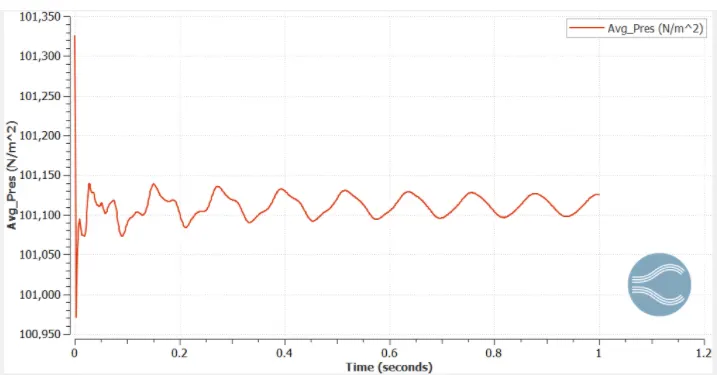
Pressure Plot
Contours
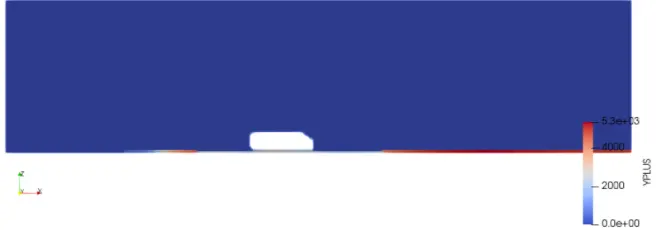
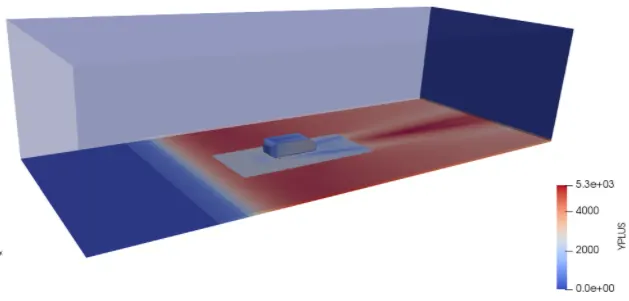
Y plus Contours
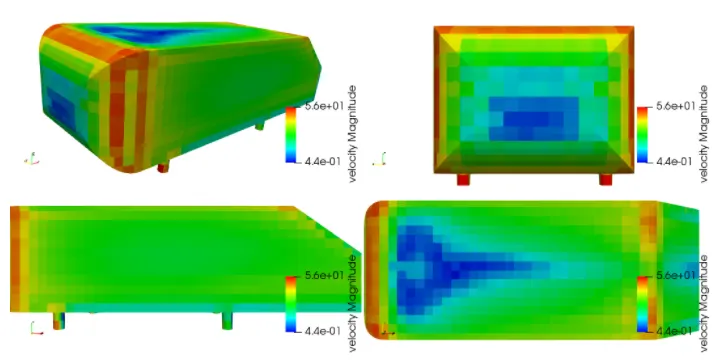
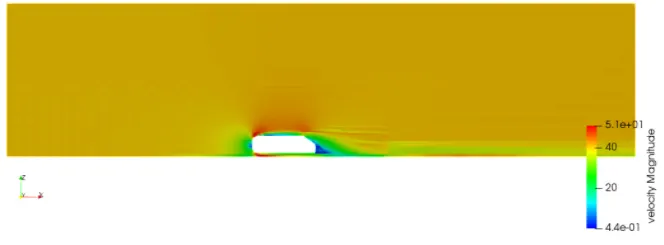
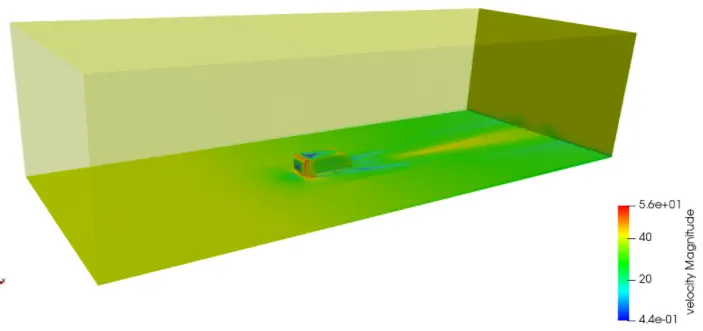
Velocity Contour
Observation
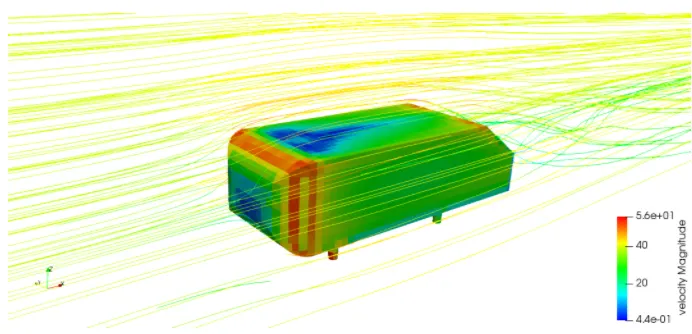
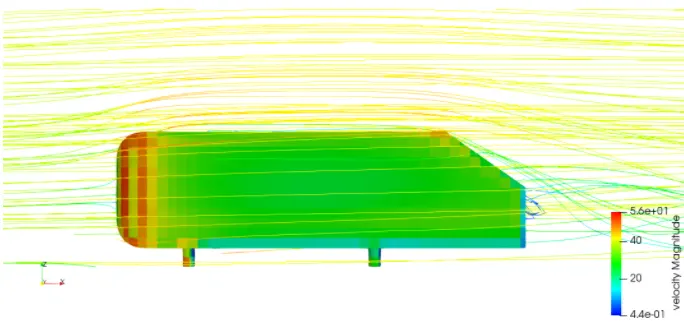
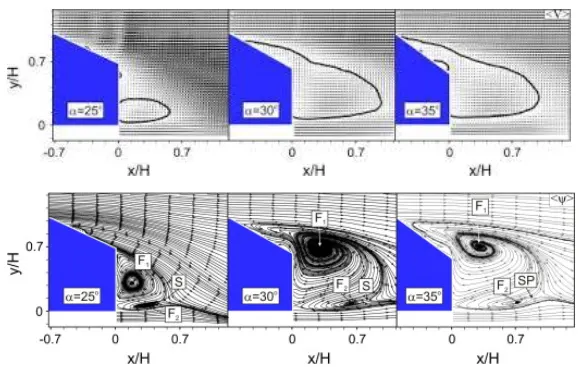
The velocity at the backside(indicated in blue color) is very low and there is a formation of the recirculation zone the top and side surface of Ahmed's body has a layer of very high velocity along with high pressure. then due to slant, the flow is getting separated along with the formation of recirculation.
The Velocity is very low in the windward side because the airstrikes the front area and losses its kinetic energy. The low-velocity region along the trailing edge is called the wake region, which is due to the slant angle of Ahmed's body i.e.35 deg. it is accorded to the geometry. this seems to move because the vortices formed in the region due to the recirculation of air. This contributes to the majority of the drag force on the body as it causes suction to take place in the location which ultimately adds up the drag on the body.
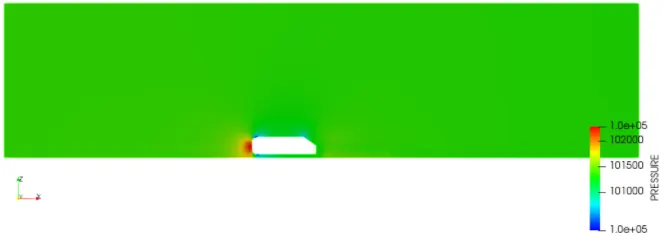
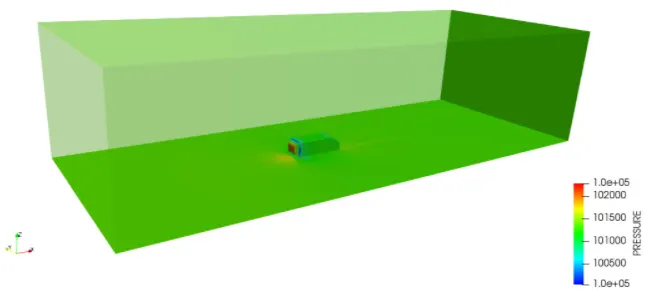
Pressure Contour
Flow Lines
Observation
The pressure is very high on the front face of Ahmed's body due to flatness its because the wing is hitting that surface and forming a high-pressure zone indicating in the red zone.
The pressure becomes a bit lower on the top and sidewalls of Ahmed's body and has a little bit of high pressure as compared to the backend of Ahmed's body that has very low pressure because the wing losses its kinetic energy. As the airstrikes, the front surface the kinetic energy becomes low which results in loss of pressure as well as velocity. The pressure is known as stagnation pressure. the flow separation takes place at the sharp ends which is responsible for wakes formation and also responsible for pressure drop
Velocity in X-axis along with different Z location
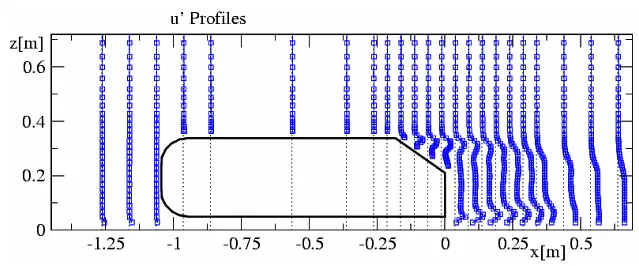
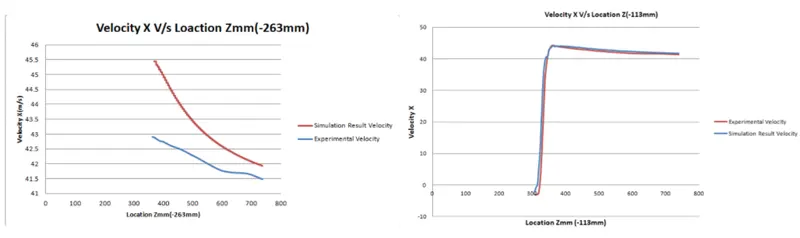
As the probe is near to Top surface of Ahmed Body the velocity is more but less than that of the front surface the kinetic energy of the wind is reduced. The high-pressure layer is formed on the top surface that has high velocity and it reduces means the air disturbance reduces as the probe point up along z-axis.
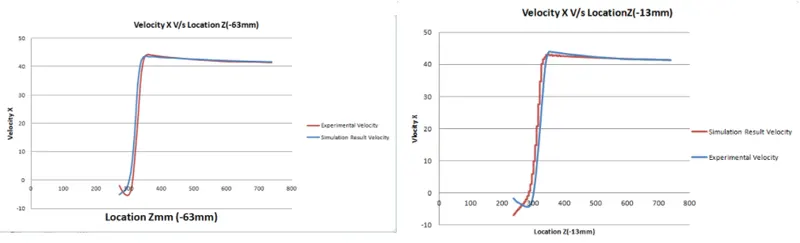
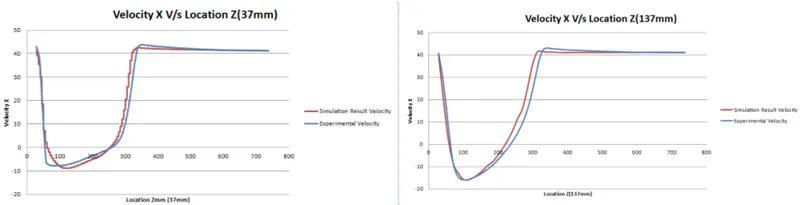
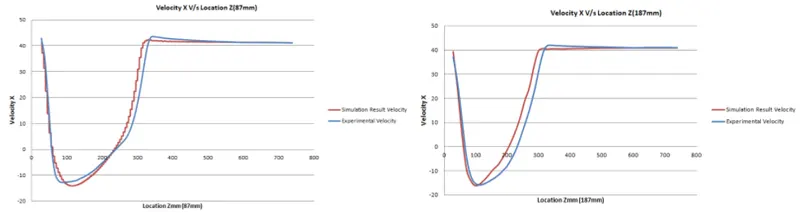
The last 4 Plots represent the region just behind the Ahmed body where there is the formation of the recirculation zone that has low pressure and low velocity. When the probe is just below the Ahmed body the velocity is high, then slowly it approaches the recirculation zone that has low pressure. suddenly after the wakes region finishes the velocity becomes normal.
The error in the plots is due to Coarse quality mesh because the system did not have enough computational resources.
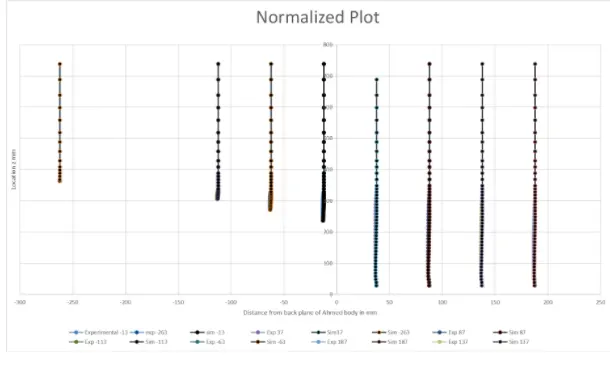
Normalized Plot
Converge Plot
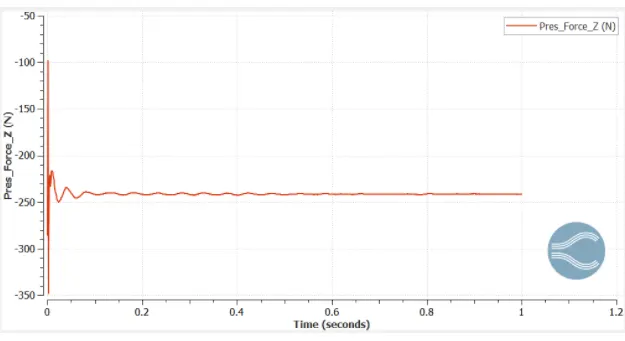
Lift Force
Drag Force
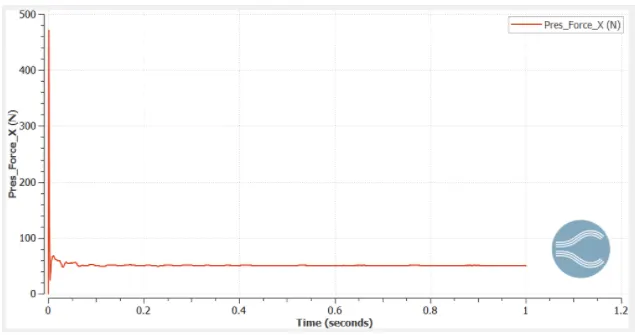
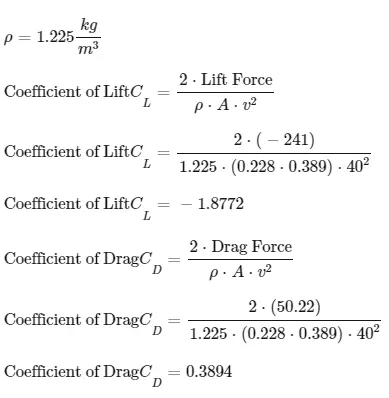
The Lift Force is found to be -241N
The Drag Force is found to be 50.22N
Fontal Area(A)=0.228x.389
Conclusion:
At last, it can be concluded that in order to get more accurate data the mesh should be finer but the computation time will increase because a lot of error can be seen in plots that were plotted for different z locations for different Velocity X. The normalized plot was created which was okay as the Experimental and simulation value were intersecting each other mostly.
The Value of Lift and Drag force from Converge and ParaView was found to be the same. These values were used to calculate the coefficient of lift and drag.
Coefficient of Lift CL=−1.8772
Coefficient of Drag CD=0.3894
The surface below to Ahmed's body was kept as the Noslip wall is because we wanted to capture the vicious region. In the Velocity plot, a recirculation plot can be found just behind the Ahmed body where velocity drops and pressure also drops(the region where the slant surface finishes). The Maximum Pressure is found on the front curve surface regions.
The links of the youtube videos of the animations are