Project Steady state simulation of flow over a throttle body
Aim:
The main objective of this project is to set up the case to perform simulation of steady-state flow over a Throttle valve when it is fully open and post-processing the result using ParaView.
Introduction:
The report contains a detailed description of the steady-state flow simulation over a Throttle valve using converge CFD software, solving it using CYGWIN and post-processing the result using ParaView. Various steps are discussed in this report while making a case set up for the case study. This report contains a detailed description of the case study with grid sizing, line plots, and contours.
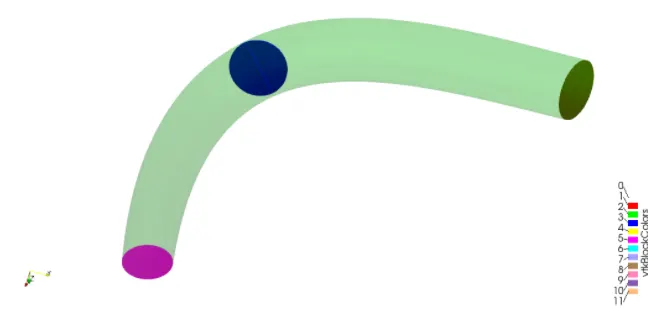
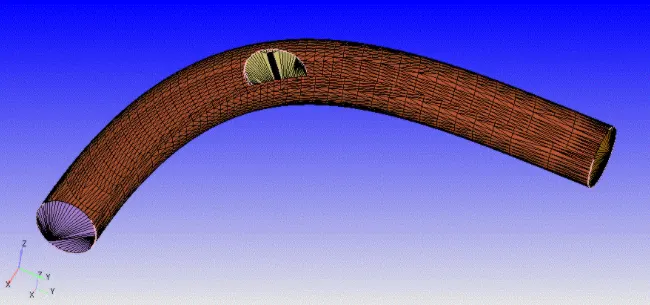
1.Geometry Creation
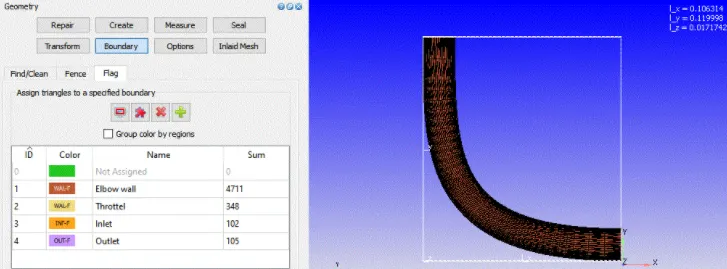
2.Boundary Creation
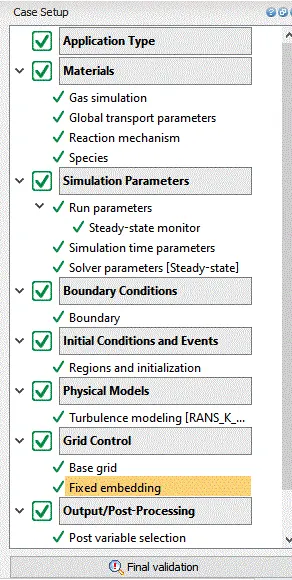
3.Case-Study Setup
STEADY STATE SIMULATION:
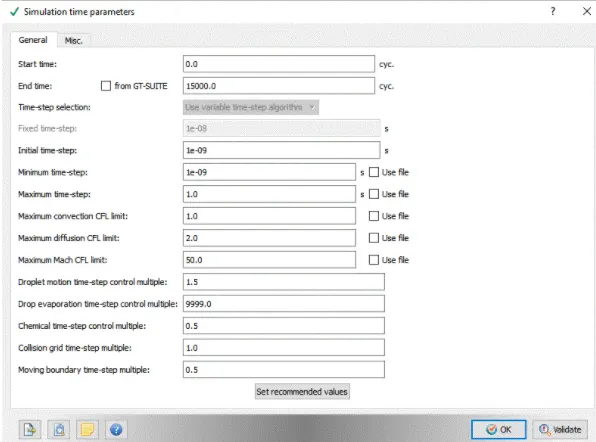
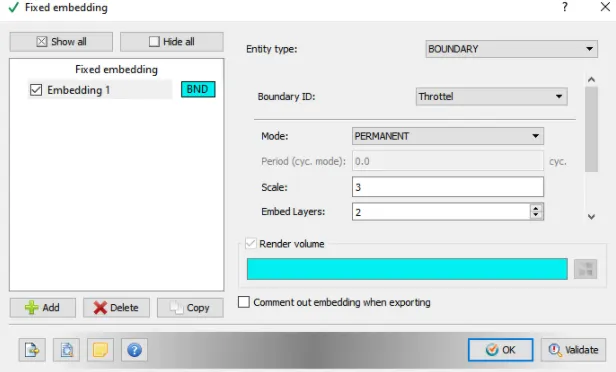
Grid Control:
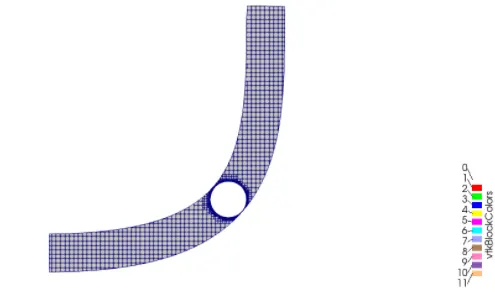
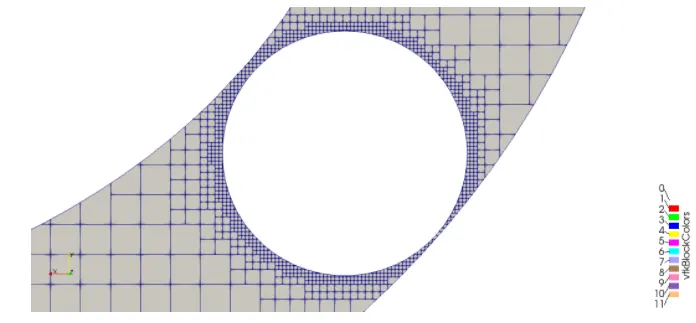
Meshed Geometry
Case Study: dx=dy=dz=2e-3 m
Result
Line Plots & Contours
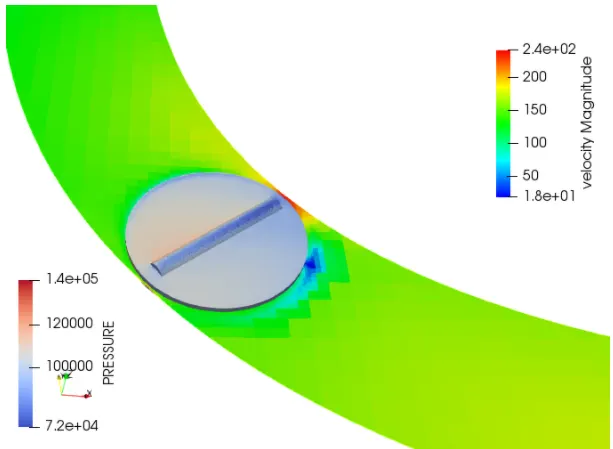
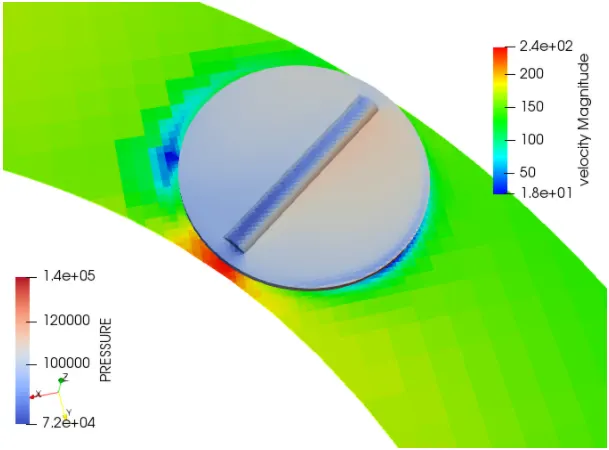
The velocity contour of a section cut along the plane normal to he z-axis is as shown below. The maximum velocity of 240m/s is predicted near the gapping between the throttle and elbow wall which is understandable due to the reduced flow area at that section and also lowest velocity is noticed behind the valve where is flow is obstructed.
Pressure Contour:
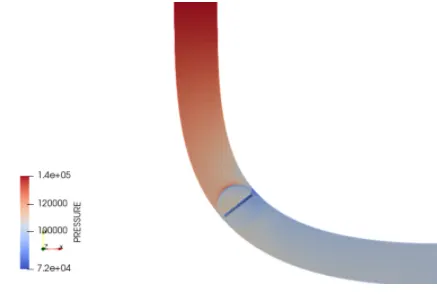
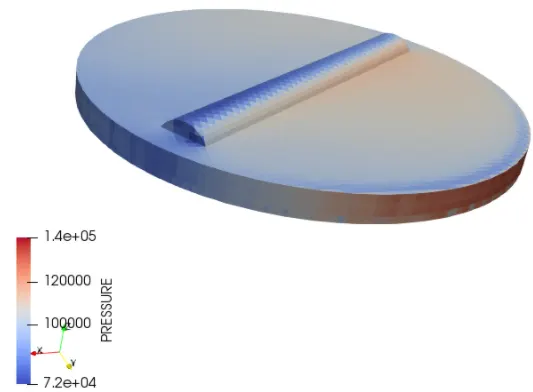
The Pressure contour of a section cut along the plane normal to he z-axis is as shown below. The maximum pressure of 1.4 Bar is predicted near the gapping between the throttle and elbow wall which is understandable due to the reduced flow area at that section and also the pressure of .5 bar is noticed behind the valve where is flow is obstructed.
The links of the youtube videos are-
https://www.youtube.com/watch?v=lBpSMfDXdEM
https://www.youtube.com/watch?v=HYr6SBFAzjE
Conclusion
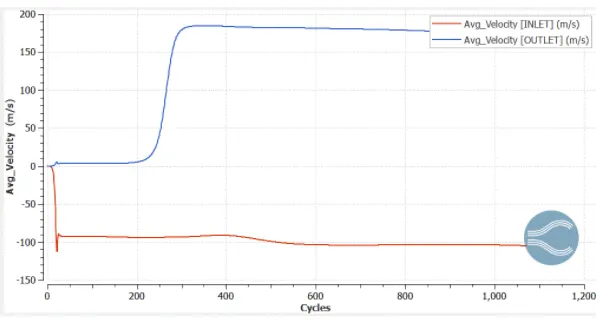
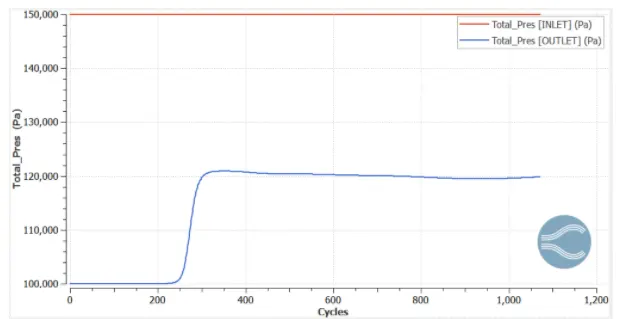
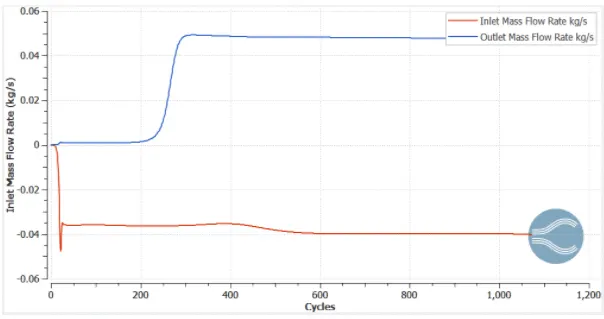
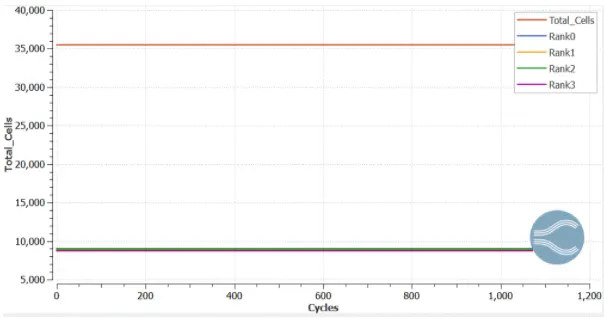
Graph for the average mass flow rate through both inlet and outlet for thus case- The mass flow rate after 1200 cycles approx. the outflow and inflow mass rate is equal to 0.05 kg/s approximately. The maximum pressure of 1.4 Bar is predicted near the gapping between the throttle and elbow wall which is understandable due to the reduced flow area at that section and also the pressure of .5 bar is noticed behind the valve where is flow is obstructed. The maximum velocity of 240m/s is predicted near the gapping between the throttle and elbow wall which is understandable due to the reduced flow area at that section and also lowest velocity is noticed behind the valve where is flow is obstructed. The total number of cells was found to be nearly 36,000. The Fixed Embedding option helped to capture more number of the cell near to elbow wall and throttle.