Challenge WOT Condition Part-2
Question
- What is the difference between mapped and dynamic model of engine, motor and generator? How can you change model type?
- How does the model calculate miles per gallon? Which factors are considered to model fuel flow?
- Run the HEV ReferenceApplication with WOT drive cycle. Change the grade and wind velocity in the environment block. Comment on the results.
- Keeping all other parameters same, compare the simulated results of hybrid and pure electric powertrains.
Answers
#1
Mapped Model:
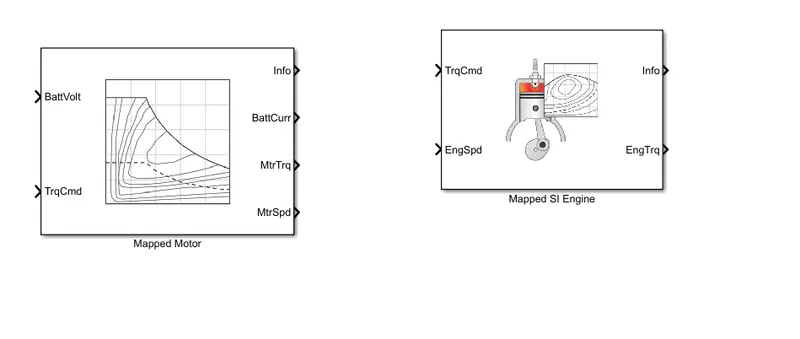
Mapped models already contains the lookup data of the model under different operating conditions. These models represent the macro behaviour of engine, motor, generator as a set of lookup tables of motor speed, power, torque, efficiency, etc. It is used for quasi steady state simulations.
Shown below is a model of a mapped motor and a mapped SI engine,
Dynamic Model
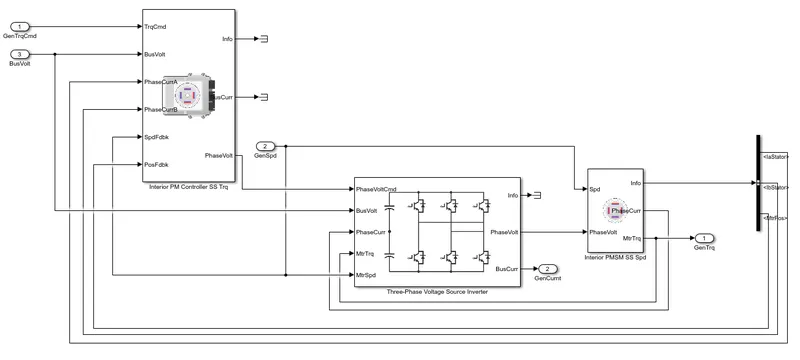
While the dynamic models contains various subsystems which are actual models and their outputs are combined to generate the result. Simulations done using dynamic models take much longer time than those done with mapped models as there are many individual subsystems to run. This model considers real-time parameters therefore its accuracy is very high.
Shown below is the dynamic model of a PM motor controller with a 3 phase voltage source,
Steps to change the model type,
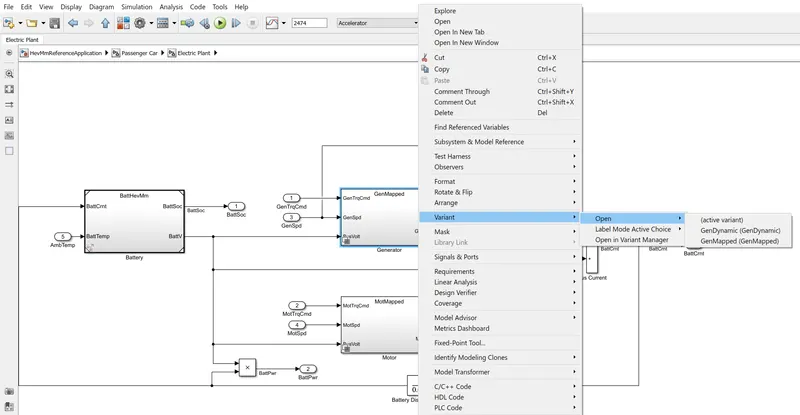
First, choose the required model. Then right-click on that model and click on the 'variant' option. Once that is done, two options can be seen, one for mapped model and the other for dynamic model. Choose the required type of model and continue with the simulation processes.
#2
For conventional vehicles fuel efficiency is calculated in terms of miles per gallon (MPG). It is the number of miles a vehicle can be driven per gallon of fuel. Electric vehicles do not burn fuel directly and hence an equivalent measurement is required to compare their fuel economy to that of the conventional vehicles. MPGe, miles per gallon equivalent was created for electric vehicles.
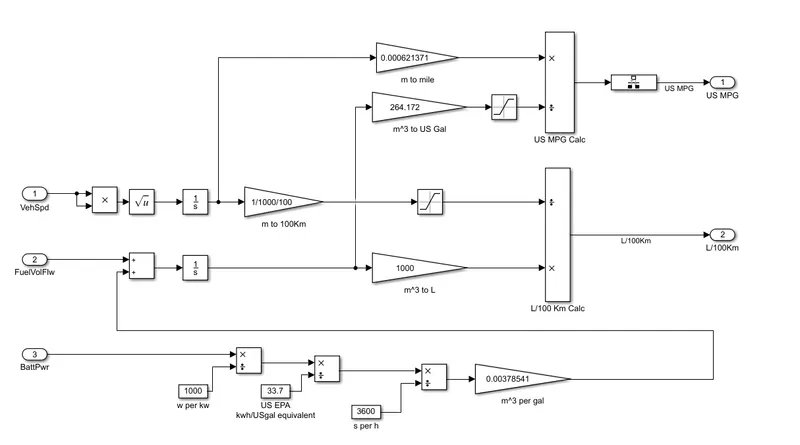
There are three different inputs to be considered,
- Vehicle Speed
- Fuel flow
- Battery power
In order to compare the fuel economy, the vehicle speed and battery power are required as input. The comparison is simple as the battery power is converted to gallons and vehicle speed to miles. The kilogram of fuel is converted into cubic meter by multiplying by `1/(1000xx0.739)`
The battery power in kW is converted into gallons per hour by dividing by 33.7, it is so because EPA calculates onr gallon of gas is equivalent to 33.7 kWh of electricity. Then divide the value by 3600 to get the result in per seconds and multiply by 0.00378541 to get the result in cubic meter per gallon.
#3
Hybrid Electric Vehicle Model
Shown below is the model of the HEV,
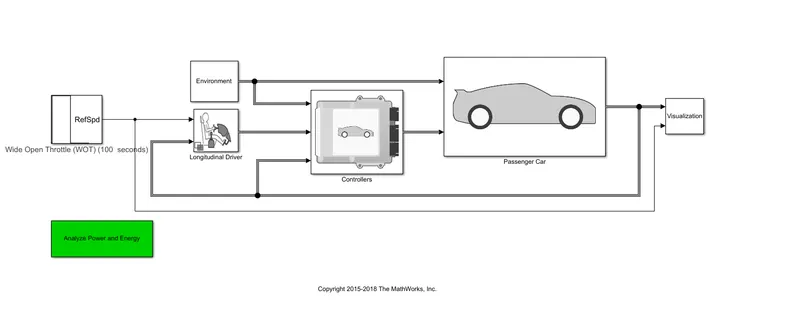
WOT parameters:
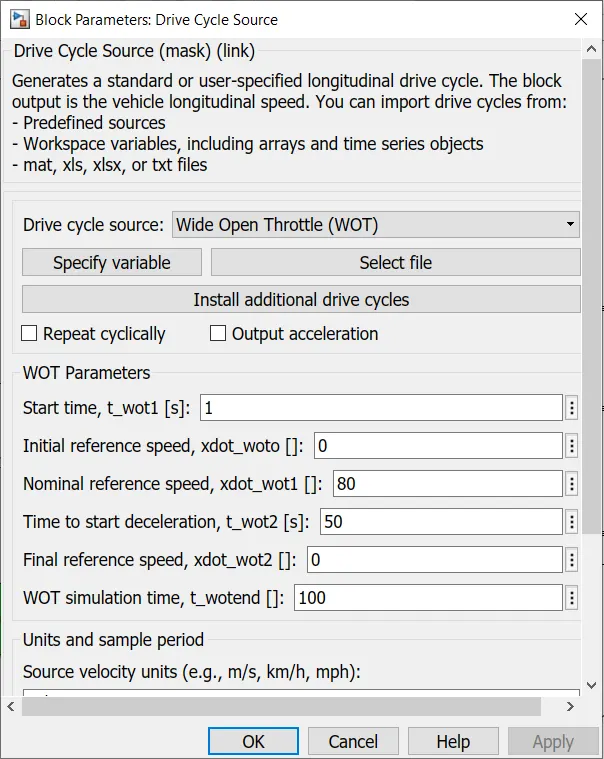
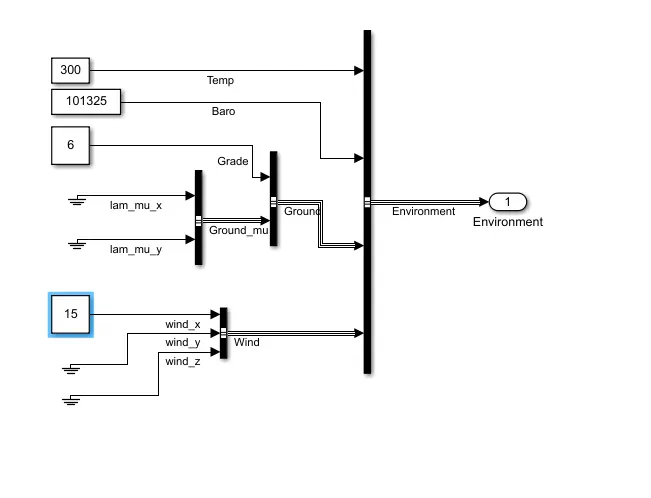
Grade and wind velocity parameters:
Result
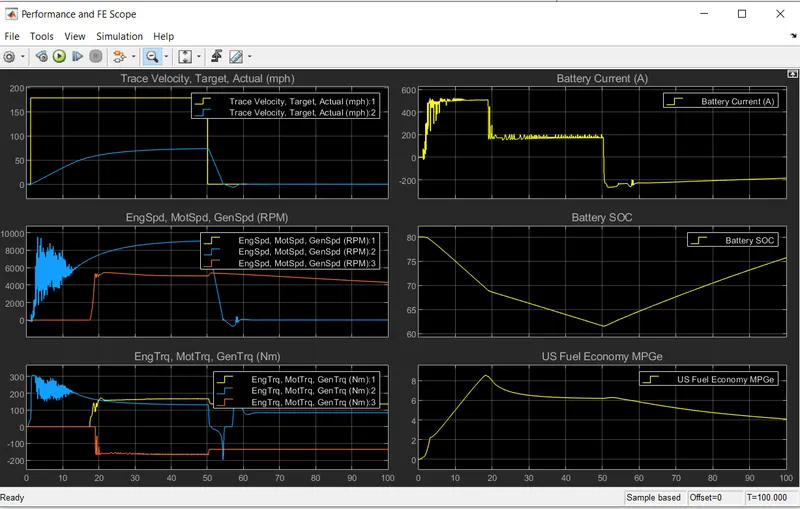
Plot 1:
It can seen that the vehicle cannot reach its top speed due to wind velocity acting against it and at the time of 50-sec deceleration occurs and speed comes to zero. Due to wind velocity aginst the vehicle the speed becomes negative for sometime, below 0 as it can seen in the first plot.
Plot 2:
This plot shows the change in the speed of the motor, engine, generator in rpm where motor reached to 9014 rpm but the generator reached 5371 rpm.
Plot 3:
This shows how the torque changes in motor, generator, engine. For the first 17 sec, the torque of the motor and the generator were the same, and then engine torque increases as the vehicle running against the wind.
Plot 4:
This plot represents the current drawn by the battery, for that first few moments the vehicle is at rest therefore the current drawn remains close to zero. Then the vehicle tries to accelerate using power from the engine and motor, it can be understood from the graph that the motor was working at full power drawing around 500A of current. The current drawn reduces as the vehicle picks up speed. Once the vehicle starts to decelerate the current becomes negative indicating that the battery is getting charged.
Plot 5:
This plot shows the state of charge of the battery, the SoC of the battery has fallen from 80% to 61% during acceleration and during deceleration the SoC of the battery increased to 76% from 61%.
Plot 6:
This plot shows the fuel consumption in miles per gallon for the given drive cycle, and for WOT it is 4-8 miles per gallon.
#4
Electric Vehicle Model
Shown below is the model of a pure EV,
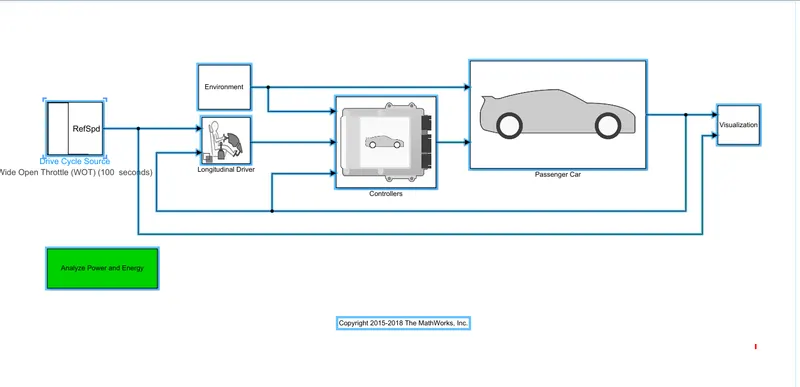
WOT parameters:
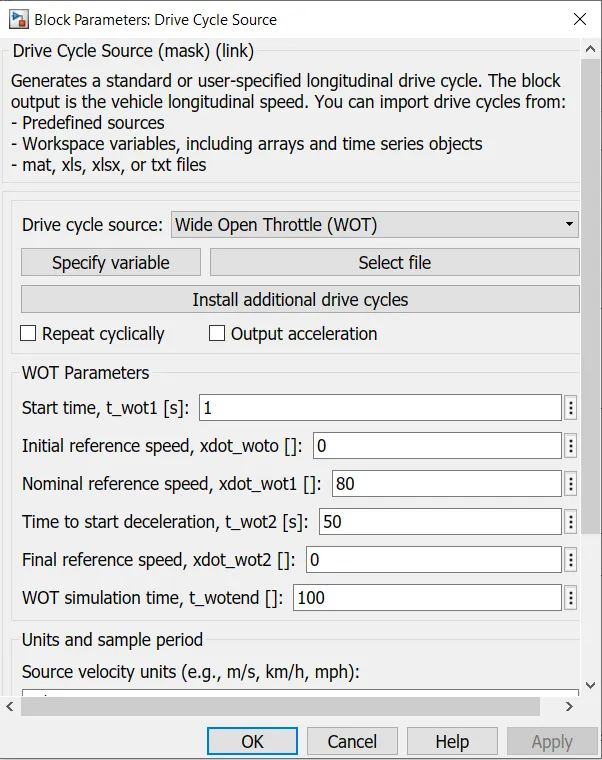
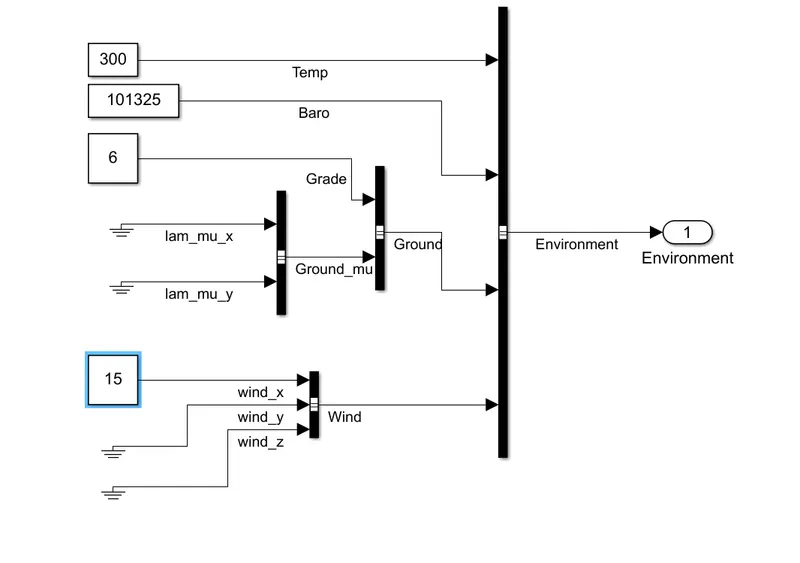
Grade and wind velocity parameters:
Results
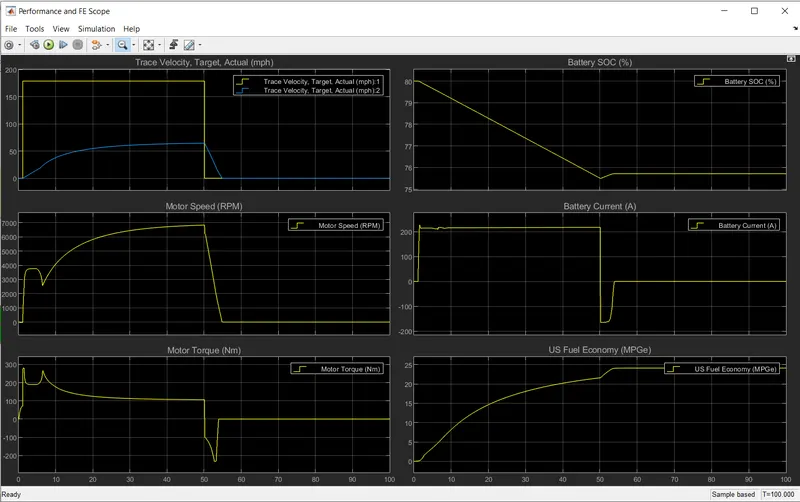
Plot 1:
The velocity achieved is less in this cycle compared to the HEV model and it can be seen that the speed doesnt become negative due to wind velocity and deceleration in the electric vehicle model.
Plot 2:
The motor speed increases with the vehicle speed proportionally and at a constant vehicle speed it remains stable, it decreases as the vehicle decelerates.
Plot 3:
The torque remains the same during the initial period. Torque increases with the increase in speed and becomes a constant as the speed becomes constant.
plot 4:
The SoC of the battery is more efficient in case of the electric vehicle with just a loss of 4%
Plot 5:
It can be seen that during the inital period the current drawn by the motor is high as this indicates that the motor produced high torque to pick up speed.
Plot 6:
This plot represent the fuel consumption in miles per gallon for the given drive cycle, for WOT it is 25 miles per gallon which is way more than the HEV model.
It can be concluded that the over all efficiency of the electric vehicle is more that that of the hybrid electric vehicle. Also HEV can cover more distance than pure electric vehicles for the same amount of fuel. The battery discharge rate is less in electric vehicles than in HEVs.