Calculation of a drag force opposing the bicycle motion based on varying velocity and drag coefficient.
Aim – To calculate the drag force opposing the motion of a bicycle and determine the relationship of drag force with vehicle speed and drag coefficient
Introduction – Drag force is a very crucial parameter that plays an essential role for calculating the air resistance of a bicycle in motion.
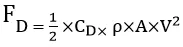
Drag force is given by a formula,
Where,
= Drag coefficient
ρ = Air density in
A = Frontal Area in
V = Velocity of a bicycle in
Drag force depends on Drag coefficient, Air density, Velocity, Frontal area of a rider and a bicycle. Usually riders used to change their positions in order to minimize the frontal area. Velocity of a bicycle affects multiple times than the other parameters.
Project show the codes to generate the following plots:
- Code to generate the plot Velocity vs Drag Force
- Code to generate the plot Drag coefficient vs Drag Force
Code 1: Code to generate the plot Velocity vs Drag Force
%Flow over bicycle- To Calculate Drag Force
%Code to generate the plot Velocity vs Drag Force
%Inputs
%Density in Kg/m^3
rho = 1.2;

%Frontal Area in m^2
A = 0.1;

%Drag Coefficient Cd
Cd = 0.8;

%Velocity in m/sec
v = [3:2:50];

%Drag Force
Fd = 0.5*Cd*rho*A*v.^2;

plot(v,Fd,'Linewidth',2,'color','r');
xlabel('Velocity');
ylabel('Drag Force');
grid on
Explanation –
Drag force is calculated by the given formula with given parameters ρ, , A, V. In this project, the velocity is taken from 3 m/s to 50 m/s with the increment of 2 m/s. Elementwise operator is used to calculate the drag force with multiple velocity values.
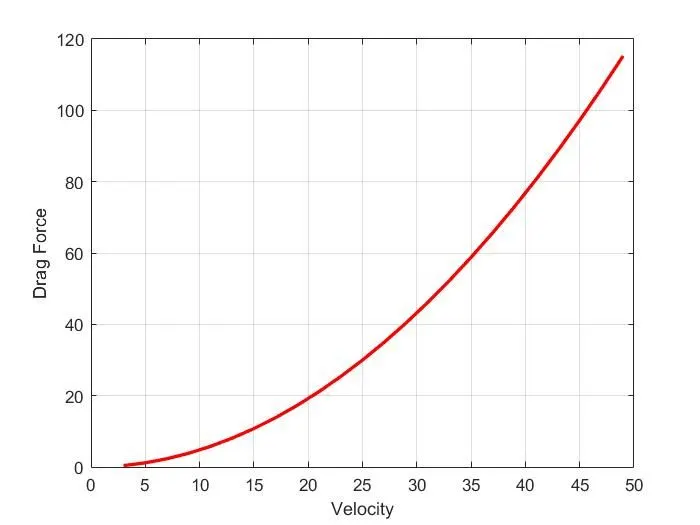
Results – The plot of Drag force with velocity is parabolic and is given by,
Code 2 – Code to generate the plot Drag coefficient vs Drag Force
%Flow over bicycle- To Calculate Drag Force
%Code to generate the plot Drag coefficient vs Drag Force
%Inputs
%Density in Kg/m^3
rho = 1.2;

%Frontal Area in m^2
A = 0.1;

%Drag Coefficient Cd
Cd = [0.47 0.42 0.50 1.05 0.80 0.82 1.15 0.04 0.09];

%Velocity in m/sec
v = 50;

%Drag Force
Fd = 0.5*Cd.*rho*A*v^2;

plot(Cd,Fd,'Linewidth',2,'color','b');
xlabel('Drag Coefficient');
ylabel('Drag Force');
grid on
Explanation –
The same problem is solved to calculate the drag force. Instead of varying velocities, the value of drag coefficient is varied on the basis of different shapes.
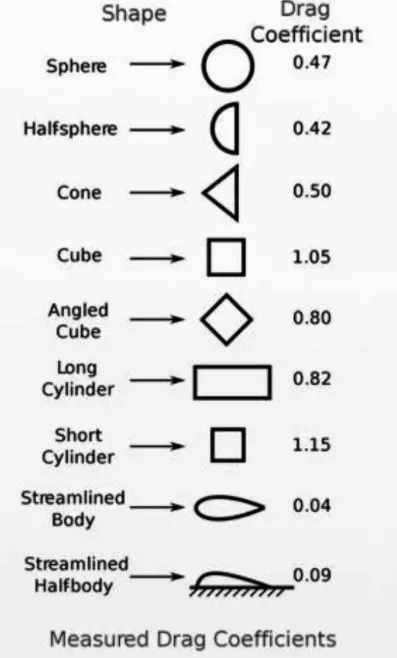
Fig1. Measured Drag coefficients for different shapes.
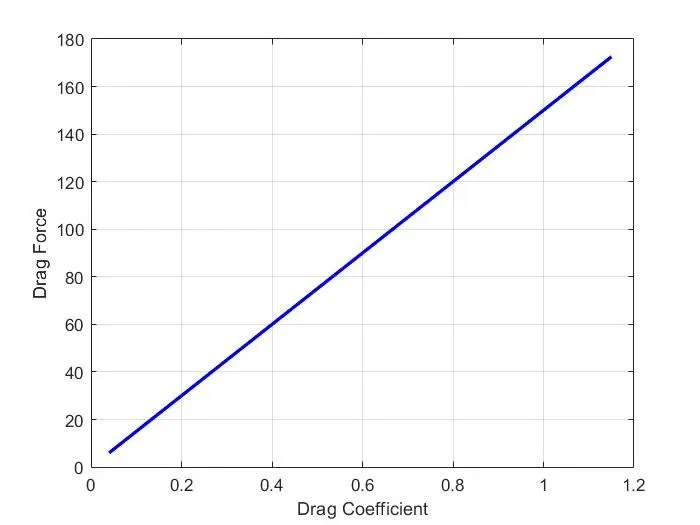
Results – The plot of Drag force with Drag coefficient is linear and is given by,