Bode Plots and Step Response
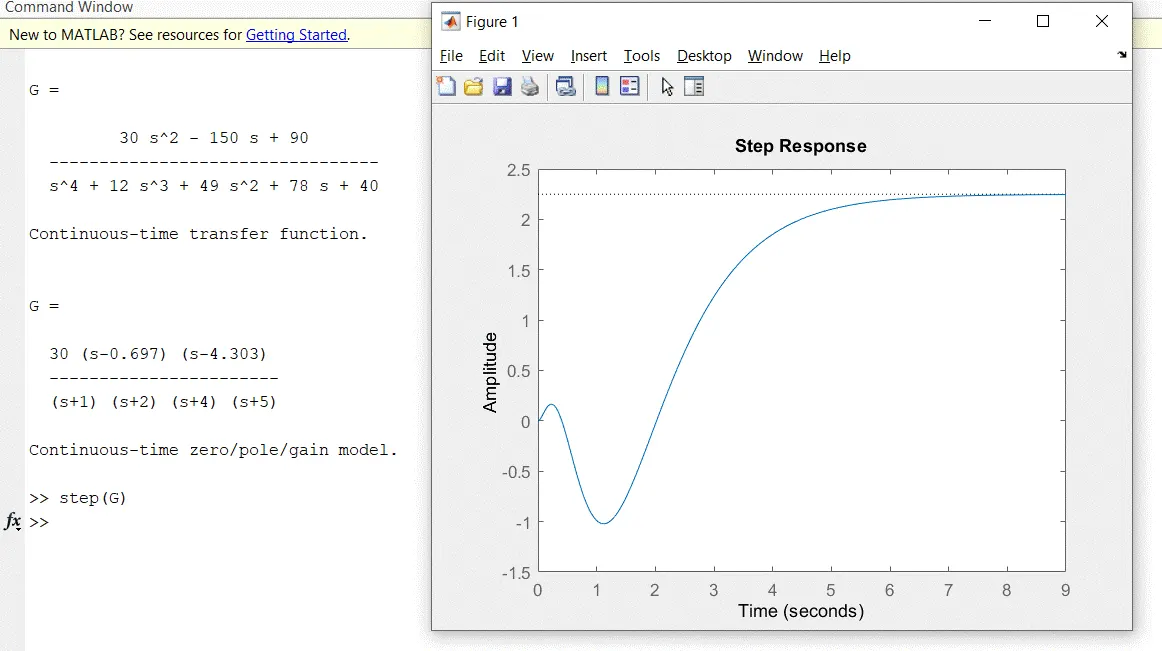
1a) List all the MATLAB commands related to transfer function, pole-zero-gain and step response.
| Function | Command |
| tf | create a transfer function in polynomial form |
| zpk | create a transfer function in zero-pole-gain (factorised) form |
| filt | create a transfer function in digital signal processing (DSP) convention |
b) Apply all the commands for the following transfer functions in MATLAB:
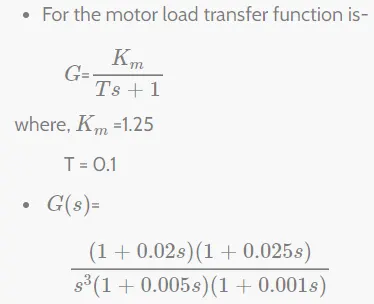
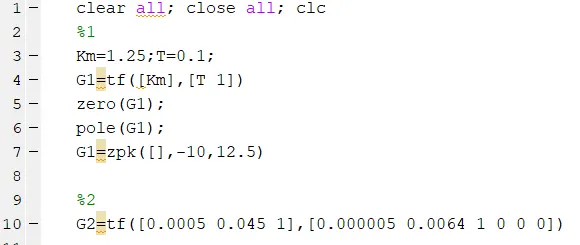
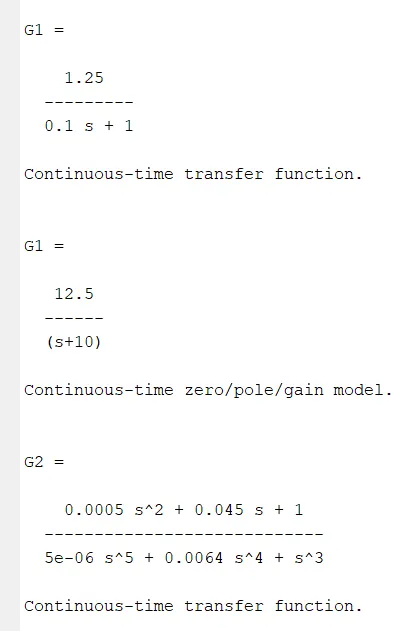
------------------------------------------------------------------------------------------------------------------------------------------------
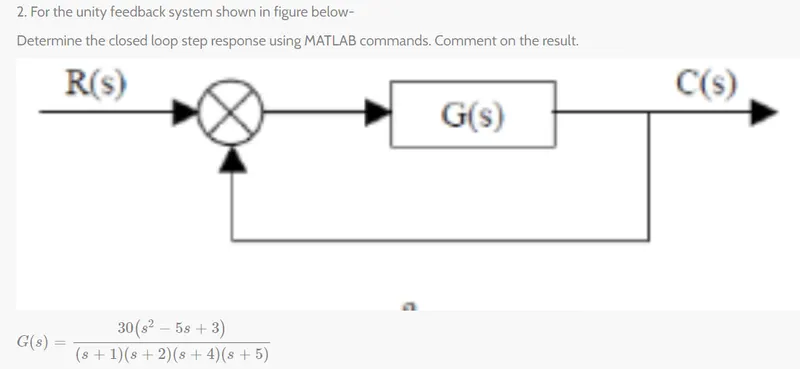
Closed loop step response: A closed loop system contains a feedback loop which enables the control system to compare the desired output with the actual output. This allows the system to closely monitor inputs and the response of the system to those inputs. Changes can be made accordingly to improve the stability and reduce the error of the system since continuous feedback is received.
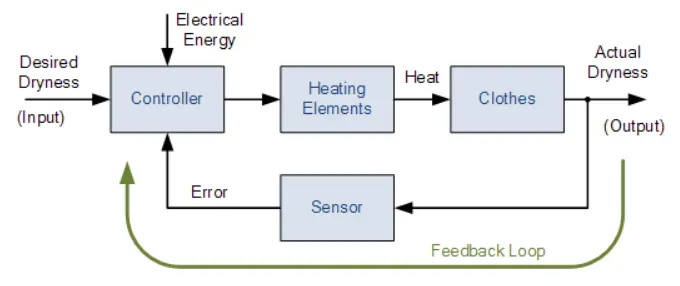
An example of a closed loop system is shown above. Heating energy is provided to dry the clothes, but simultaneously there is also a reference as to what temperature the clothes need to be dried until. With a feedback loop, the actual dryness can be compared to the reference and the control system can respond accordingly i.e. if the temperature of the clothes don't meet the required temperature, then either more heat is provided or drying time is increased. If the clothes have already dried, then any further input of heat is stopped to avoid overheating the clothes.
A closed loop step response is just a closed loop system that provides feedback with every input step signal to improve the system.

------------------------------------------------------------------------------------------------------------------------------------------------
3) Explain the MATLAB model ‘scdspeedctrl’. Comment on results for non-tuned PID gain values.
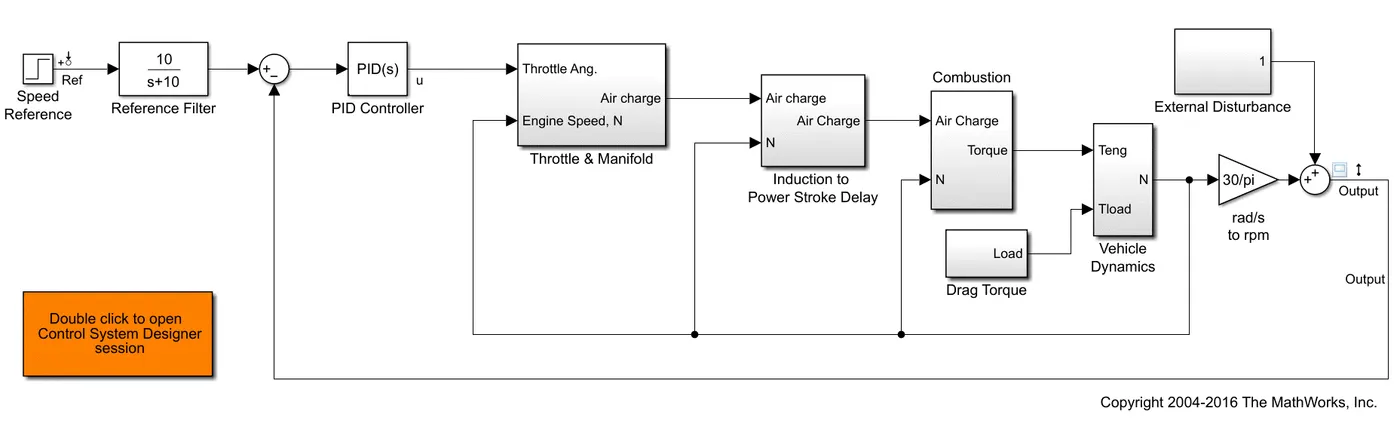
- This model represents an engine speed control setup with a feedback loop
- Represents all the processes of how the engine produces torque i.e. as the throttle is pressed, air flows in --> spark ignition --> combustion takes place --> power stroke produces torque --> subtracted from load torque to get net torque --> converted to engine speed
Non-tuned:
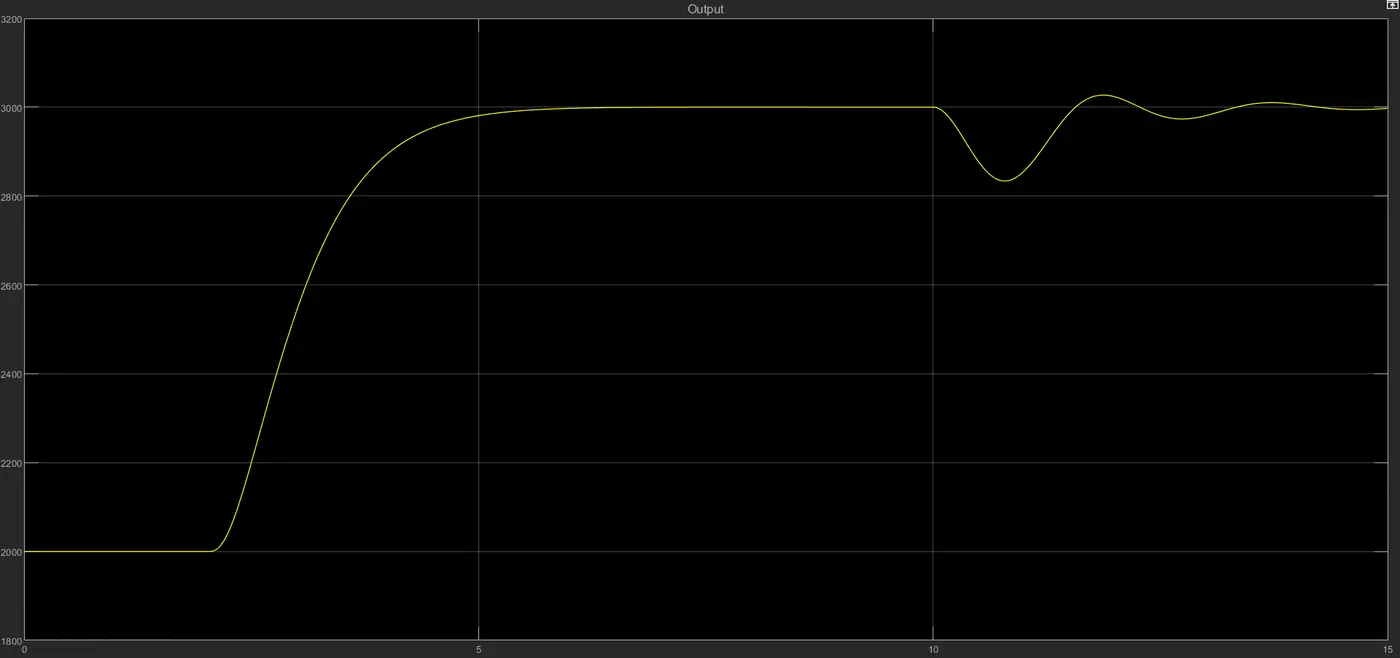
- The step time is set at 2 seconds, which means that there will be a throttle input at t=2sec to increase engine RPM from 2000 to 3000
- The rise time is from 2.3 - 4 sec i.e. about 1.7 sec
- There is no overshoot
- There is no steady state error
- A disturbance is introduced at t=10sec which causes fluctuations in the output. The system takes about 5 seconds to settle including a little overshoot
Tuned:
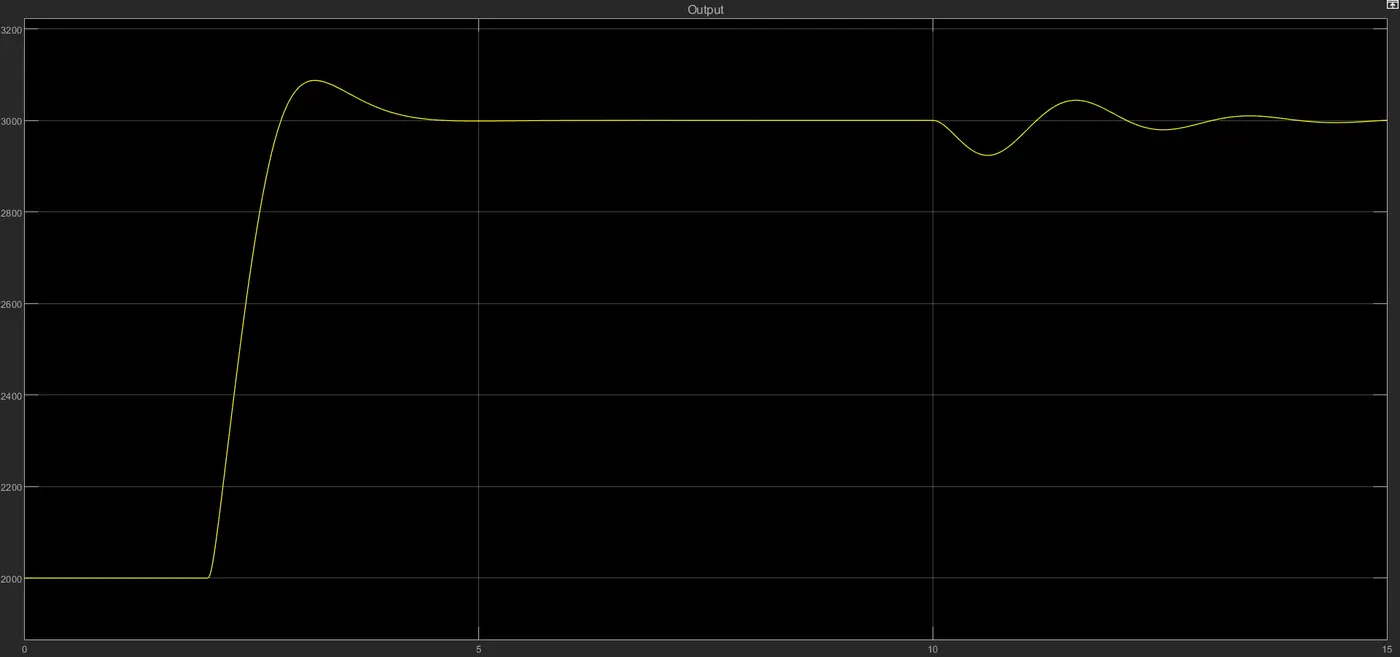
- The rise time is significantly reduced from 1.7sec to 0.6sec (t=2.1-2.7)
- There is an overshoot of about 87RPM but the objective here was to reduce rise time, so a little overshoot is acceptable
- Once the disturbance is introduced, there is less fluctuation in the output, as if a damper or some kind of absorb control was added.
- The settling time is also reduced as the system takes lesser time to stabilize post disturbance
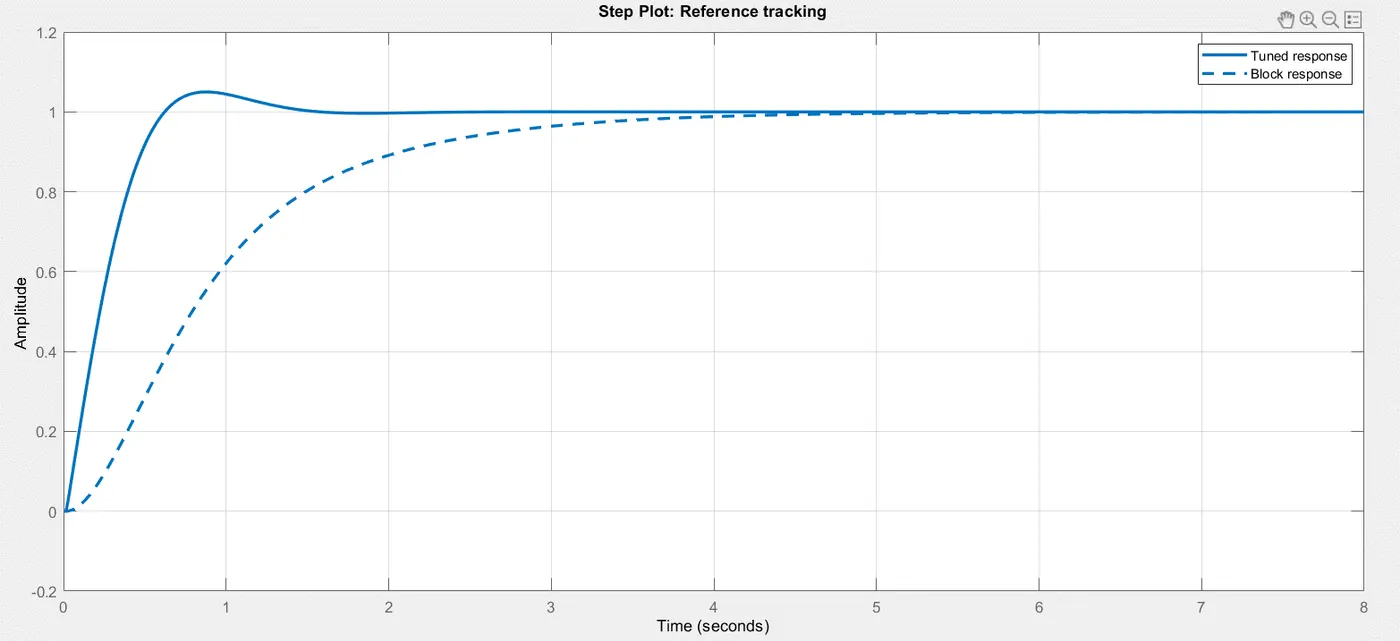
- This graph shows the comparison pre-disturbance and shows the impact tuning can have to optimize the output.
------------------------------------------------------------------------------------------------------------------------------------------------
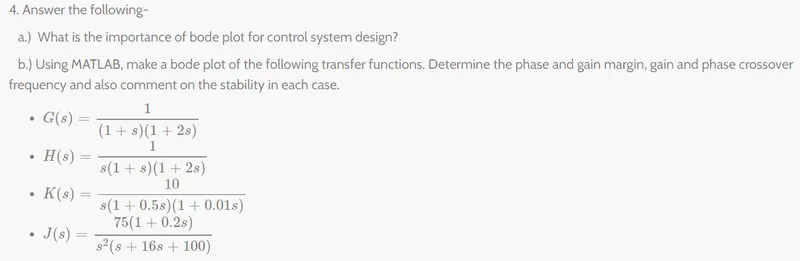
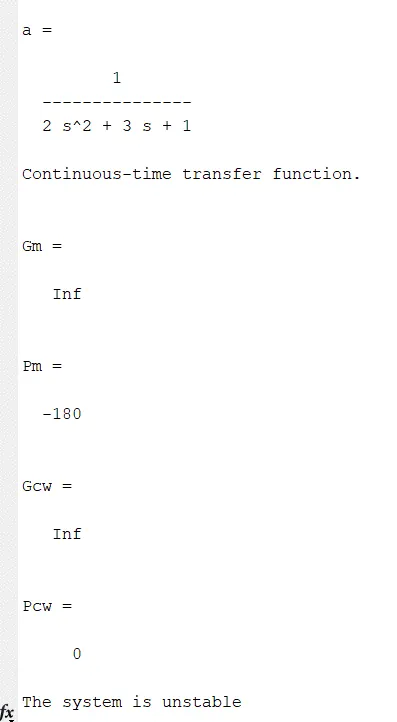
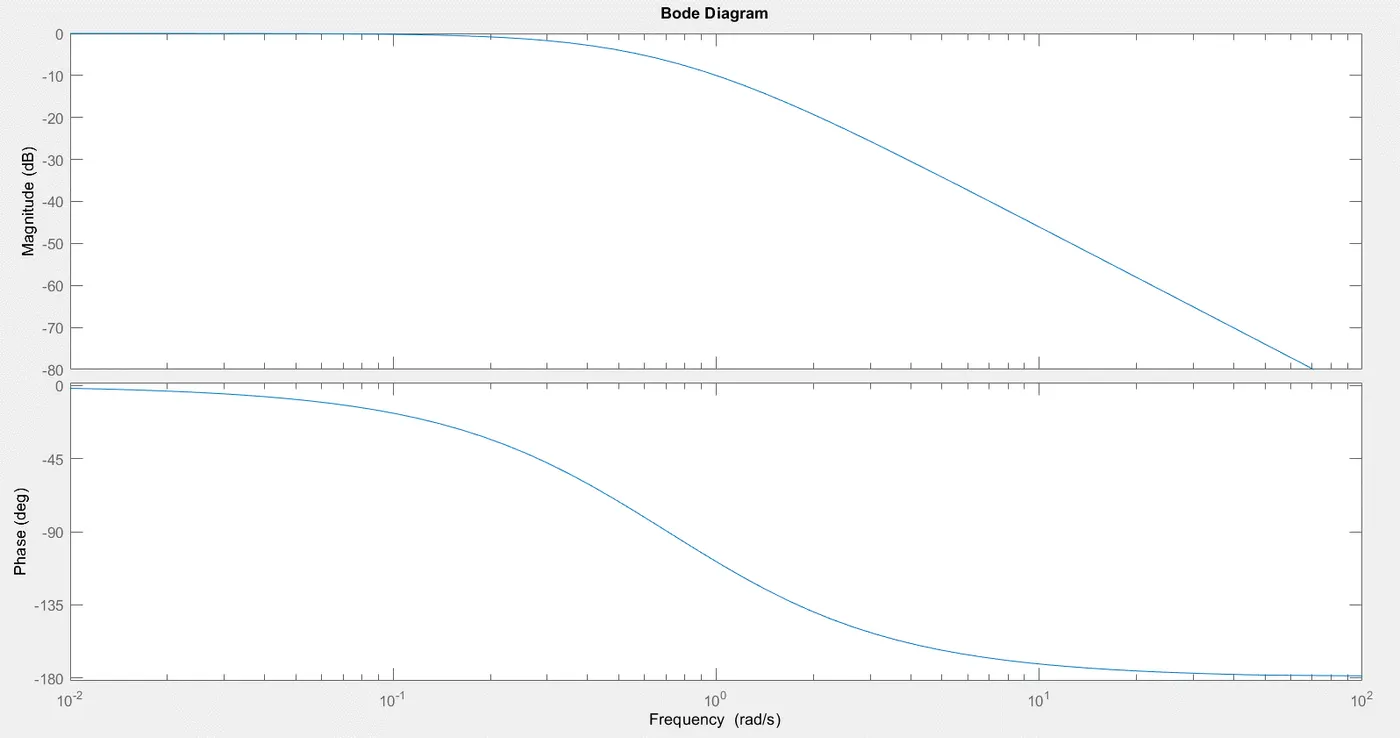
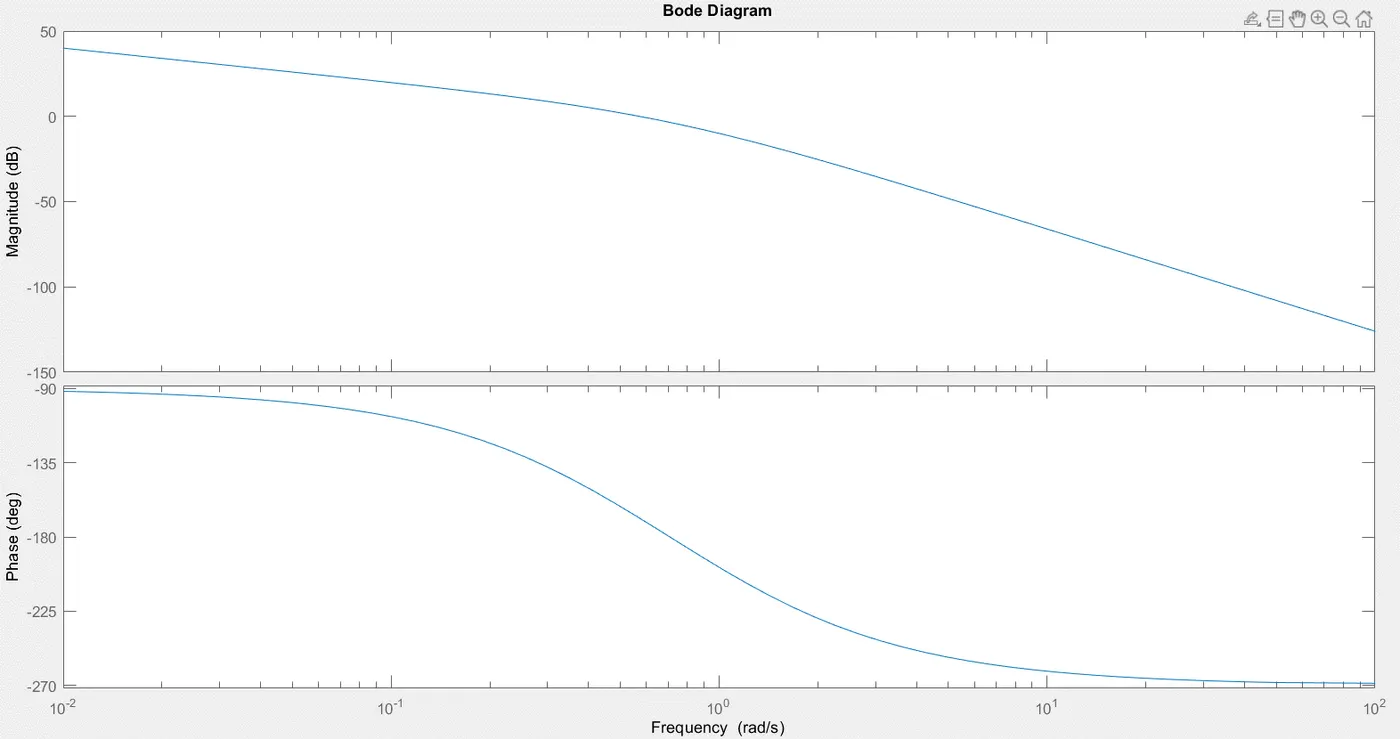
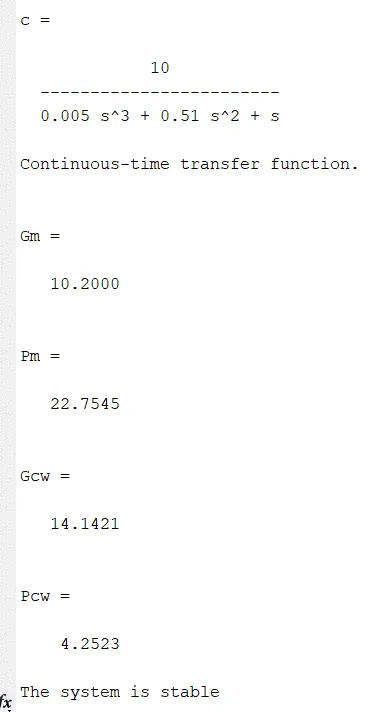
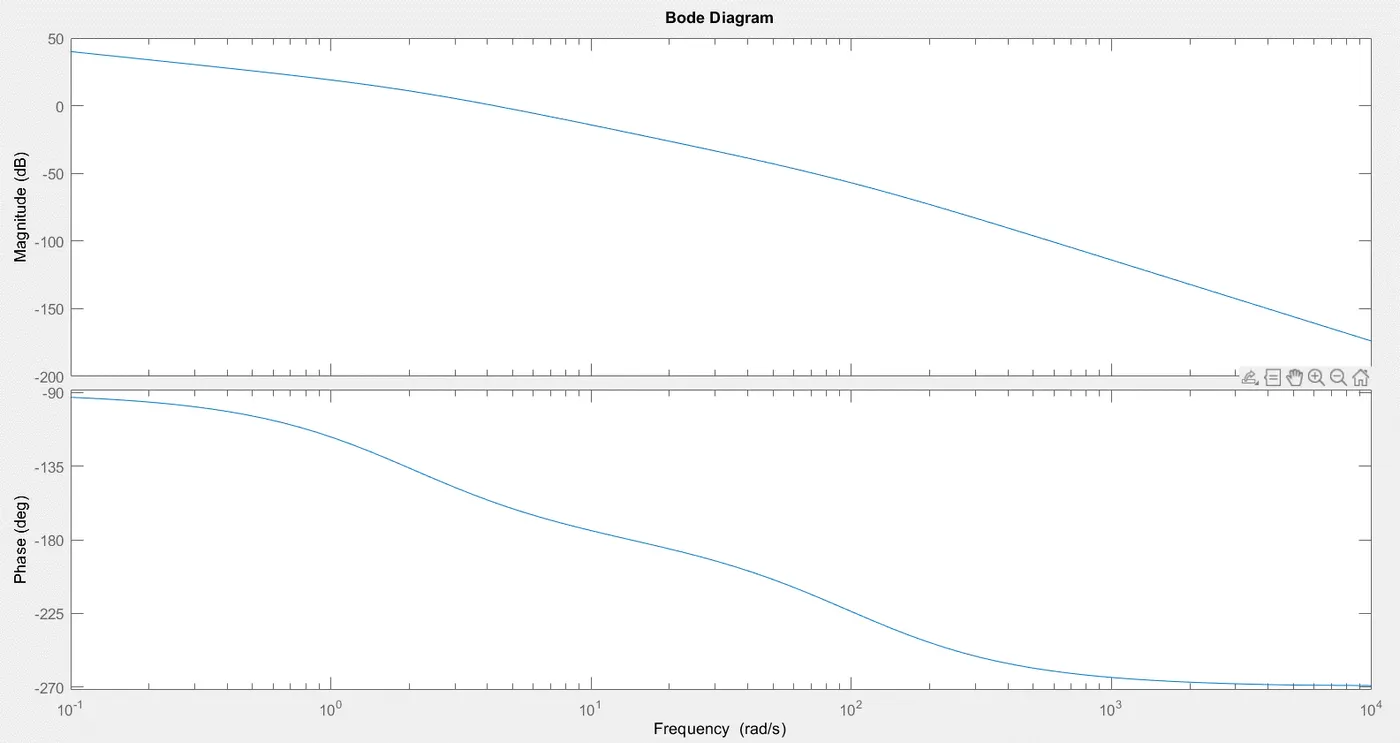
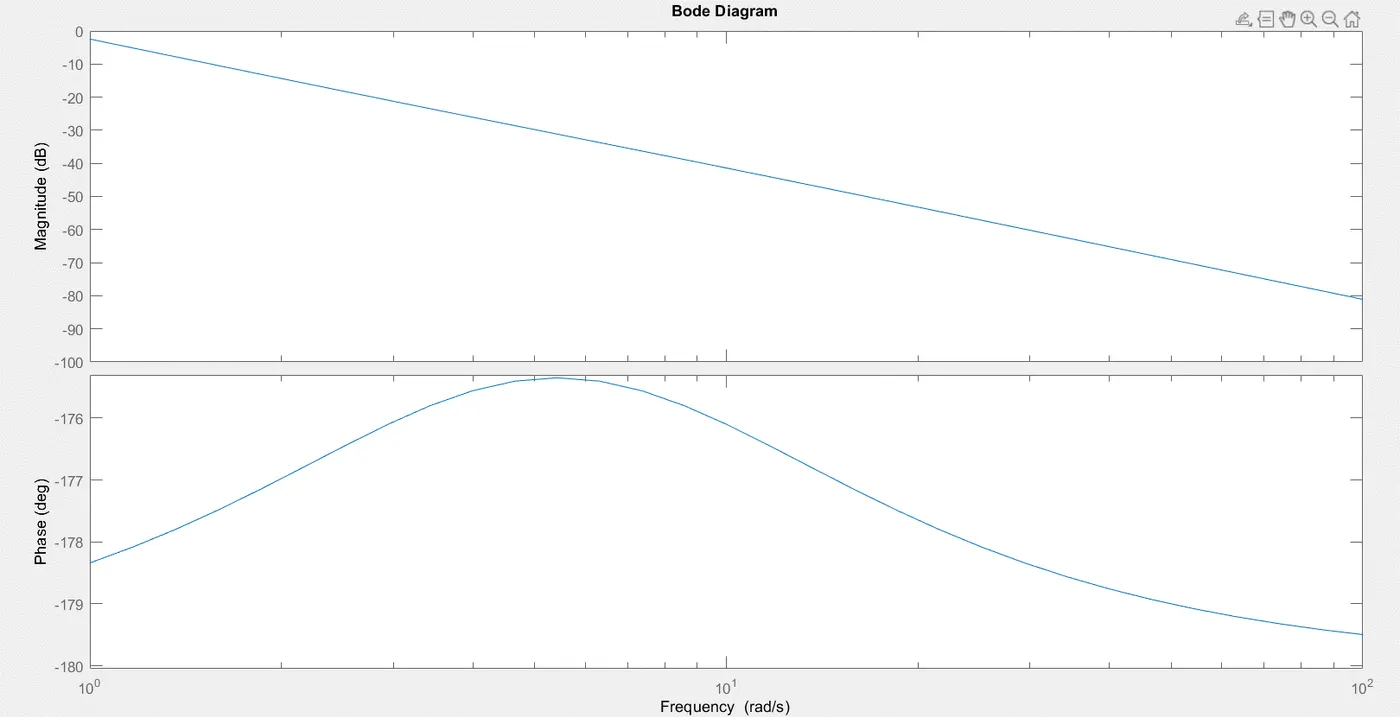
a) A bode plot helps to study the stability of the system and identify & adjust the gain in the system to meet desired specifications. A Bode plot maps the frequency response of the system through two graphs – the Bode magnitude plot (expressing the magnitude in decibels) and the Bode phase plot (expressing the phase shift in degrees)
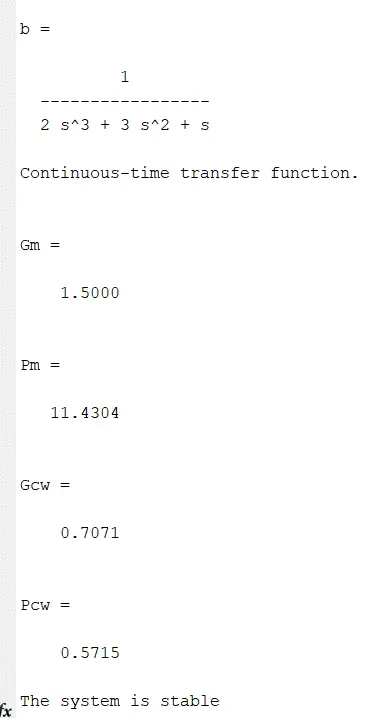
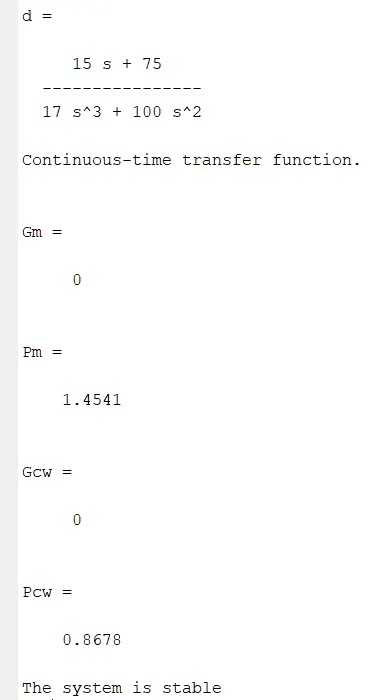
The greater the Gain Margin (GM), the greater the stability of the system. The gain margin refers to the amount of gain, which can be increased or decreased without making the system unstable. It is usually expressed as a magnitude in dB
The greater the Phase Margin (PM), the greater will be the stability of the system. The phase margin refers to the amount of phase, which can be increased or decreased without making the system unstable. It is usually expressed as a phase in degrees
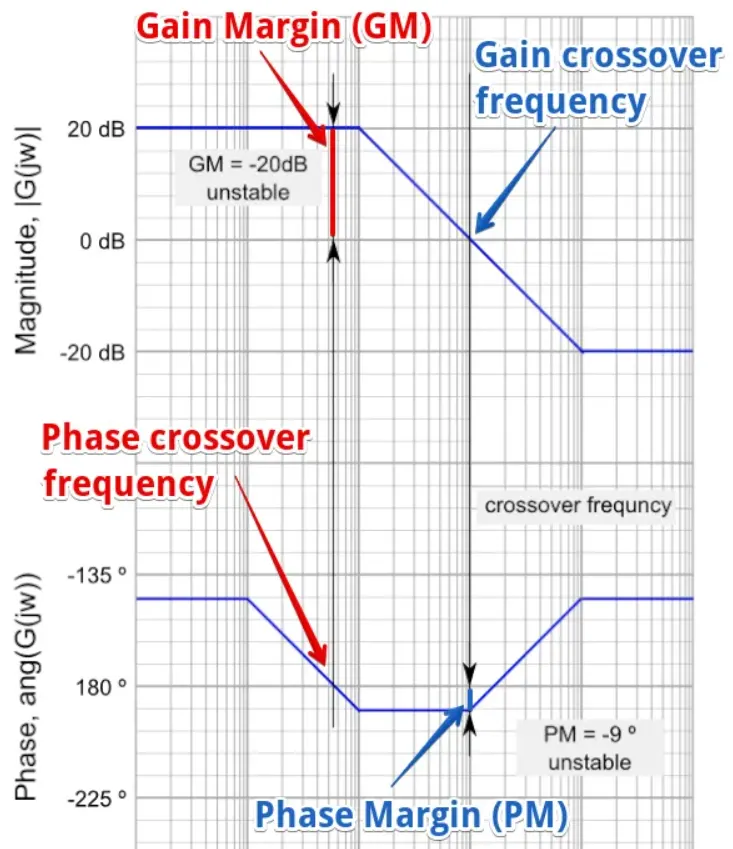
- Gain Margin: Greater will the gain margin greater will be the stability of the system. It refers to the amount of gain, which can be increased or decreased without making the system unstable. It is usually expressed in dB.
- Phase Margin: Greater will the phase margin greater will be the stability of the system. It refers to the phase which can be increased or decreased without making the system unstable. It is usually expressed in phase.
- Gain Crossover Frequency: It refers to the frequency at which the magnitude curve cuts the zero dB axis in the bode plot.
- Phase Crossover Frequency: It refers to the frequency at which phase curve cuts the negative times the 180 degree axis in this plot.
Bode plot stability:
- For a Stable System: Both the margins should be positive or phase margin should be greater than the gain margin.
- For Marginal Stable System: Both the margins should be zero or phase margin should be equal to the gain margin.
- For Unstable System: If any of them is negative or phase margin should be less than the gain margin.
b)
clear all; close all; clc

figure(1)
a = tf([1],[2 3 1])
bode(a)
[Gm,Pm,Gcw,Pcw]=margin(a)
if (Gm && Pm > 0) || (Pm > Gm)
    disp('The system is stable')
end

if (Gm && Pm == 0) || (Pm == Gm)
    disp('The system is marginally stable')
end

if (Pm < 0)||(Pm < Gm)
    disp('The system is unstable')
end

figure(2)
b = tf([1],[2 3 1 0])
bode(b)
[Gm,Pm,Gcw,Pcw]=margin(b)
if (Gm && Pm > 0) || (Pm > Gm)
    disp('The system is stable')
end

if (Gm && Pm == 0) || (Pm == Gm)
    disp('The system is marginally stable')
end

if (Pm < 0)||(Pm < Gm)
    disp('The system is unstable')
end

figure(3)
c = tf([10],[0.005 0.51 1 0])
bode(c)
[Gm,Pm,Gcw,Pcw]=margin(c)
if (Gm && Pm > 0) || (Pm > Gm)
    disp('The system is stable')
end

if (Gm && Pm == 0) || (Pm == Gm)
    disp('The system is marginally stable')
end

if (Pm < 0)||(Pm < Gm)
    disp('The system is unstable')
end

figure(4)
d = tf([15 75],[17 100 0 0])
bode(d)
[Gm,Pm,Gcw,Pcw]=margin(d)
if (Gm && Pm > 0) || (Pm > Gm)
    disp('The system is stable')
end

if (Gm && Pm == 0) || (Pm == Gm)
    disp('The system is marginally stable')
end

if (Pm < 0)||(Pm < Gm)
    disp('The system is unstable')
end