Basics of Probability and Statistics Week 1 Challenge
Q1: Why there is a difference in the formula of variance for population and sample ?
A1: Population Variance `sigma^2 = 1/Nsum(x_i - mu)^2`
Sample Variance `s^2 = 1/(N-1)sum(x_i - bar x)^2`
It can be observed that there is a small difference in the two formulas. When calculating population variance we divide by 'N' whereas when calculating sample variance we divide by 'N-1'. This is done to compensate our lack of information with respect to the population dataset. It is not possible to have a complete estimation of the population data, since it is time consuming and expensive. Hence we can say that the population dataset available is biased to a certain extent. Hence when calculating sample variance, in order to obtain an unbiased estimate of the population a correction factor called 'Bessel's correction' is applied, which is the act of dividing by n-1. As a result the variance determined from sample data will be higher than that of the variance derived from population data. This acts as an automatic shield for analysts and decision makers by providing a margin of safety.
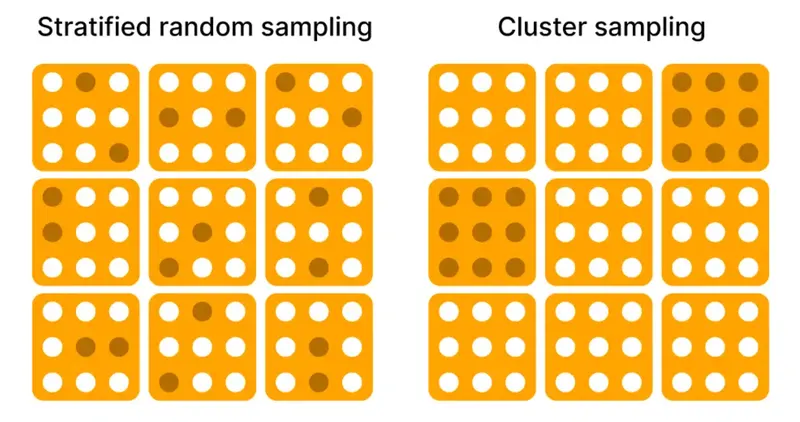
Q2: Difference between stratified and clustered sampling ?
A2:
| BASIS FOR COMPARISON | STRATIFIED SAMPLING | CLUSTER SAMPLING |
|---|---|---|
| Meaning | Stratified sampling is one, in which the population is divided into homogeneous segments, and then the sample is randomly taken from the segments. | Cluster sampling refers to a sampling method wherein the members of the population are selected at random, from naturally occurring groups called 'cluster'. |
| Sample | Randomly selected individuals are taken from all the strata. | All the individuals are taken from randomly selected clusters. |
| Selection of population elements | Individually | Collectively |
| Homogeneity | Within group | Between groups |
| Heterogeneity | Between groups | Within group |
| Bifurcation | Imposed by the researcher | Naturally occurring groups |
| Objective | To increase precision and representation. | To reduce cost and improve efficiency. |
Q3: How many different samples can be created out of population of size n ?
A3: Population size = N
Sample size = n
No. of different samples that can be created = `NC_n = (N!)/(n!(N-n)!)`
Q4: What is the probability of drawing 2 jacks from a pack of card ?
A4: A 52 card deck has 4 jacks.
Probability of drawing 1st jack = 4/52
Since the card is not replaced,
Probability of drawing 2nd jack = 3/51
Probability of consecutive events = (4/52).(3/51) = 1/221
Q5: What is the probability that both the numbers on dice are same while rolling 2 dice ?
A5: Sample Space n(S) = `6^2` = 36
Different instances with same number on both dice (E) = {(1,1),(2,2),(3,3),(4,4),(5,5),(6,6)}
n(E) = 6
Probability P(E) = n(E)/n(S) = 6/36 = 1/6
Q6: Why standard deviation when variance can measure the dispersion in data ?
A6: By computing the standard deviation ie. deriving the square root of variance, we bring back the quantity to its original units of measurement.