Basics of ML & AL Week 2 Challenge
Q1: Calculate all 4 business moments using pen and paper for the below data set?
A1: The excel sheet has been attached.
Q2: What is the significance of expected value when simple mean (Sum of all observations/number of observations) is already in place?
A2: Expected value is computed when the probability of occurence of all random variables in a sample is not similar ie. the weighted average of a probability distribution. Whereas mean is a special scenario of expected value in which the probability of occurence of all random variables is equal.
Expected Value = `sumX.P(X)`
Mean = `(sumX)/(N)`
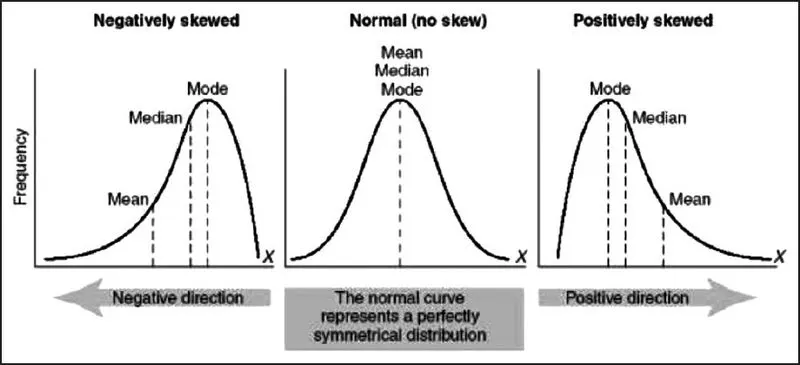
Q3: Having skewness in the curve considered to be bad in the analysis?
A3: Skewness refers to a distortion or asymmetry that deviates from the symmetrical bell curve, or normal distribution, in a set of data. If the curve is shifted to the left or to the right, it is said to be skewed. Skewness can be quantified as a representation of the extent to which a given distribution varies from a normal distribution. A normal distribution has a skew of zero.
Skewness doesn't necessarily indicate a good or bad trend, it only illustrates the deviation in the distribution of data from the normal distribution.
Q4: Evaluate the probabilities for continuous normal distribution with given mean = 680 and standard deviation = 31
a)P(X<711)
b)P(X>740)
c)P(600<X<720)
d)P(X=720)
A4:
a) P(X<711) = 0.8413
b) P(X>740) = 0.0287
c) P(600<X<720) = 0.8985
d) P(X=720) = 0
Q5: Explain the curve on the right side.
A5: The curve depicts a normal distribution, which is a continuous probability distribution that is symmetrical on both sides of the mean.The area under the normal distribution curve represents probability and the total area under the curve sums to one.
Most of the continuous data values in a normal distribution tend to cluster around the mean, and the further a value is from the mean, the less likely it is to occur. The tails are asymptotic, which means that they approach but never quite meet the horizon (i.e. x-axis).
For a perfect normal distribution the mean, median and mode will be the same value, visually represented by the peak of the curve ie. the center of the distribution.
From the curve it is seen that:
- ≈68% percent of the data falls within 1 standard deviation of the mean
- ≈95% percent of the data falls within 2 standard deviations of the mean
- ≈99.7% percent of the data falls within 3 standard deviations of the mean
The normal distribution is often called the bell curve because the graph of its probability density looks like a bell. It is also known as Gaussian distribution.
A normal distribution with a mean of 0 and a standard deviation of 1 is called a standard normal distribution.