Simulations and Analysis of Vehicle Side impact test (FMVSS214) in Radioss
Simulations and Analysis of Vehicle Side impact test (FMVSS214) in Radioss

Various Crash Test
A crash test is a form of destructive testing usually performed in order to ensure safe design standards in crashworthiness and crash compatibility for various types of vehicle like small, medium and heavy duty and its related systems and components for the sake of getting the performance of the vehicle under the different conditions of crash at different angles with taking certain object like rigid wall, cables specially three-strand cable, concrete barriers, guardrail systems etc. It will be performed either by numerical simulations or experimentally. Figure below depicts different types of crash test generally used.
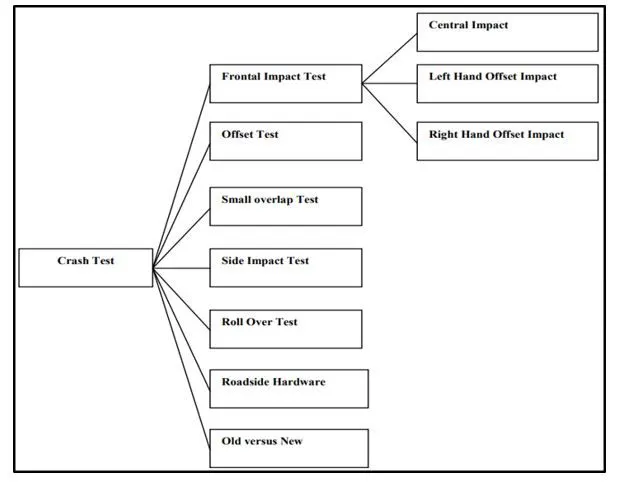
• Frontal Impact test- In this test a fully front structure of the vehicle collides with another object like another vehicle, rigid wall etc. at a given speed.
• Offset Test- In this test only a part of front portion of the vehicle strikes on some barrier usually a vehicle at a given speed.
• Small Overlap Test- In this only a small portions of the vehicle strikes an object like tree, pole or if a car were to clip another. This situation loads a maximum value of force into the vehicle structure at a particular given speed. This test usually comprises of 15% to 20% of the front structure.
• Side Impact Test- In this test sometimes the vehicle is in static condition or in dynamic and another vehicle or an object collide at the side surface having some speed.
• Roll-Over Test- In this test a vehicle is in rollover condition having certain angle by which they tests ability (specifically the pillars holding the roof) to support itself in a dynamic impact. It is also done for the static crash testing condition.
• Roadside Hardware- These are performed to ensure that the crash barriers and crash cushions will protect vehicle occupants from roadside hazards.
• Old Versus New- In this an impact is done between old car against a new car and the big car against a small car; it is performed to show the advancements in crashworthiness.
Crash tests are conducted under rigorous scintific and safety standards. Each crash test is very expensive so the maximum amount of data must be extracted from each test. Usually, this requires the use of high-speed data-acquisition, at least one traixial accelerometer and a crash test dummy, but often includes more.Crash test is much important which helps in minimizing the losses such as deaths,injuries and prioperty damages from the vehicle crashes on the roads.
In this Project we have performing the Frontal crash of the vehicle.Frontal impacts are the impacts undertaken against the solid barrier with precise speed.Test reequire3s only front portion of the vehicle to impact the barrier.
In the New Car Assessment Program (NCAP), passenger vehicles are crashed at 35 mph into a rigid barrier that covers the full width of the vehicle. The Institute runs offset frontal tests instead of full- width frontal tests. In an offset crash only one side of a vehicle's front end, not the full width, hits the barrier.
During a car crash, energy is transferred from the vehicle to whatever it hits, be it another vehicle or a stationary object. This transfer of energy, depending on variables that alter states of motion, can cause injuries and damage cars and property. The object that was struck will either absorb the energy thrust upon it or possibly transfer that energy back to the vehicle that struck it. Focusing on the distinction between force and energy can help explain the physics involved.
Software used for Crash Analysis:
• LS-DYNA
• PAMCRASH
• RADIOSS
• MSC.DYTRAN
• MADYMO
• ABAQUS
• ANSYS
Implicit and Explicit Philosophy
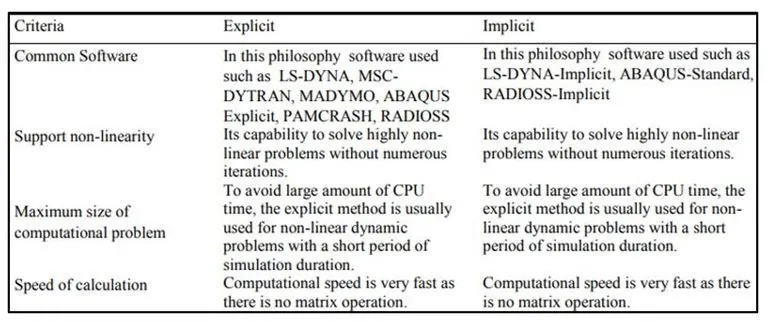
Most software’s would normally solve the dynamic equilibrium equation in an implicit approach however the foremost widespread approach that ought to be used for highly non-linear issues is to use explicit(specific) time integration scheme like a central difference scheme. There are several benefits of such a procedure and therefore the most significant is that it results in an algorithmic programmed which may be simplified programmed, does not need any matrix operation procedure and more is very appropriate for a quick parallel computing methodology.In the the below Table shows the common difference between the implicit and explicit philosophy.
Procedure:
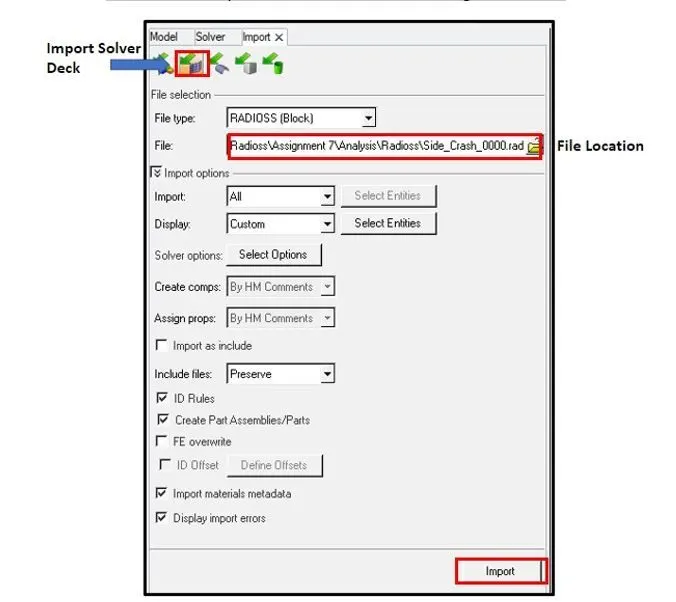
- Import the given Model into Hypermesh
- Go to Import Command which is in Tool

- Go to Solver deck and Select the File
- Click on the Import button as shown in the figure
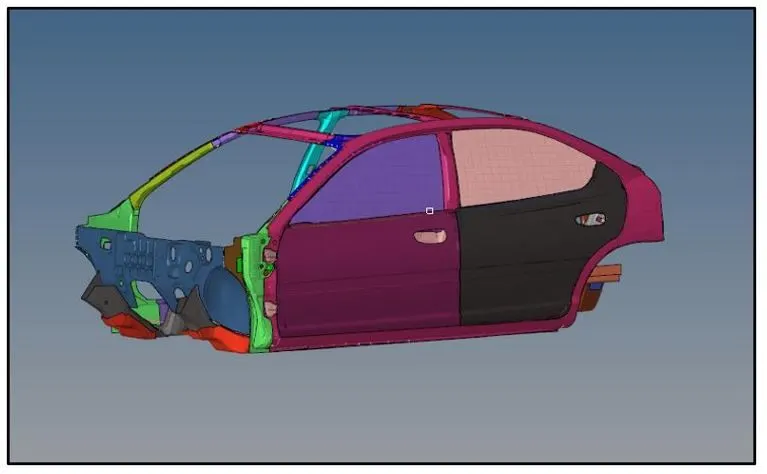
- Model will be displayed in the hypermesh Graphics area ashown below:
Case Setup and Execution:
1) Check unit system and either follow[Mg mm s] or [Kg mm ms].
• Open the Starter file Neon_Front_0000.rad in the Note pad and Check the Unit System followed.
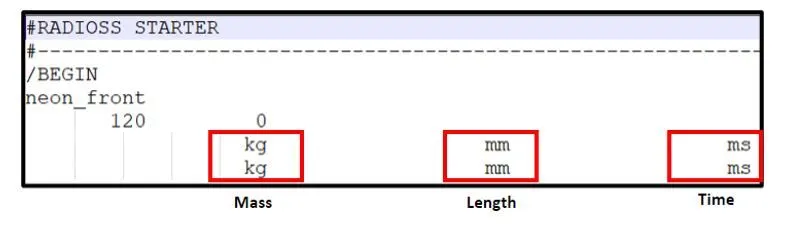
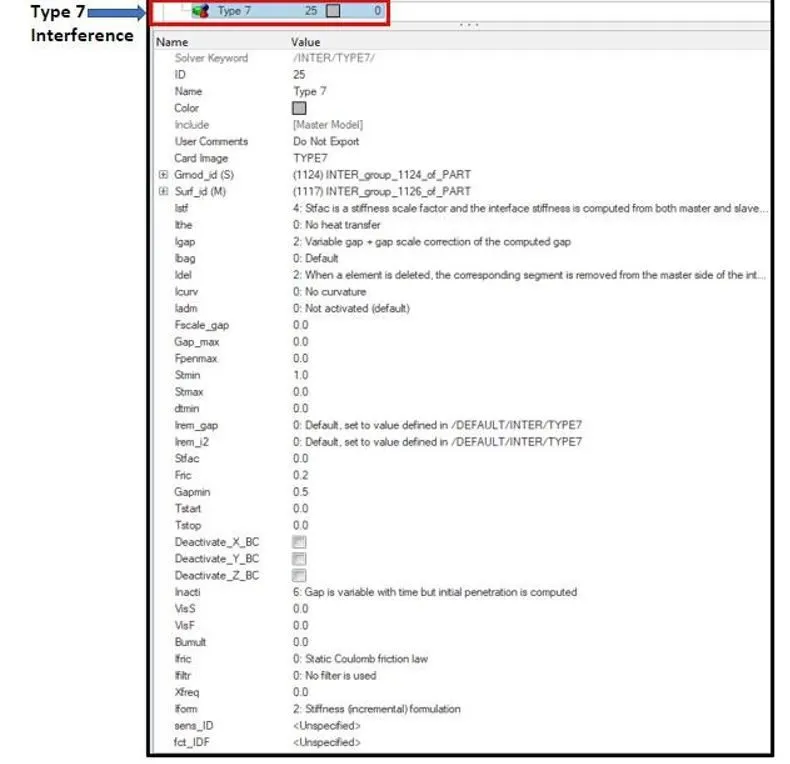
2) Create appropriate interface ,friction 0.2 and recommended.
In this case,Type 7 Contact Interface is defined.Interface TYPE7 is a multi-usage impact interface, modeling contact between a master surface and a group of slave nodes. It is also possible to consider heat transfer and heat friction.
All limitations that were encountered with interfaces TYPE3, TYPE4 and TYPE5 are solved with this interface:
- A node can at the same time be a slave and a master
- Each slave node can impact each master segment; except if it is connected to this
- A node can impact on more than one
- A node can impact on the two sides, on the edges and on the corners of each
- It is a fast search algorithm without The main limitations of this interface are:
- Time step is reduced in case of high impact speed or contacts with small
- It does not work properly if used with a rigid body at high impact speed or rigid body with small
Defined Properties are shown below:
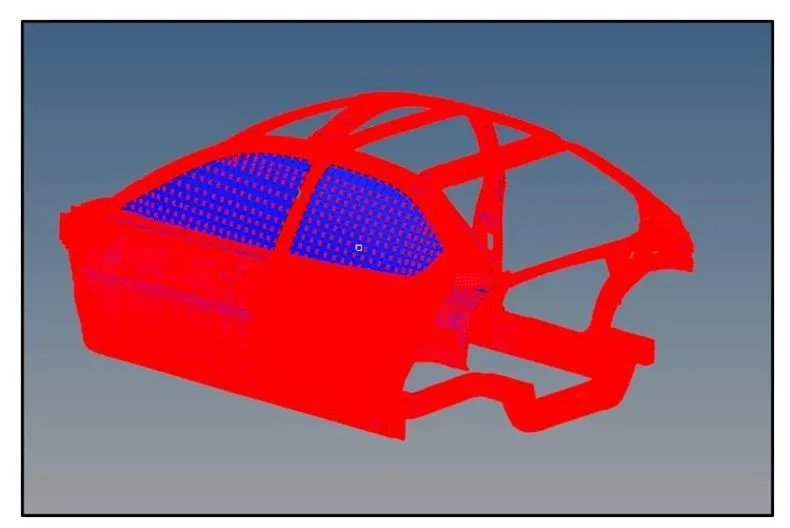
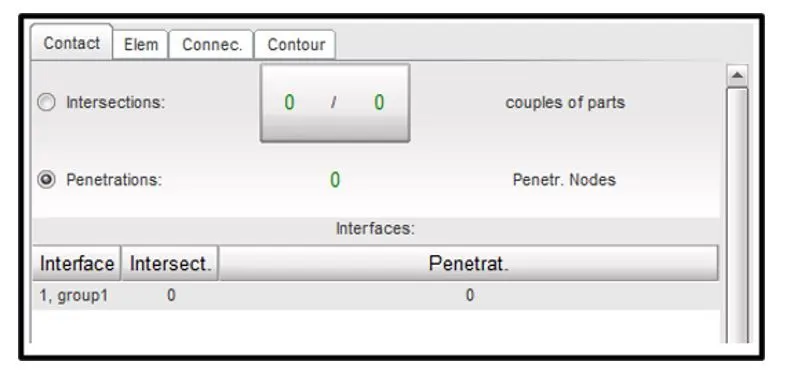
3) Make Sure No Intersection and Penetration in the Model
Before Going to run the Simulation always we should make sure that there is No intersection or penetration in the model.If there is any penetration then we can remove it by using the tools provided in the Hypermesh or hypercrash.Since in this Model we dont have any Intersection and penetration we take takethe model to the further process.
4) Create rigid wall with friction 0.1.
Rigid wall entities provide a method for treating a contact between a rigid surface and nodal points of a deformable body. In the LS-DYNA and Radioss user profiles, rigid walls can be created in the Model and Solver browsers.
There are four types of rigid walls available in Radioss:
1. Infinite Plane
2. Infinite Cylinder with Diameter D
3. Sphere with Diameter D
4. Parallelogram
Each wall can be fixed or moving.
A kinematic condition is applied on each impacted slave node. Therefore, a slave node cannot have another kinematic condition; unless these conditions are applied in orthogonal directions.
In this we have used the infinite plane rigid walls.
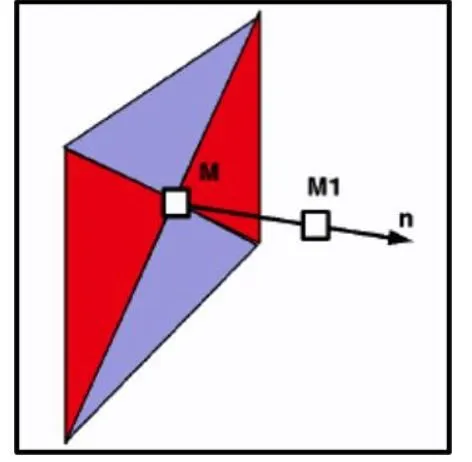
A Rigid wall is a pure kinematic option on all impacted slave nodes. It is defined using two points, M and M1. These define the normal, as shown in figure below:
Now let us create the Rigid wall for the given Model
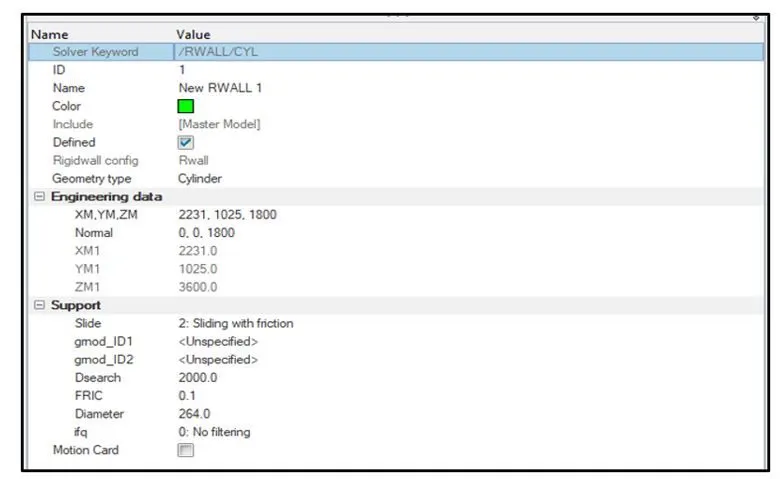
In this model we are creating the rigid wall with friction of 0.1 and Search Distance of 2000.
- Go to Solver Browser>Right Click>Create>RWALL
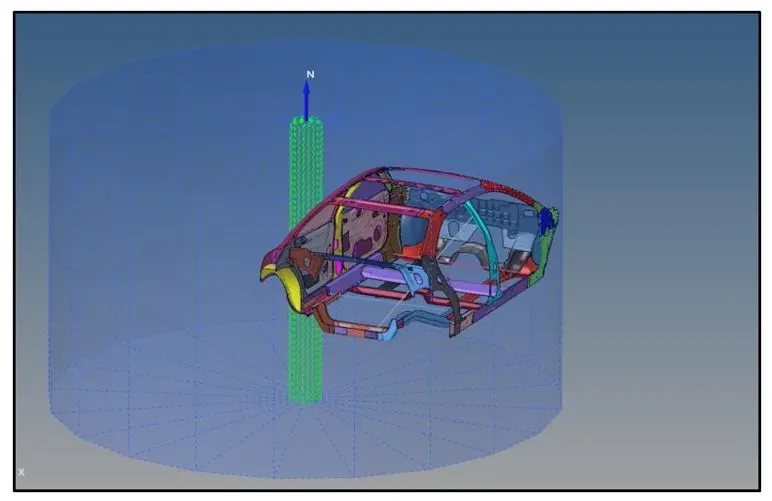
- Select the Type of rigid In this we have taken Cylindrical Rigid wall as we are simulating the vehicle for pole crash.
- Enter the Coordinate of Nodes(M) where rigid wall to be
- Define the Node group defining slave nodes to be added to the rigid wall(grnd_ID1).
- Define the distance for slave search(D_search).
- Define the friction coefficiant as 0.1(Input data)
- The Rigid wall will be created as shown in picture below:
5) Compare the model weight with the full scale 300k nodes model and use added masses to reach target weight 700kg while getting CG about the required range.
To find the Initial COG of the Component,
• Import the model into hypercrash.
• Go to Mass>Balancing
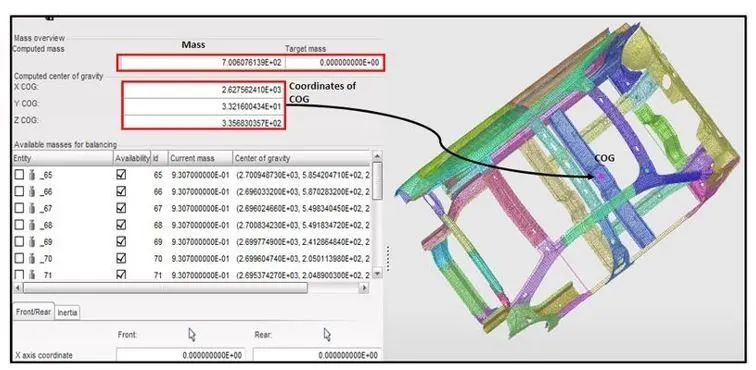
• Total Weight of the given model is aaprx 166kg and the COG is situated at the place near to the Cross member as shown in the figure below:
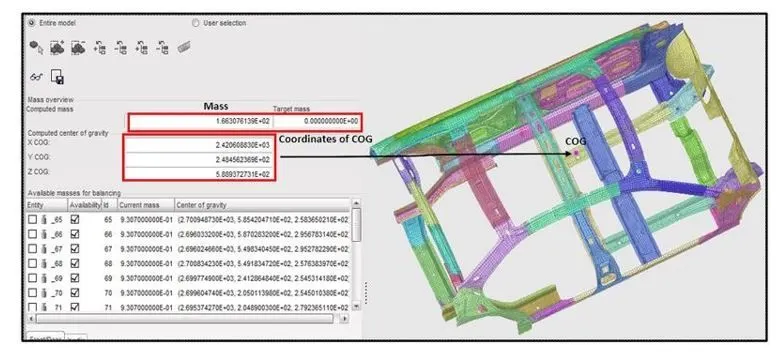
As per Full Scale Model the total weight of the component is 700kg and COG is near to the Cross Beam.In order to place the COG near to the Cross Beam ,we need to add the Mass and Balance the Component.
- Go to Load case>Added
- Add Mass to the Suitable Component on the Floor Panel.For Eg:Give the Weight of 130kg near to the Driver Seat(Weight of the Seat is 50kg and average weight of the Passenger is 80kg)
- Hence the Balanced Component with weight of 700kgs is shown below:
6) Initial velocity 35 mph.
Initial Velocity is the velocity at time interval t = 0 and it is represented by u. It is the velocity at which the motion starts.
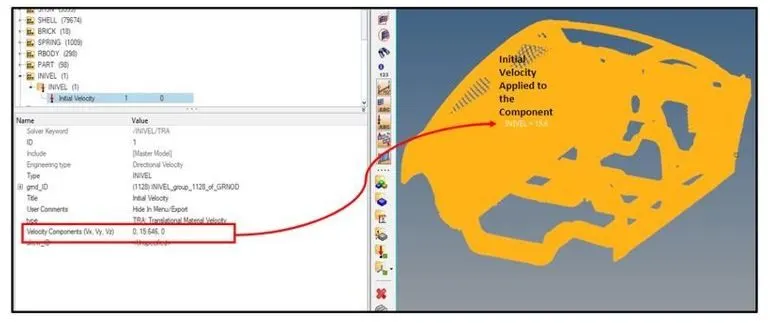
So in order to perform the crash test we need to input the Initial Velocity for the car which in 35mph
equivalant to 15.64mm/ms in the direction where the vehicle is going to hit the Rigid wall.
• Initial velocity can be added both in Hypermesh and Hyper crash
• in hypermesh,Go to Solver Browser>Right Click>Create>INIVEL.
• In this we can initialize both translational and rotational velocities on a group of nodes in a given coordinate system.
• Define the Node group on which specified initial velocities are applied(grnd_ID1).
• Define the Type of Velocity (Translational /Rotational).
• Since we need to apply the velocity in translational X Direction,define the velocity (15.646mm/ms) in `V underset x`.
• Thus the Initial Velocity is applied as shown in the Figure below
7) Creation of Sections at A Piller,B Piller ,Shot Gun,rails and the Bumper in order to Study the sectional forces.
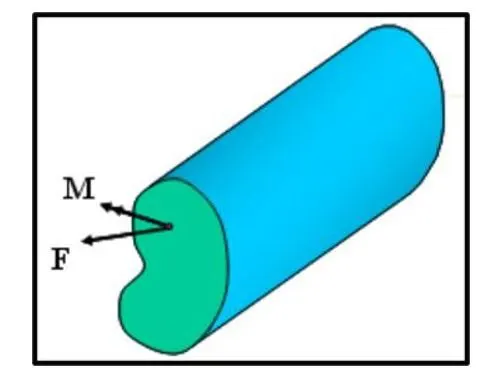
A section is a cut in the structure, where forces, moments or energy will be computed and stored in output files (using /TH/SECTIO).
Generally, to define the section, the following points are required:
• A cutting plane.
• A reference point to compute forces.
• A direction of the section.
- To Create the Sections at perticular area,create the FRAME over there. Frames are used to define local directions.These directions can be used to apply:
- Boundary conditions
- Concentrated load
- Fixed velocity
It is a mobile or fixed reference. The quantities are computed with respect to the origin of the frame which may be in motion or not depending on the kind of reference frame. For a moving reference frame, the position and the orientation of the reference vary in time during the motion. The origin of the frame defined by a node position is tied to the node.Frame is used to measure the relative Motions.
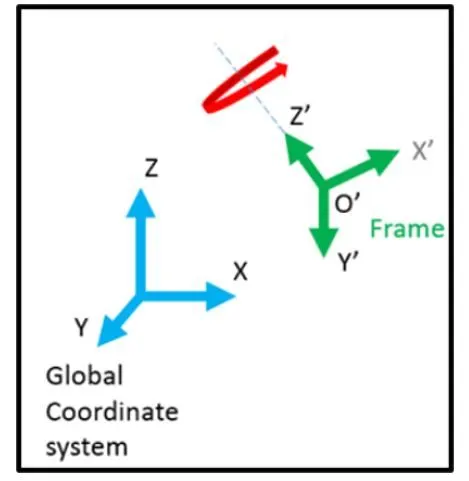
- To Create the Frame,Go to Solver Browser>Right Click>Create>FRAME.
- Define the Nodes as the Axis of the Frame
- Thus the frame is Created as shown below:
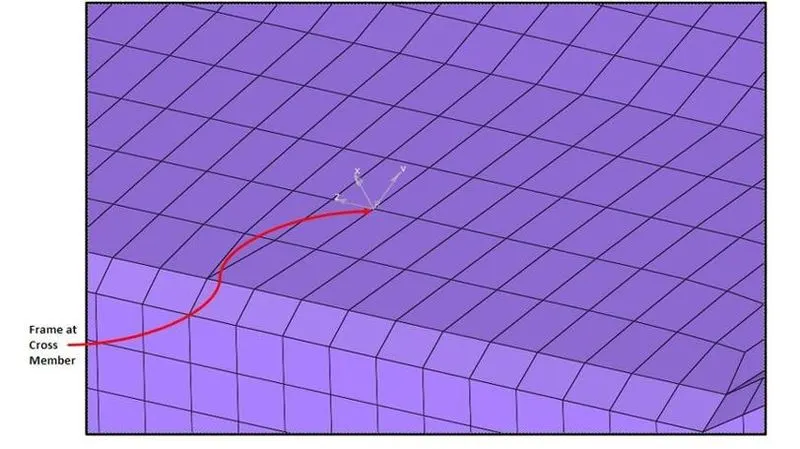
Once the frame is created ,We need to create the Section at the Areas.
- To Create the Frame,Go to Solver Browser>Right Click>Create>SECTIO.
- Define the Nodes with reference to the Axis of the
- Define Delta T and Alpha Value as 0.1 and 1.67
- Define the cutting plane by a group of elements and its orientation by a group of nodes(grshell_ID)
- Thus the Selection has been Created at A Piller LH Side as shown below:
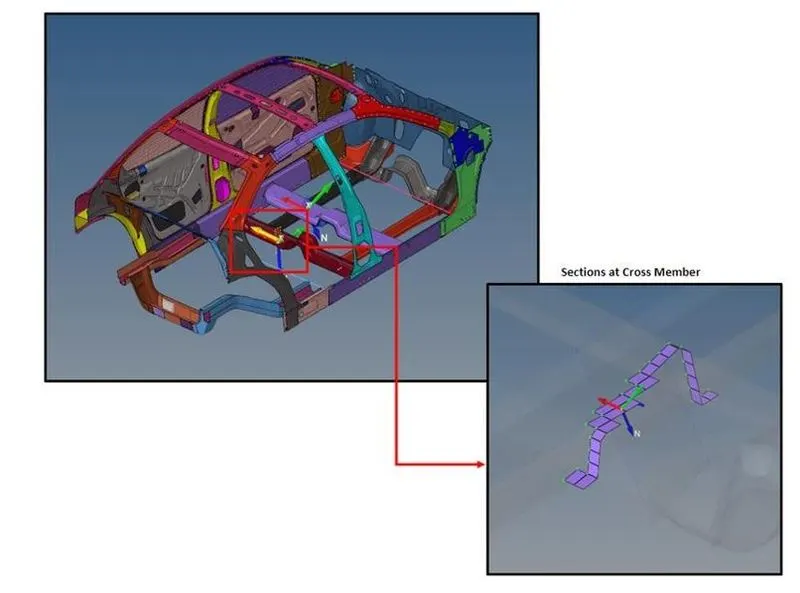
8) Intrusion at B pillar,hinge pillar and fuel tank region.Provide recommendation on what can help to reduce Fuel tank intrusion.
In order to Check the Intrusion at the given Nodes,We have create the Spring at the place and applied Spring Properties and requested output in the TH File.
• To Create the Spring,Go to 1D>Springs>Select the Nodes where the spring is to be created.
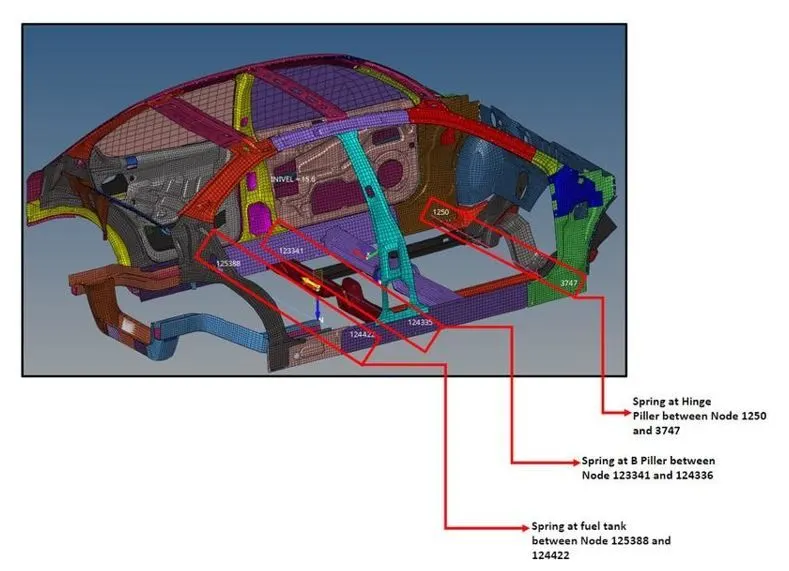
9) Peak velocity of inner node of the door.
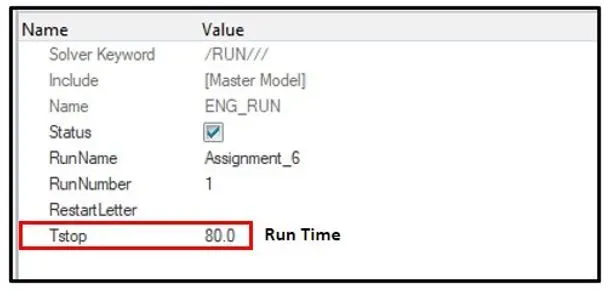
10) Check Model cards and change Time-step 0.5 to 0.1 microseconds and Run time 80ms
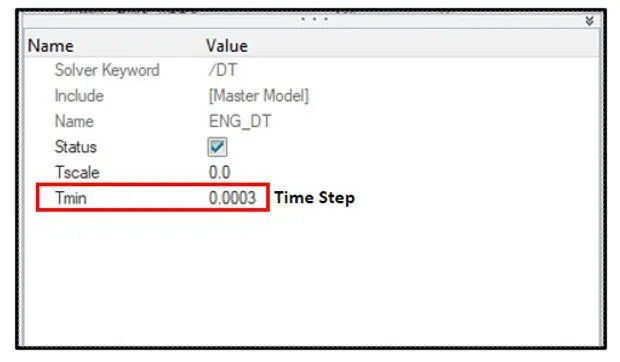
- Creation of Output request
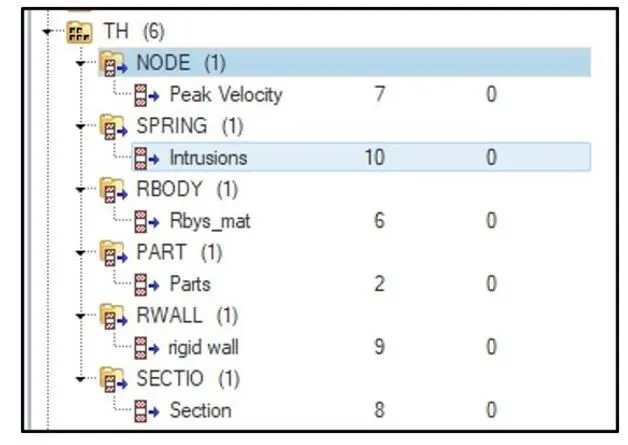
Once al the Deck setup is done ,we need to create the output request in TH.
- To Ask for output request,Go to Solver Browser>TH>Select the output we
- Select the Entity for wich the utput is
- Thus the time history file has been setup as shown in the figure below:
11) Use model checker to ensure good quality.
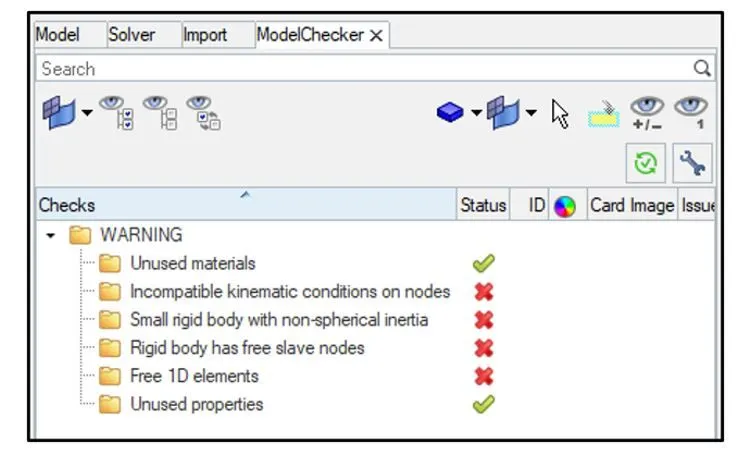
In order to run the simulation smoothly we need to check the model if there is any errors.On Checking the Model Checker we will come to know if any errors is there in the Model and we have to debug the issue.
• Model checker to exercises hundreds of unique checks, tracks model robustness for crash worthiness criteria, allows user-defined criteria checks
• Clean and simplify the model
• Check connectivity to identify unconnected parts, failed connection, for failed welds
• Check and automatically correct initial intersection/penetration
12) Running Simulation
Now all the required output requests and engine control cards are provided. The file can now be exported into RADIOSS file type. The model file or deck file will be saved as xxxx_0000.rad, which is also called as starter file. If the merge starter
and engine file option is not checked a separate file xxxx_0001.rad will be created which is the engine file which contains the engine controls and output requests created.
RADIOSS solver is launched and the deck file is uploaded for running the simulation. Starter out file will be generated (xxxx_0000.out) which gives the summary of the FE model created (property, materials, parts, contacts, time step...) and summary of load cases in the form of warnings and/or error messages. Once the FE model runs fine, the engine file will run according to control card parameters. The engine file will also create an engine out (xxxx_0001.out) file. The engine out file gives the cycle summary and termination notification. The user should continuously monitor the time step in the engine out file. Check for the abnormal changes in time step.
Tips for monitoring time step drop:
1) For an element, check the related material and there must not be an error in the units. Also check the element size.
2) For a node, check the characteristics of connected elements.
3) For an interface, the gap of the interface must be verified if some failure happens on the master or the slave side of the interface.
Engine out file provides energy error which user can monitor.
Post-Processing of Results:
Altair HyperView is a complete post-processing and visualization environment for finite element analysis, CFD and multi-body system data. HyperView enables you to visualize data interactively as well as capture and standardize your postprocessing activities using process automation features.
HyperView is opened and Side_Crash_0000.h3d file is loaded.
The contour panel is opened where it allows the user to create contour plots of a model and graphically visualize the analysis results. The requested results can be selected from the Result Type.
1) Energy Error and Mass Error
• Open the 0001.Out File in Notepad
Tips for monitoring energy error:
1) Must be negative and decreasing. 2)For good models, less than 5%.
3)May increase in the first few cycles and then decrease.
If energy error is more and increasing, user can check the model for incompatible kinematic conditions.
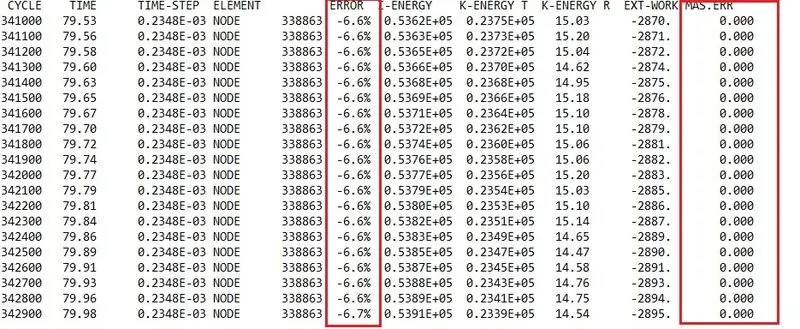
From the Above Image we can see that the maximum Energy error is -6.7% (-ve Energy) and Mass Error is 0.00 which is Accepted and the total number of cycles is 342900.
Negative energy is seen when energy is dissipated from system. There could be lot of reasons for the same, it could be because of damping or hour glass, etc.
2) Von Mises Stress
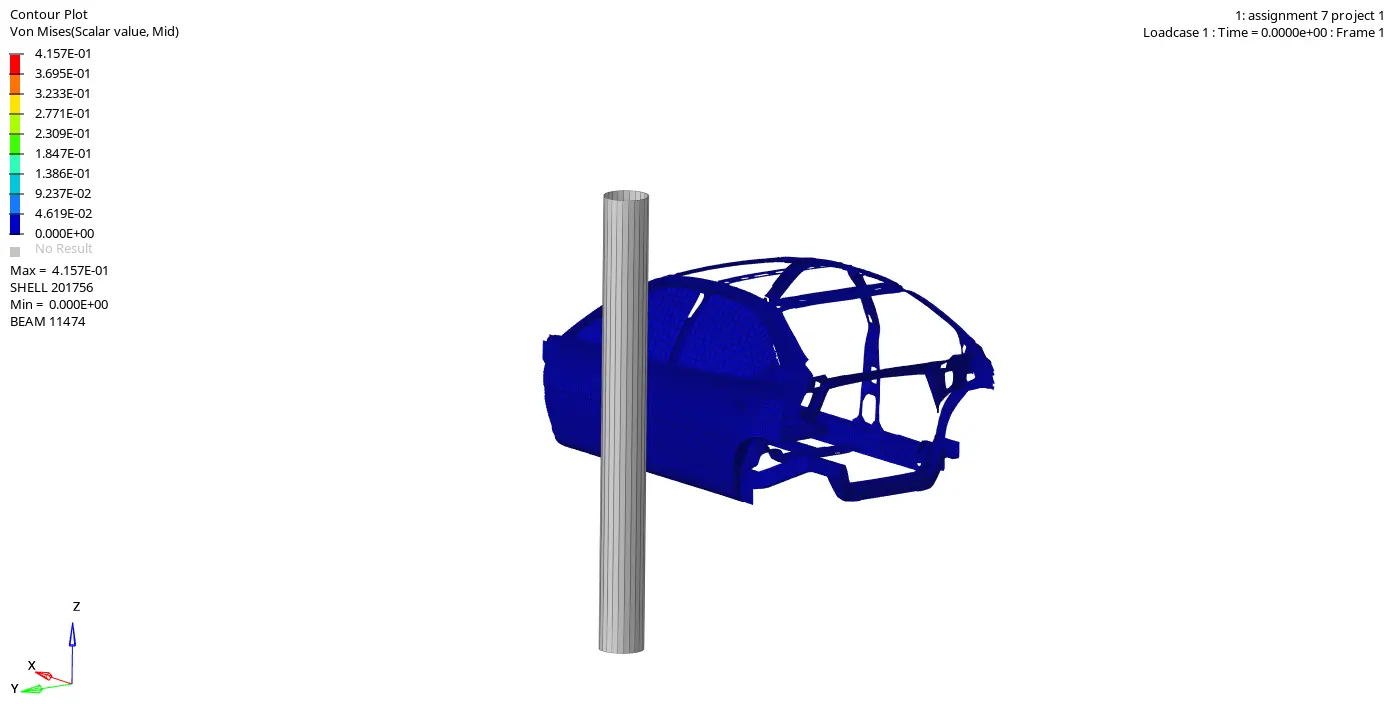
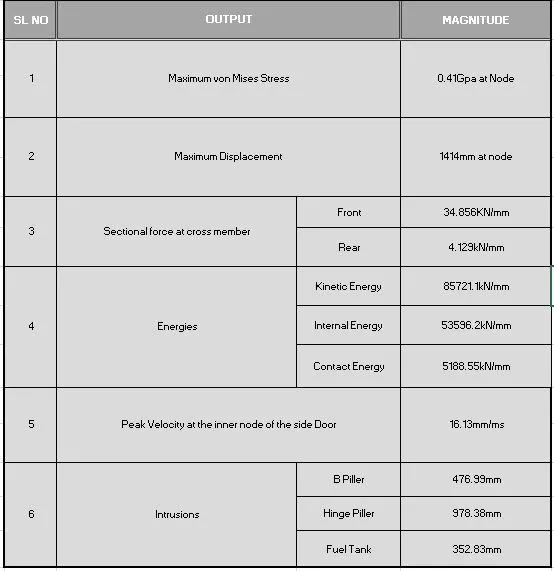
Maximum Von Mises Stress occured is 0.41Gpa at Node .From the above Animation we can see that once the car hits the Rigid pole,the maximum stress is flowing from the door region and transmited further through Cross members.
3) Displacement
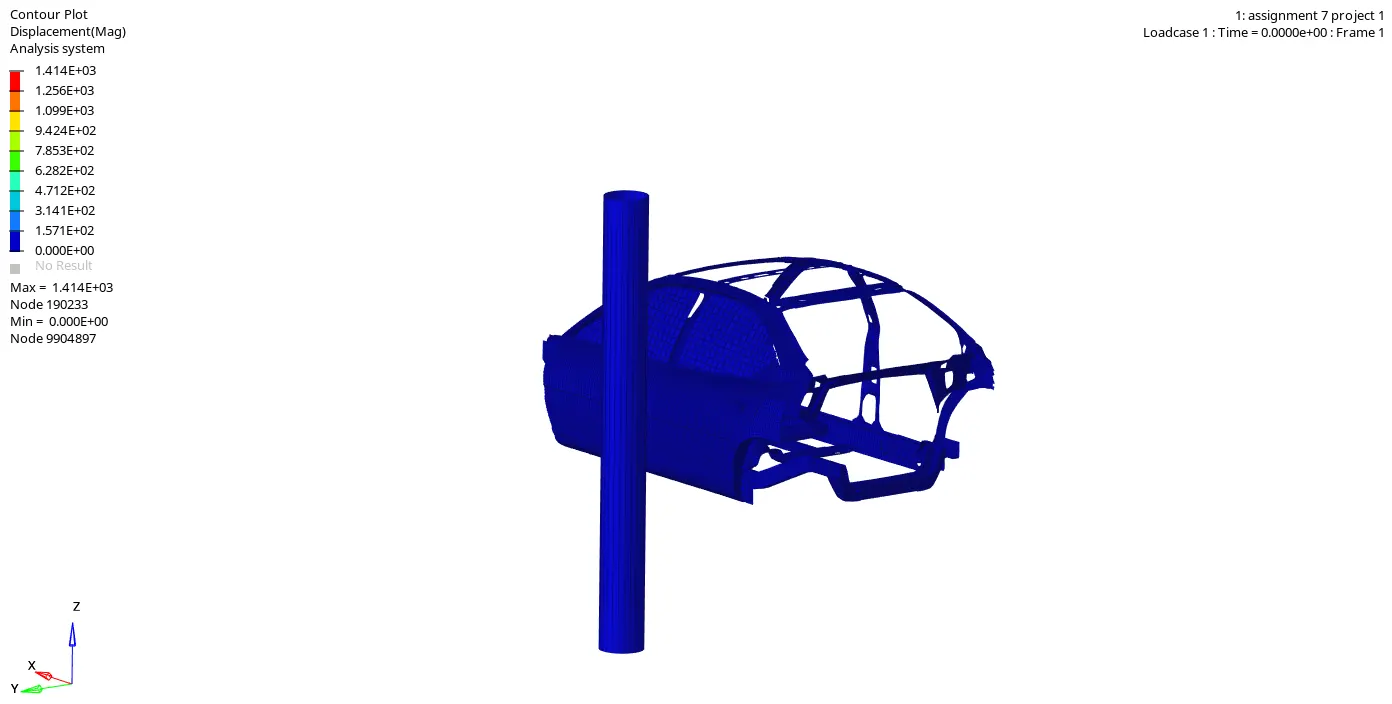
The Maximum displacement occured is 1414mm at node.
4)Energy Plots
• Internal Energy and Kinitic Energy
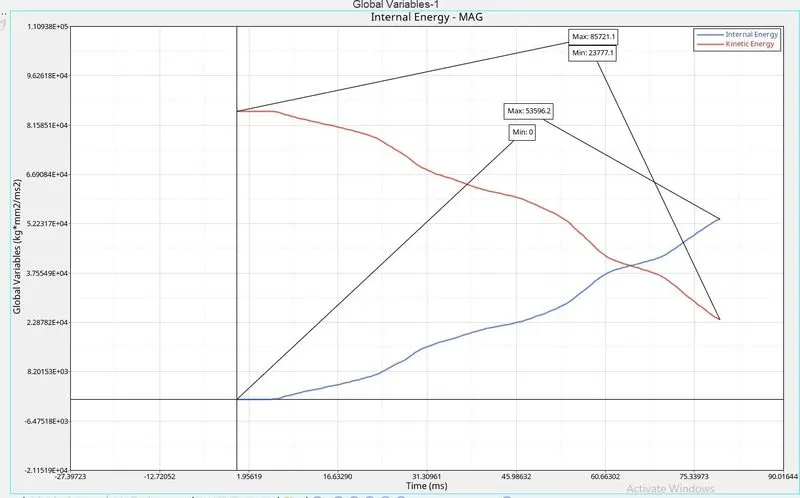
Internal Energy and Kinitic Energy vs time
Now we will observe the energy graph. Global energy variables for the total energy, kinetic energy, internal energy and hourglass energy has been plotted for the simulation. The above energy graph reflects the change of the energy during the crash. The maximal kinetic energy of the system is 85721.1kN/mm at t=0. It descends sharply with the process of the impact. At the same time, due to the distortion of the vehicle, which is absorbing the energy, the internal energy ascends sharply. Up to the end of the impact, 90% of the kinetic energy has been transformed to the internal energy of the distorted component.At the Maximum deformation,the Velocity will become Zero and thus the kinetic Energy will also be droping down that means there is no energy to absorb in the system.Thus the Internal Energy Remains Constant thereafter.
Once after the simulation,The maximun kinitic Energy is found at 85721.1kN/mm at t=0 and the maximun internal Energy is at 53596.2kN/mm at t=79.5ms.
• Contact Energy and Hourglass Energy
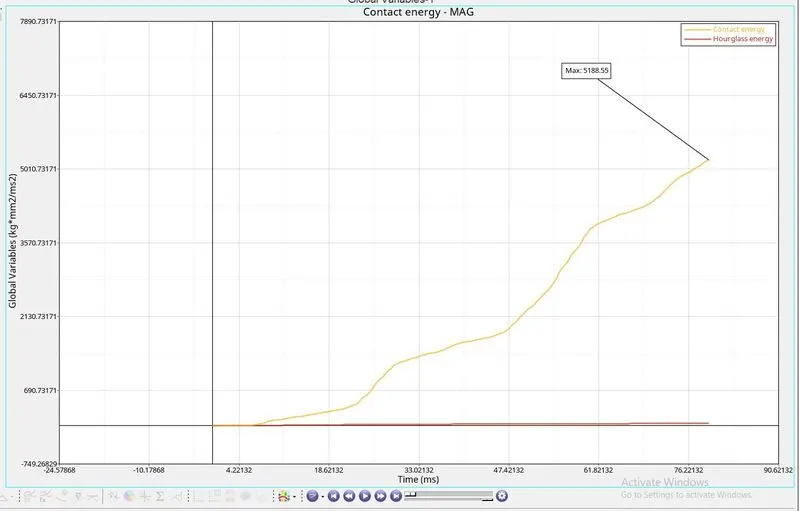
From the above graph we can see that the Hourglass energy is almost negligible since we have used Improved integrated element formulation(QEPH).From the Graph the hourglass energy is at 0 and constant throughout the simulation.
Contact Energy is nothing but the opposite energy generated from the System to Avoild the Penetration.To avoid the penetration we have determine the `Gap underset min` value to 0.5.When the car is moving with velocity of 35mph and hits the rigid pole,it starts deformation at the door section and coming in contact with the cross member as evident from the Animation, hence the penetration of the elements occurs and thus the opposite reaction force also exerted in order to avoid the penetration.Hence the contact energy increasing gradually from zero.The maximum Contact energy found is 5188.55kN/mm at t=79.5ms.
Horglass enrgy is found negligible from the above graph due to the QEPH Element formulations.Ideally,hourglass energy should not exceed 10% of internal energy and the same is also satisfied in this simulation.
5)Sectional Force
Sectional Force at Front Cross member
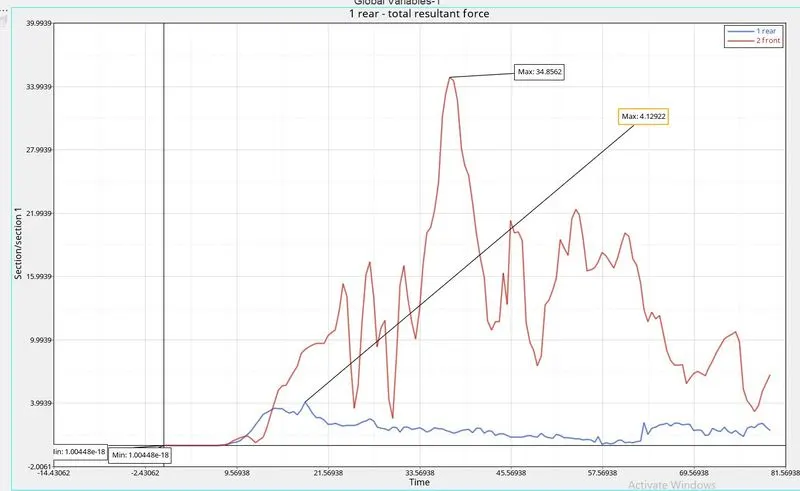
The maximum cross sectional force at Cross Member FR is 4.12kN/mm at t=20ms whereas The maximum cross sectional force at Cross Member RR is 34.85kN/mm at t=35ms.One the Car hits the rigid pole,the deformation starts at the door section and the force is propogating from door to the rest of the car through B Piller and Cross Beam.From the animation and the graph we can say that the force received at Both the section is not different.There is a variation int the amout of force receiving at the section with respect to time might be because of vibration during the crash.Both the sections are undergoing compression force.Once it reaches the maximume compressive force,the Door will push the cross member anfd thus cross member tending to start bending.Due to the bending of the cross member ,the force propogation through the section is decreases and the same we can see force is decrease in the section in the above plot.
6) Intrusion at B pillar,hinge pillar and fuel tank region.Provide recommendation on what can help to reduce Fuel tank intrusion.
To check the Intrusion at dash wall at the perticulaer given node,we have created the spring over the place.Intrusion at this perticuler node is calculated nn order to check weather the crash will result in the safety of the passenger due to the deformation occured at the side portion of the vehicle.
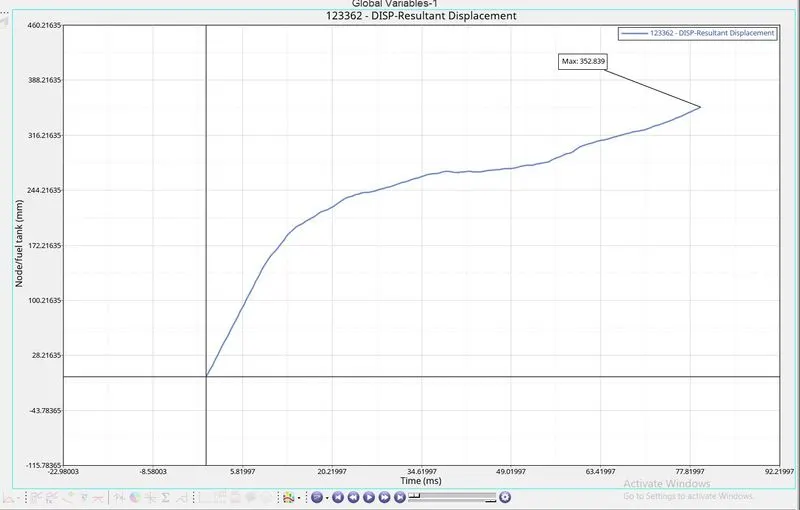
Intrusion at Fuel tank Vs Time
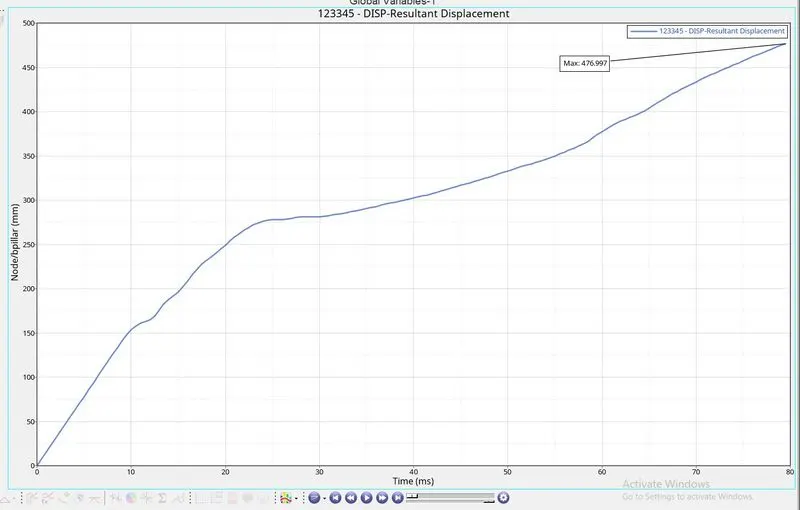
Intrusion at B Piller Vs Time
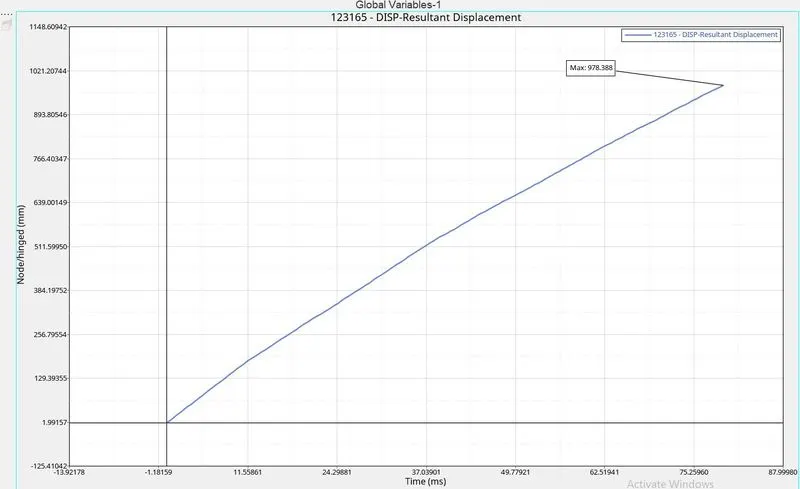
Intrusion at hindge Vs Time
From the above graph we can see that the
• Maximum intrusion occured in the Fuel tank(Node 125388,124422) during crash is 352.83mm.
• Maximum intrusion occured at the B piller (Node 123341,124335) during crash is 476.99mm.
• Maximum intrusion occured at the Hinge Piller (Node 1250,3747) during crash is 978.38 mm.
Practically this intrusion refered to which extent the passenger will get hurt when the Car hits the pole from the side.From all the above plots the Energy is going negetive which indicates that the deformation is towards the inside of the car.
Since due to the Node limitation in the software,we dont have full scale model and many missed components like rear axle,Fuel tank etc.But in real condition ,the rear axle,wheels and the fueltank gives the much more stiffness to the car and this might help to reduce the intrusion in a good manner.To reduce the intrusion in this model we can add one cross member near to the Fuel tank region.
7) Peak velocity of inner node of the door.
As we all know that the car hits the pole,1st impact will be the door and due to the deformation the inner portion of the door might hit the passengers incide the car and lead to the injuries.Hence it is important that the Peak velocity at the door region is to be calculated.
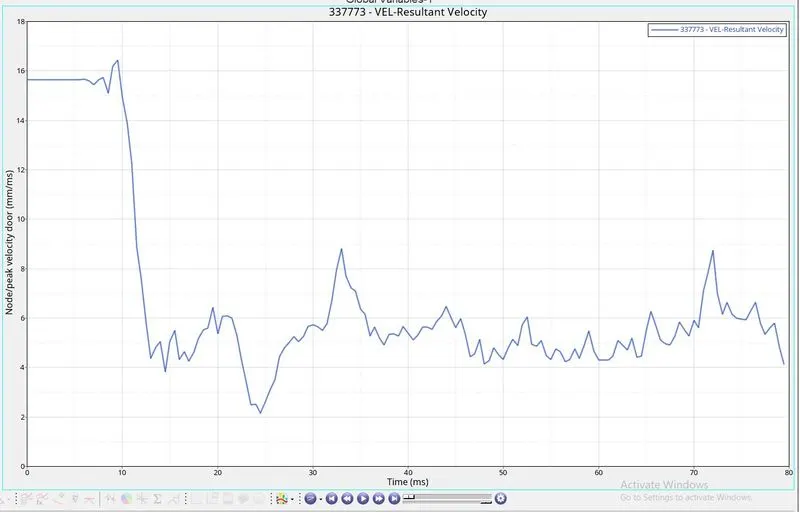
From the Graph ,the peak velocity of the node on the door is 9.1mm/ms.As seen from the graph there is fluctuations in the shock waves this is because of vibration occured during the crash of the vehicle.
Results:
Consclusion:
In the present work, Finite element modelling practices used for crash analysis are studied and after effects of the different parameters on the vehicle have been reviewed.The aim of this work is to study the effects of such crash.
parameters on the dynamic response of automobile component through finite element approach path.These analyses mainly focus on software selected, crash type, vehicle/components considered for crashing, material used, type of element used, boundary conditions adopted tool used for post processing the results etc.
Thus the Given Neon Dodge Car side pole crash test has been Analised under the given Condition,Applied boundry Condition, and Studied the behaviour of Propogation of forces from one component to another.The total deformation of the car structure is analyzed. From this model we can conclude that the Contact interface and penetration plays a vital role in the crash test.Even a single mistake results in the variation in time step and also high contact energy.Also the center of gravity (COG) of the car is important to determine the dynamic performance as all the forces and moments are acting at the COG. The stability of the vehicle depends on the road conditions and driving maneuvers.Hence the Mass Balancing also plays a improtant role in the crash test and also safety of the passenger is the Main aim of the crash test.
In the future scope, different car body structures can be modelled and different car body materials can be taken by assigning different velocities for crash analysis.