Frontal crash analysis of a Neon car model as per the required parameter values and settings using HyperMesh and Radioss
Project Report
Frontal crash analysis of a Neon model as per the required parameter values and settings using HyperMesh and Radioss
Objective:
To do the Frontal crash analysis of the given Neon model, requesting required outputs and assigning appropriate parameters as asked.
Theory:
A crash simulation is a virtual recreation of a destructive crash test of a car or a highway guard rail system using a computer simulation in order to examine the level of safety of the car and its occupants. Crash simulations are used by automakers during computer-aided engineering (CAE) analysis for crashworthiness in the computer-aided design (CAD) process of modelling new cars. During a crash simulation, the kinetic energy, or energy of motion, that a vehicle has before the impact is transformed into deformation energy, mostly by plastic deformation (plasticity) of the car body material (Body in White), at the end of the impact.
Data obtained from a crash simulation indicate the capability of the car body or guard rail structure to protect the vehicle occupants during a collision (and also pedestrians hit by a car) against injury. Important results are the deformations (for example, steering wheel intrusions) of the occupant space (driver, passengers) and the decelerations (for example, head acceleration) felt by them, which must fall below threshold values fixed in legal car safety regulations. To model real crash tests, today's crash simulations include virtual models of crash test dummies and of passive safety devices (seat belts, airbags, shock absorbing dashboards, etc.). Guide rail tests evaluate vehicle deceleration and rollover potential, as well as penetration of the barrier by vehicles.
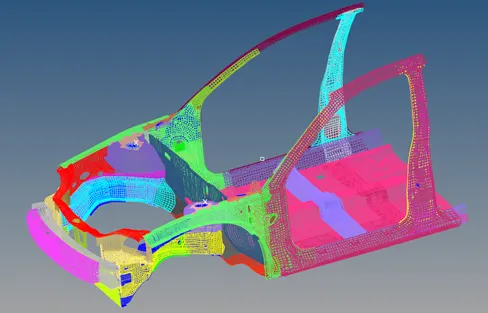
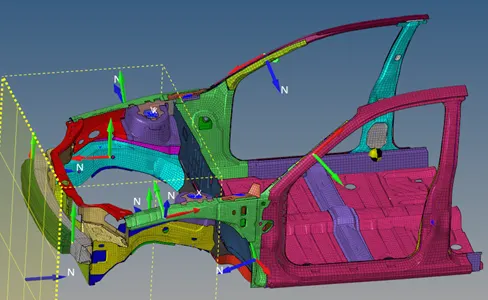
Given model:
The front section of the car was taken because of the limitations of the student version of the software but the balancing was done appropriately so the the condtions obtained were as good as that of a fill model.
Unit system:
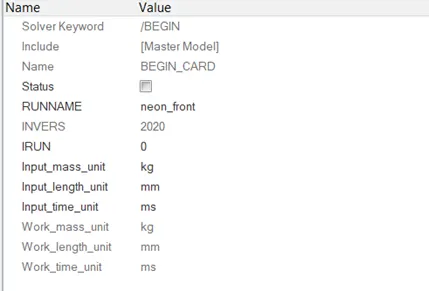
Open the file neon_front_0000.rad. We can check that unit system is kg, mm, ms either from the notepad file or from the Benign card as the following image shows.
Penetrations check:
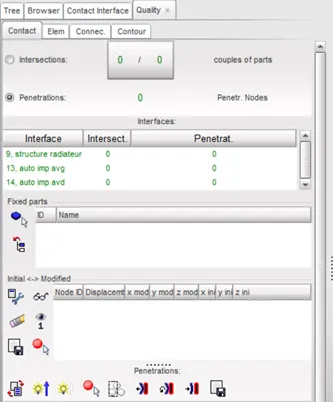
There should not be any initial penetration. This gives rise to a simulation with sliding energy present at the initial conditions which is physically wrong and hence it should be strictly seen that the penetration check is applied through the pre-processor.
HyperCrash was used for the penetration check. To check it select all interfaces in the browser tab and run click check penetration for selected objects. As a result we got the following results as in the figure below. It can be seen that there were no initial penetrations present which was a good sign.
Runtime:
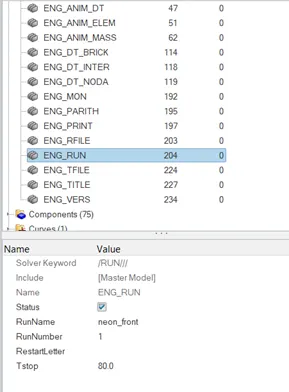
To set runtime to 80ms, Go to cards and then select ENG_RUN and enter the required value in Tstop.
Definition of Initial Velocity:
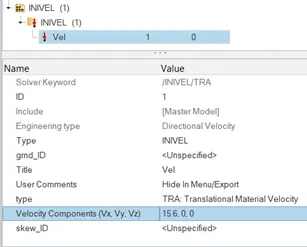
The initial velocity is 35 mph=15.6464 mm/ms.
To give initial velocity ,create -> boundary conditions -> INIVEL
Then the value in Vx is entered as shown below:
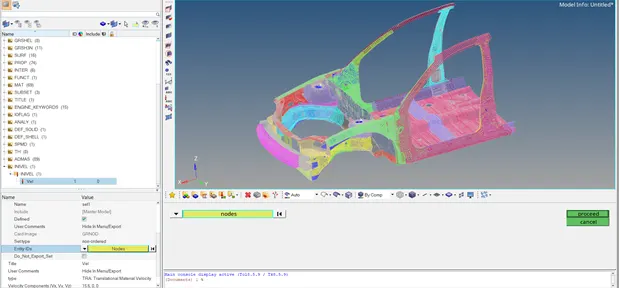
After the create Grnod_id, Go to Entity IDs and select all the nodes of the model so the the initial velocity is assigned to them
Nodes selection in Entity selection under gnodid:
Rigid wall creation:
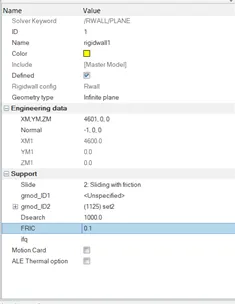
To create rigid wall , in the model browser go to create, then select rigid wall.
As shown in the figure below, The Engineering data and the support data is entered by taking the reference of the full car model provided. Slide value was set as 2 and Dsearch value as 100 are entered.
Friction is entered as 0.1 as shown below.
Interface Creation:
In RADIOSS an interface is created by defining the master segment and slave node set. The master segment can be parts components, elements, contact surface, node surface sets and slave entities can be parts components and node sets. The contact algorithm will check every time step for potential penetration of a slave node through a master segment
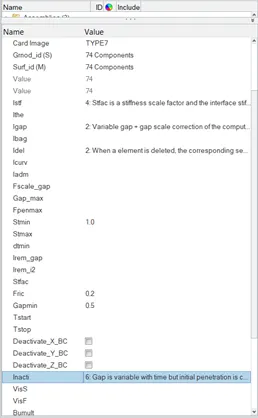
In this case Goto model browser, and create a contact. In the contact section, enter the recommended parameters like Type of contact, Istf , Igap , Idel , Stmin , Fric , Gapmin , Inacti , Iform etc. Now select Masters and slaves through Surf_id(M) and Grnod_id(S) respectively and under Entity IDs components for master and slaves respectively as shown below:
Centre of Gravity:
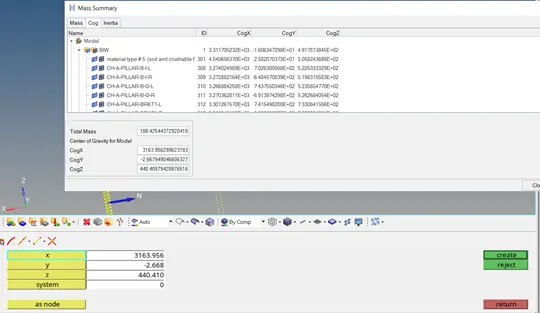
On taking a node at the cordination of the centre of gravity it was seen that it was not at a proper position, and also total mass wat quite less by around 512kg, so to correct that that much of mass was added uniformly at the back portion of car to obtain proper mass as well as the center of gravity at a proper position.
Mass addition and balancing:
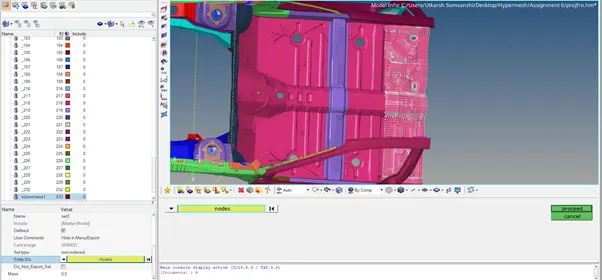
In order to add mass to the components, in the model browser, right click and go to solver mass. Under that select the required mass type (type 1 was taken in this case) , mass and grnd_ID and under that go to Entity_ID and select the Nodes on which mass is to be added as shown in the figure below.
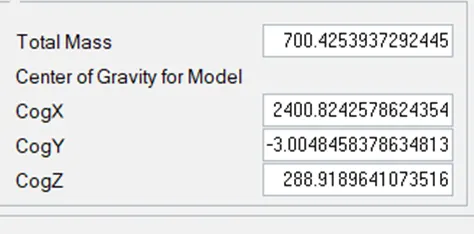
In the figure below it can be seen that Mass id almost proper as required and centre of gravity is also shifted at a proper position i.e. at the middle and behind the portion of the driver’s seat.
Section selection:
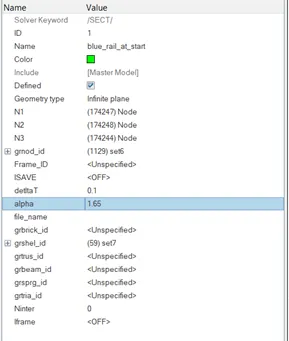
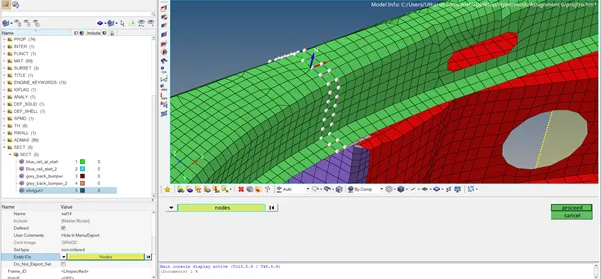
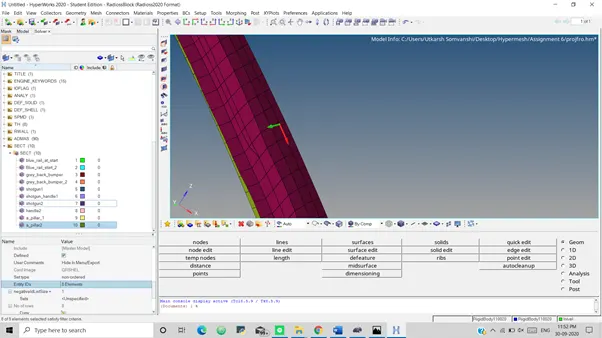
Moving frame was specified and selected at each of the selected section. Also appropriate elements were selected. Values of deltaT and alpha were entered as 0.1 and 1.65 respectively.
Time history:
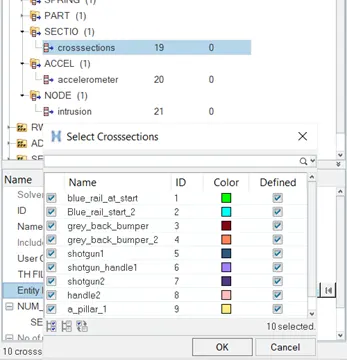
To get the above created sections in the result, the cross sections were selected and assigned to the TH->SECTIO->crosssections.
Similarly acclerometer’s and the instrusion nodes were assigned in the TH to get their time history result in the output block, as shown in the images below:
Model Checker:
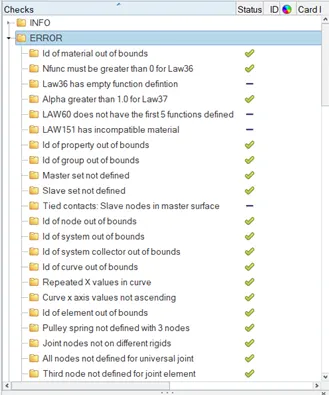
Finally before simulation run , model checker was used check the model for looking for errors or warnings and their rectification so that problems are not encountered during simulation run. To run model checker goto Tools -> Model checker -> Radioss and checker appears as shown below and then it is run to check for errors etc.
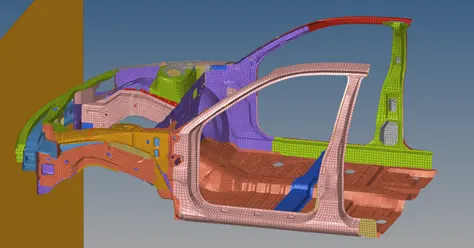
Animation after running the simulation was as follows:
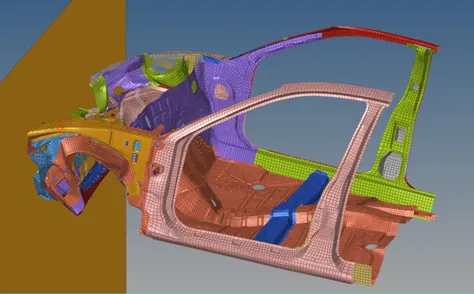
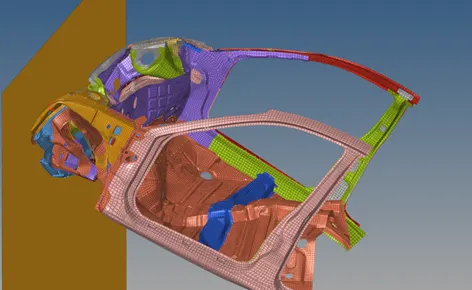
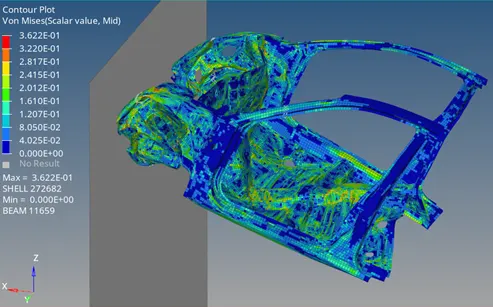
The car model is crashed from the front region, the deformation starts from the bumper and hence move along as shown the the images below. Initially the stress was maximum at bumper but was later distributed in other portions too as shown in the contour plot.
Mass Error: 0.3770E-01
Energy Error: -0.6%
ELAPSED TIME: 3427.79 s
Contours :
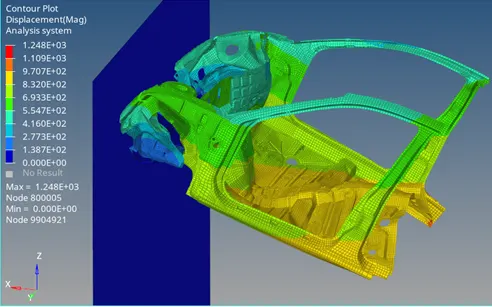
Displacement Contour Plot:
Max Displacement: 1.248E+3
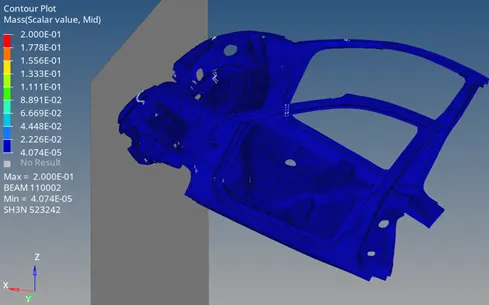
Mass Contour Plot:
Max Mass: 2E-01
Min Mass: 4.074E-05
Von Mises Contour plot:
Max Von Mises stress: 3.622E-01
Graphs:
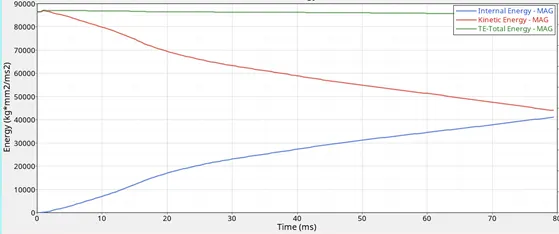
Internal and kinetic energy variation:
It is obvious that due to crashing the Kinetic energy decreases, it get converted to internal energy which is increases as show below:
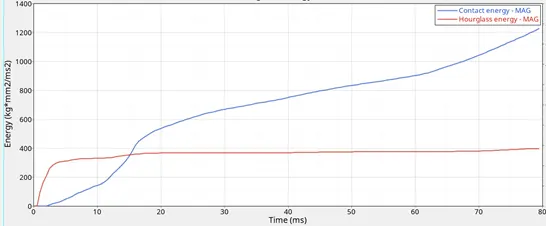
Contact and hourglass variation :
Total resultant forces on Cross sections asked along with the cross sections where they are measured:
Rail (Blue colured component):
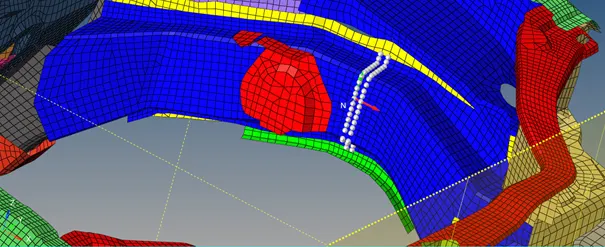
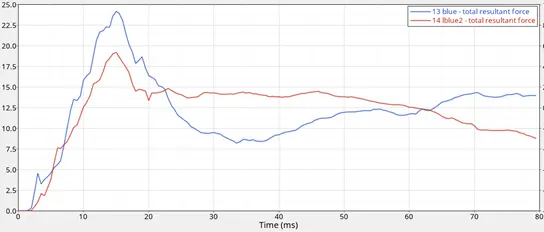
The forces across both the sections which are adjacent were not similar This was due to difference in selection of different nodes and elements over those cross-sections. He it can be seen that from 0 to 15th ms there is an increase in the forces and then a decrease. And after that there is are variations but not such steep. This may be because at 15th ms the blue rail part is hitting the rigid wall se the forces are high.
Rail behind the bumper:
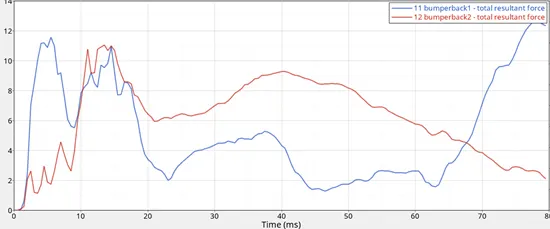
The forces across both the sections which are adjacent were not similar This was due to difference in selection of different nodes and elements over those cross-sections. Similarly to the previous case here also due to initial collision there is an increase in force but then a decrease. At the end there is an increase in one of then because maybe the rear part come in close contact of that component so the force again increases.
Shotgun tunnel:
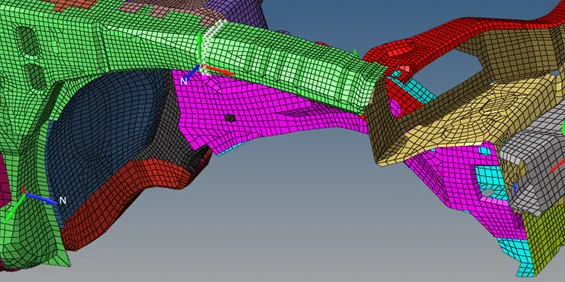
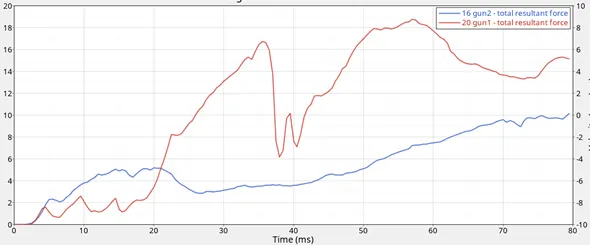
The forces across both the sections which are adjacent were not similar This was due to difference in selection of different nodes and elements over those cross-sections. Force here is observed to be increasing with time approximately.
Shotgun portion near the front door as shown:
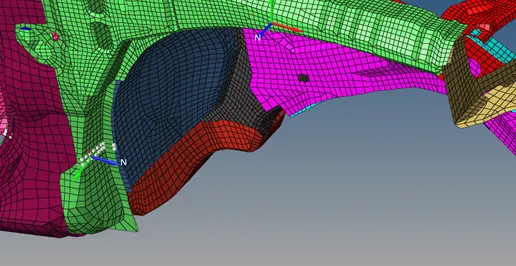
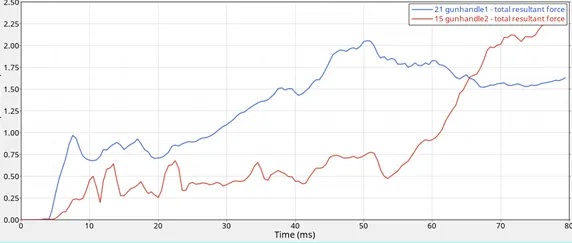
The forces across both the sections which are adjacent were not similar This was due to difference in selection of different nodes and elements over those cross-sections. For first few milliseconds there os no contact on that component due to collision, so the force is 0 initially and after that it keeps on increasing with time as the collision proceeds.
A-pillar:
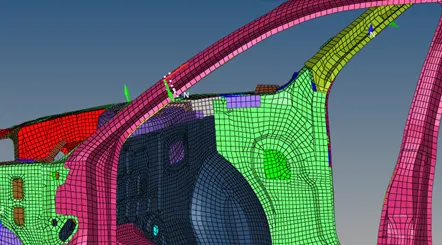
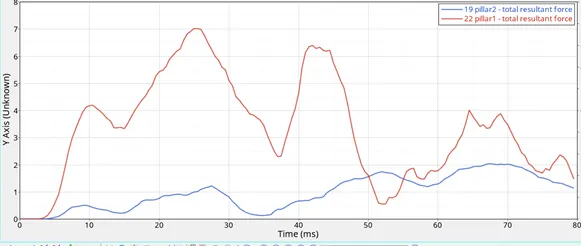
The forces across both the sections which are adjacent were not similar This was due to difference in selection of different nodes and elements over those cross-sections. Similarly here as initially there is no contact or impact so the force is 0 initially and after which there is variation in forces accordingly.
Intrusions on the nodes asked in the problem statement:
Node numbers and variations are mentioned in the graph.
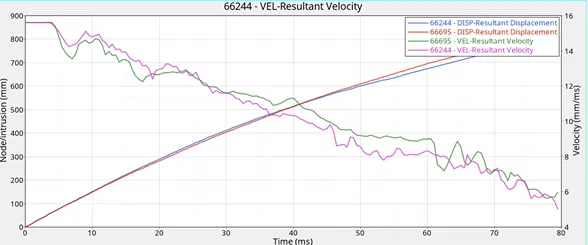
It is very clear from the graph that as the collision proceeds the dispacement of the given nodes happen at alost a very decent pattern as seen from the graph, the displacement plots are very much similar in both cases.
Accelerometer:
It was placed on the rocker portion on the base of B-pillar.
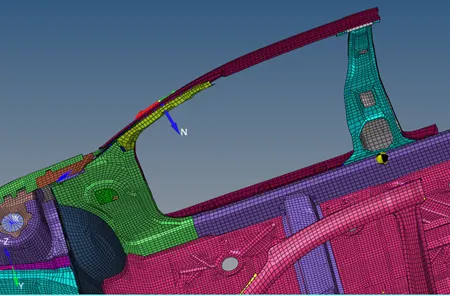
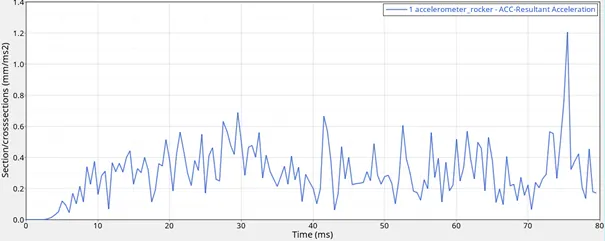
By observing the graph , it can be seen that the acceleration has increased and decreased periodically and its maximum value is at 75ms. This is maybe because the velocity at that time period would have been maximum. A lot of jerks are observed from this graph.
Conclusion:
For the given model of Neon, the frontal crash analysis was carried out successfully using Hypermesh, HyperCrash and Radioss, and the required results were plotted and analysed accordingly.