FRONTAL CRASH OF CAR BIW
AIM:-
To create a deck setup for the FRONTAL CRASH OF CAR BIW and requst for TH (Time History) plots
OBJECTIVES:-
- Check unit system and either follow[Mg mm s] or [Kg mm ms].
- Create appropriate interface ,friction 0.2 and recommended parameters.
- Make sure of no penetrations and intersection,Correct rigid bodies if any issues.
- Create rigid wall with friction 0.1.
- Added masses to reach target weight 700kg while getting CG about the required range.
- Initial velocity 35 mph.
- Time-step :0.5 to 0.1 microseconds.
- Run 80 ms.
Output requests:
- Sectional force in the rails at location of indicated node 174247.
- Axial force received on the rails from bumper.
- Shotgun cross sectional forces.
- A pillar cross section.
- Acceleration curve received on the accelerometer at base of B pillar (on B pillar rocker).
- Intrusions on the dash wall 66695,66244.
THEORY:-
what is crash test ?
A crash test is a form of destructive testing usually performed in order to ensure safe design standards in crashworthiness and crashcompatability for various modes of transportation (see automobile safety) or related systems and components.
Crash is the explicit analysis. Explicit dynamics analysis is used to determine the dynamic response of a structure due to stress wave propagation, impact or rapidly changing time- dependent loads. Momentum exchange between moving bodies and inertial effects are usually important aspects of the type of analysis being conducted. This type of analysis can also be used to model mechanical phenomena that are highly nonlinear. Nonlinearities may stem from the materials, (hyperelasticity, plastic flows, failure), from contact (high speed collisions and impact) and from the geometric deformation (buckling and collapse). Events with time scales of less than 1 second (usually of order milliseconds) are efficiently simulated with this type of analysis. Based on all these conditions the user will select an explicit solver to solve the analysis. Typical examples of explicit analysis are crash analysis, drop test, bird strike, fan blade out…etc. Obtaining an answer from an explicit simulation can be simple — it can be more challenging to get the correct answer. The predictions of a simulation are usually very difficult to confirm using traditional techniques, making it crucial that the analysis is carried out carefully and thoroughly. Nonlinear analysis requires a lot of experience and a careful understanding of what you want to achieve, as well as a careful understanding of the software's analytical capabilities. When choosing a method for a dynamic problem, considerations must be made regarding the length of time the response can take place compared to the explicit method's stability limit.
Types of crashes tested
There are three types of crash frontal , side , and roof crash

FRONTAL CRASH
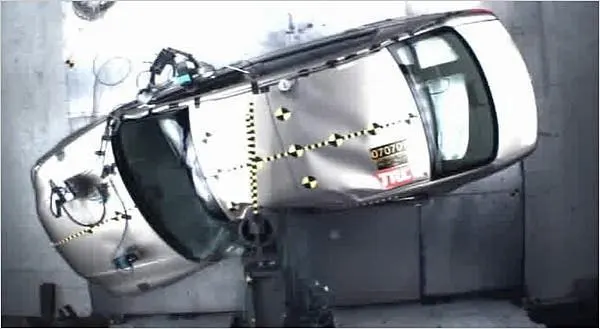
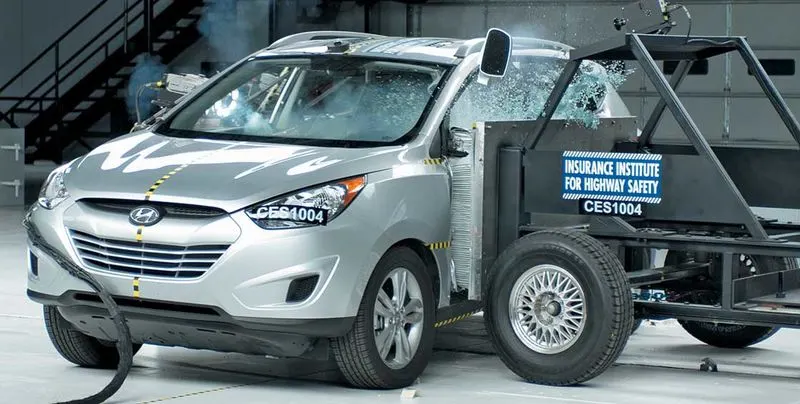
SIDE POLE CRASH SIDE CRASH
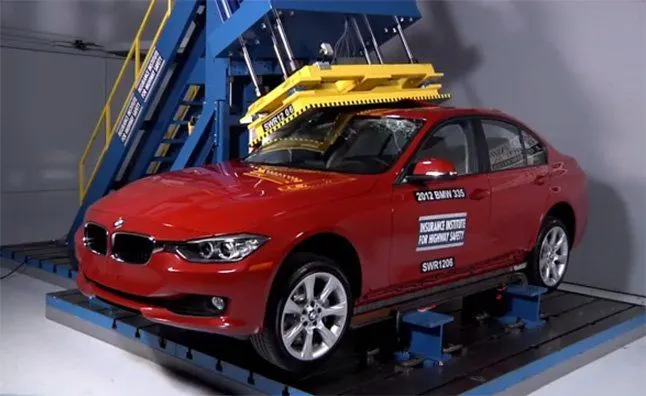
ROOF CRASH
Types of frontal crashes tested
The three different frontal crash tests:
A moderate overlap test (formerly known as the frontal offset test),
A driver-side small overlap test and,
A passenger-side small overlap test.
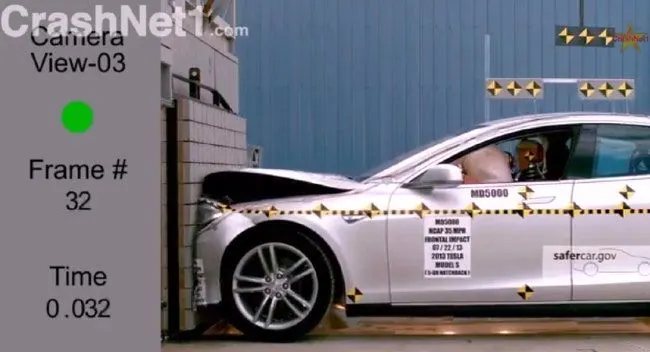
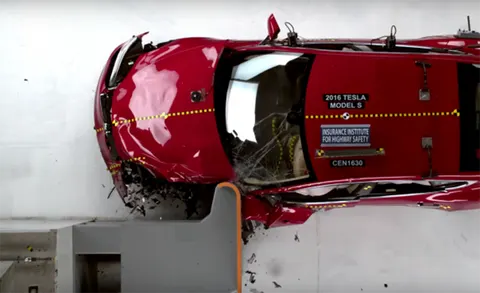
A moderate overlap test A driver-side small overlap tes
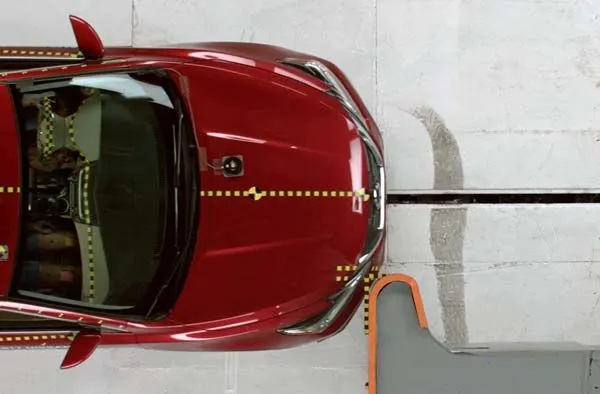
A passenger-side small overlap test
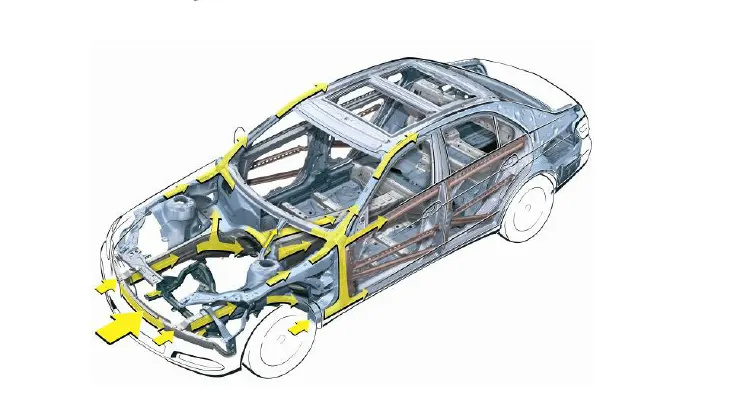
Here we are doing the A moderate overlap test on car The forces are acting as shown in the below fig
METHODOLODGY:-
- IMPORT THE FILE
- SET UP FOR THE FRONTAL CRASH OF NEON FRONT
- OUTPUT REQUESTS
- RESULTS and simulation
- plotting graphs
PROCEDURE:-
1:-IMPORT THE FILE
- Open the hyper mesh software and select the profile as radioss
- Go to file and click on the import and select the import solver deck
- click on the file option and select the file neon_front_0000.rad
and click on the import as shown in fig 1.1
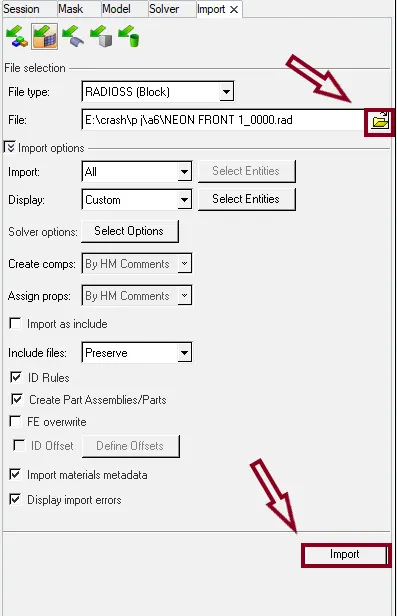
Fig 1.1
- After importing the model the model is as shown fig 1.2
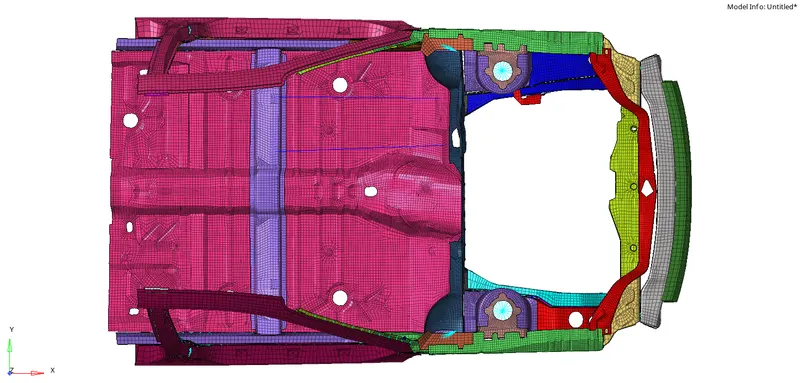
Fig 1.2
2:-SET UP FOR THE FRONTAL CRASH OF NEON FRONT
1 :- Check unit system and either follow[Mg mm s] or [Kg mm ms].
- In engine cards we can see the BEGINE_CARD there we can check the units followed in the model as shown in fig 2.1
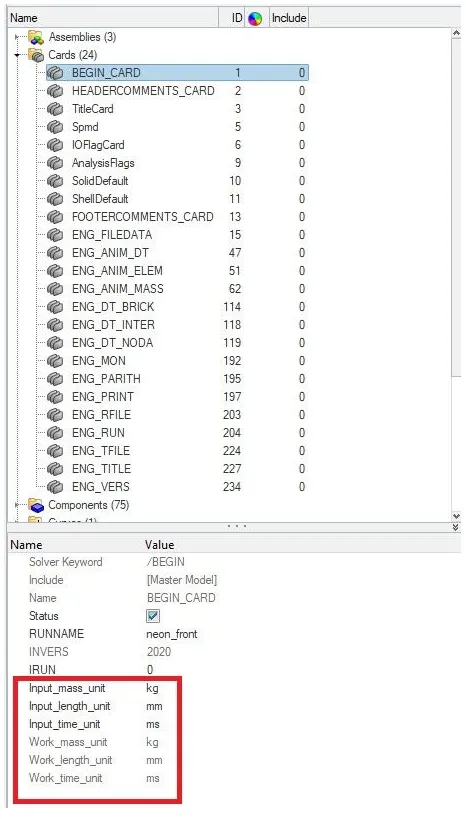
Fig 2.1
- Units used in the model is [Kg mm ms]
2 :- Create appropriate interface ,friction 0.2 and recommended parameters.
- Here we have to create 2 contact interfaces one is for self interface and other one is to get forces near bumper area . Both interfaces are having Recommendations interfaces with gap mim 0.5 and friction 0.2
- And the recommended parameters are shown in the below fig 2.2
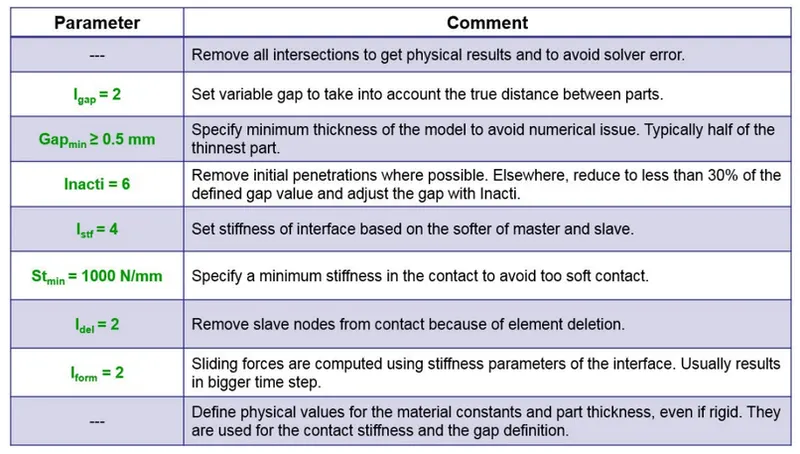
Fig 2.2
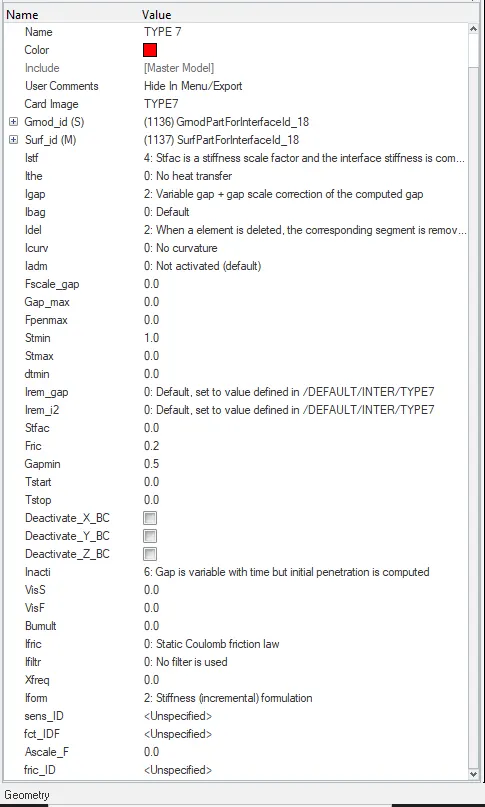
- Here we are using only TYPE 7 interface for the type 7 interface these are parameters used
- To create the type 7 interface we can use hypermesh or hypercrash in hypermesh as shown in fig 2.3
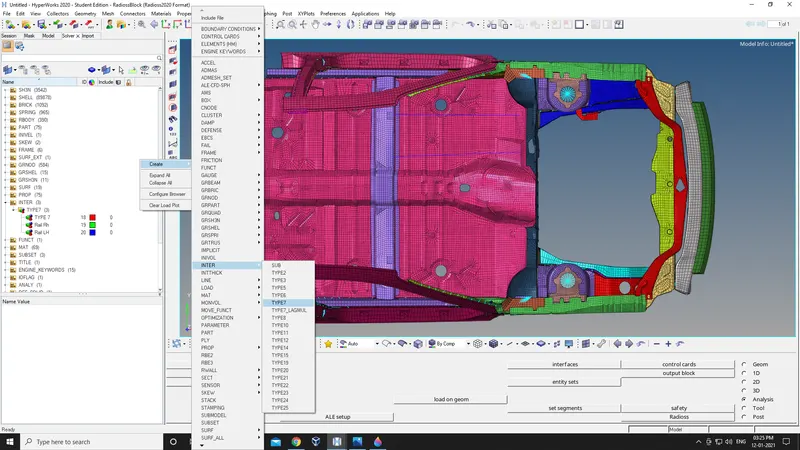
Fig 2.3
- Parameters are set as recommonded shown in fig 2.4
- For the self contact interface we have to give master and slave as car components as shown in the fig 2.5
- Where the Blue colour is the master and red colour is the slave
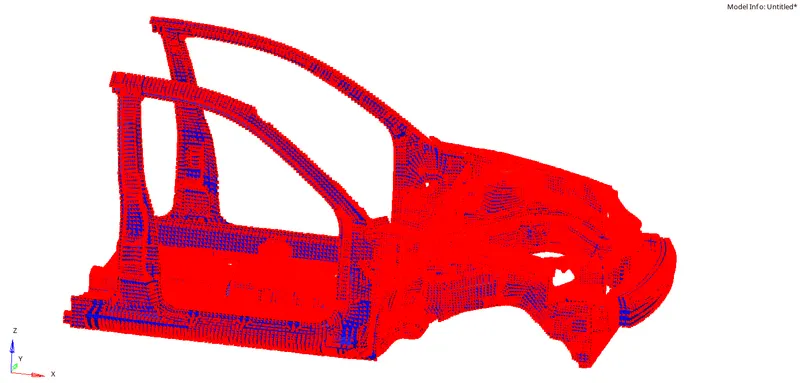
Fig 2.5
- Similarly we have to create the type 7 contact on the bumper area where the bracket is master and the bumper as slave as shown in the fig 2.6
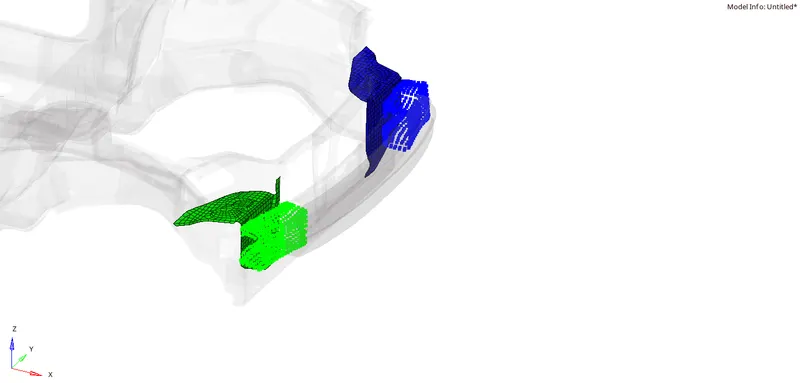
Fig 2.6
3 :- Make sure of no penetrations and intersection,Correct rigid bodies if any issues.
- To check the penetrations and intersection we have to open the hypercrash
- To open the hypercrash click on the applications and select the hypercrash and set the units to [Kg mm ms] an run
- And import the model by dragging the file into the hypercrash
- Cllick on the quality and select the check all intersections the window shows as below fig 2.7
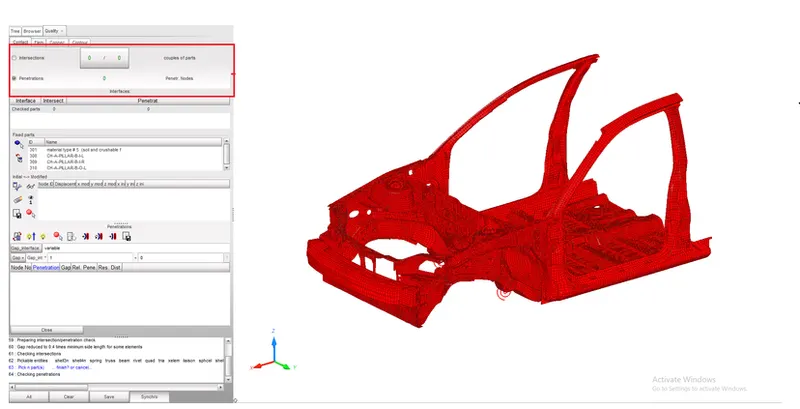
Fig 2.7
- There are no penetrations and intersection in the model
- And also there are no issues in the rigid bodies
4 :- Create rigid wall with friction 0.1.
-
Create Rigid wall by Solver > Create > Rwall > Plane.
-
Give sliding with friction of 0.1.
-
Search distance 2000 (Distance for slave search).
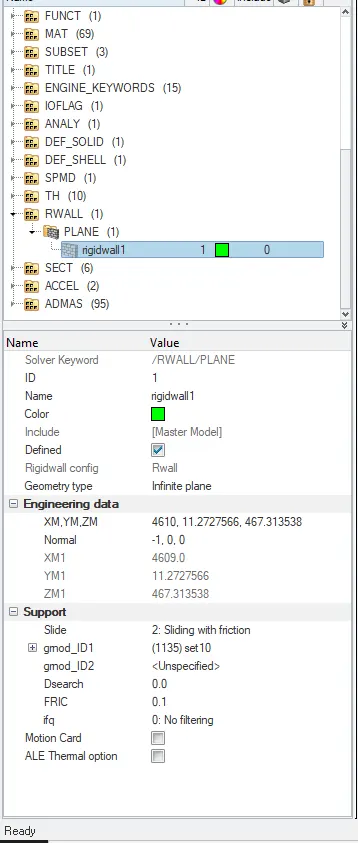
- XM YM ZM are the coordinates the point where the rigidwall will be created
- And the wall is created as shown in the fig 2.8
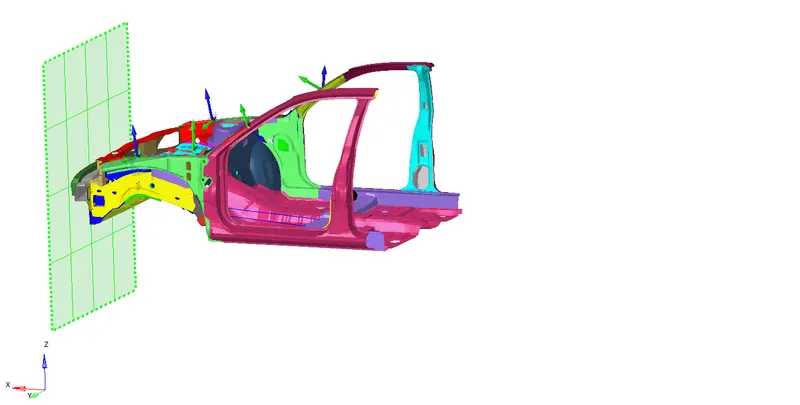
Fig 2.8
5 :- Mass balancing and Added masses to reach target weight 700kg while getting CG about the required range.
- In hypercrash click on the mass and select thje balancing there click on the show COG point we can see the COG and total mass of the model as shown in the fig 2.9
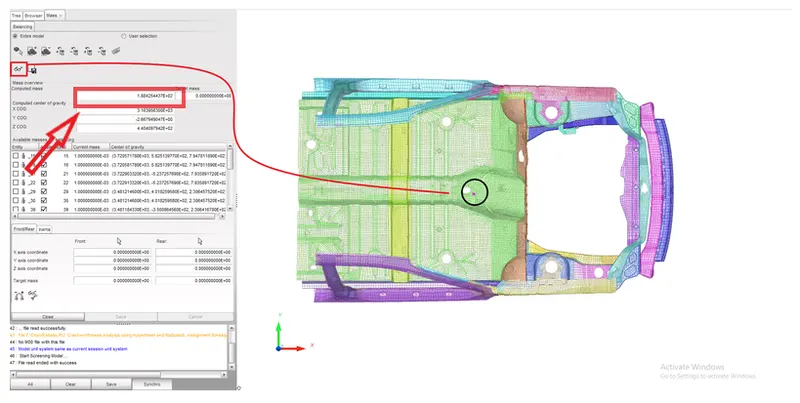
Fig 2.9
- By adding masses to the model at various places the COG and the weight should be as shown in the fig 2.10
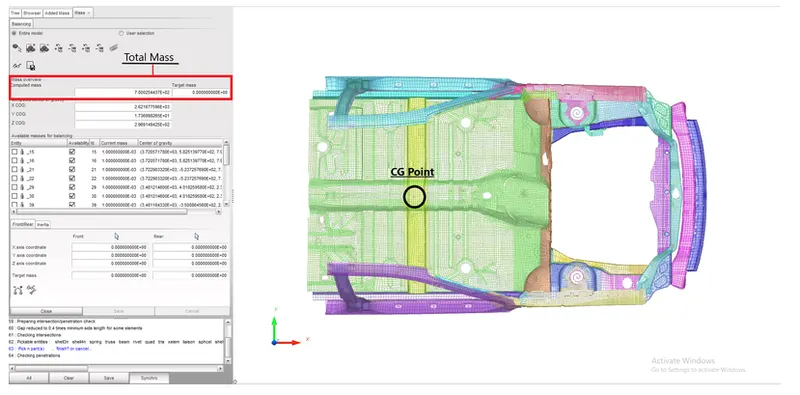
Fig 2.10
6 :- Initial velocity 35 mph
- We can create the initial velocity in both HM and HC
- Solver >create>boundary conditions > INIVEL in HM
- Right click in tab area > creatw > I-L > Initial velocity, in HC as shown in fig 2.11
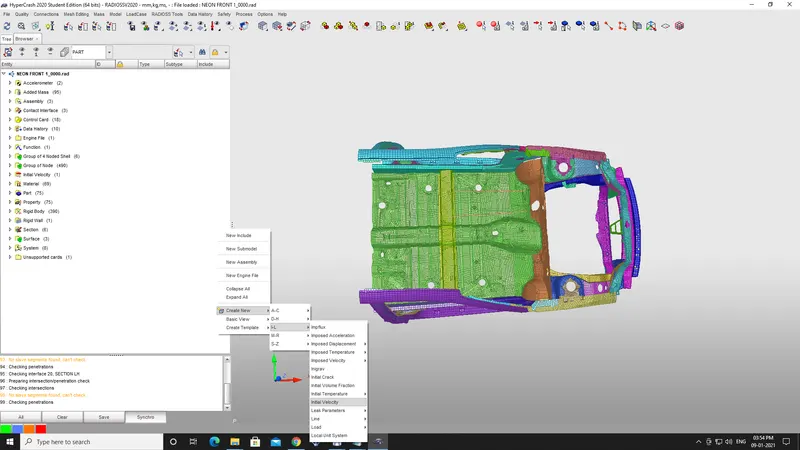
Fig 2.11
- In order move car towards rigid wall. Given velocity 35mph convert to m/s so we have 15.646 m/s
- Apply velocity to all components in X direction shown in the fig.2.12 below
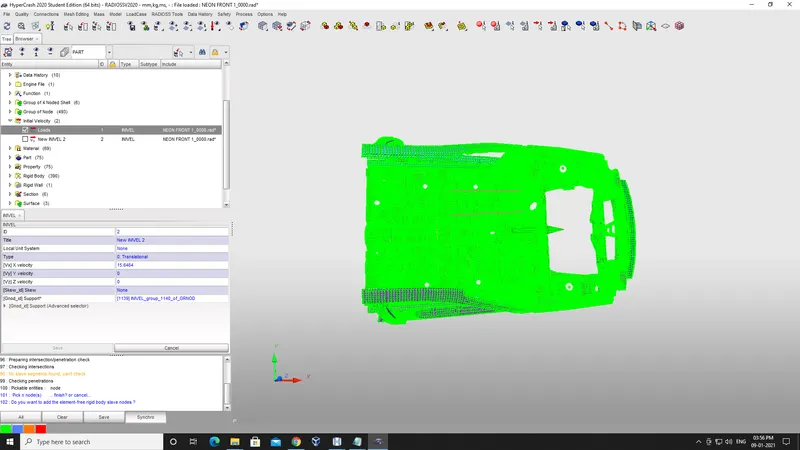
Fig 2.12
7 :- Time-step :0.5 to 0.1 microseconds ,Run 80 ms.
- Input the Run time 80ms that is Final time for the run. in engine cards ENG_RUN
- Time step: Time step defaults for all elements which is 0.003ms (Solver > Create > Engine keywords > DT >DT) . If the time step of a simulation reaches ΔTmin">ΔTmin,then the following actions will happen depending on which element type is controlling the time step. For /BRICK or /QUAD elements, the simulation stops and a restart file is created. For /SHELL or /SH_3N elements, the element controlling the time step is deleted from the simulation. For all other element types, ΔTmin">ΔTminis not used.
8 :- Set up model checker
- Before creating animation it is always best practice to eliminate error to get accurate results or some times due to these errors animation files dosen't gets created.(Hypercrach>>Quality>>Model check>>Run) As we see in fig 2.13 there were o errrors & some warning found while on running model checker. all warnings are not harmful but errors must be eleminated before running simulation.
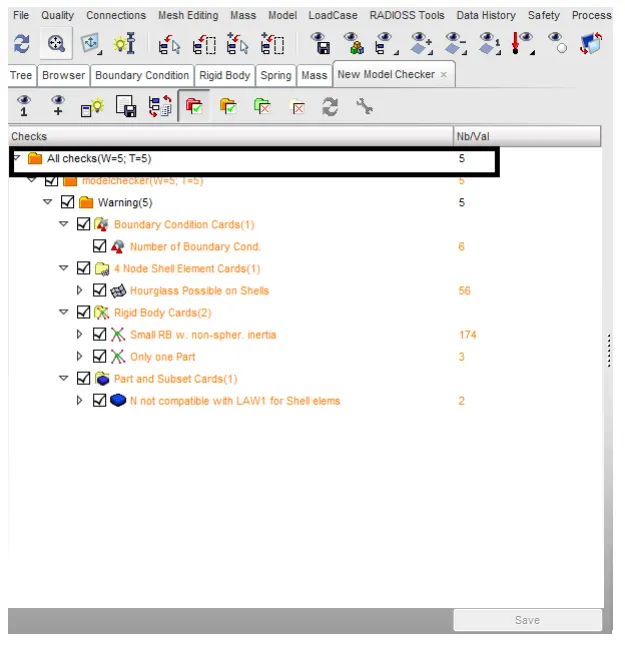
Fig 2.13
3:-OUTPUT REQUESTS
- Sectional force in the rails at location of indicated node 174247.
- Axial force received on the rails from bumper.
- Shotgun cross sectional forces.
- A pillar cross section.
- Acceleration curve received on the accelerometer at base of B pillar (on B pillar rocker).
- Intrusions on the dash wall 66695,66244.
1 :- sections creation on rails ,shotgun ,and A piller cross section
- We have to create the sectional forces on the rails ,shotgun ,and A piller cross section
- First we have to create moving frames on the indicated nodes
FRAME :- Frame is a type of reference coordinate system where the quantities defined follow its own origin.Here, unlike the moving skew, the moving frame is attached with the node which is selected as origin.Calculates the motion of the body relative to the frame defined.Frames are used only in notable options like imposed velocity, imposed displacement, TH/node etc.,
- To create a frame Solver > frame > mov

- We have to select the origin node that which node is indicated in the output requests and X-AXIS or Z-AXIS and XY PLAIN we have to give that which the frame should move fame is created as shown in the fig 3.1
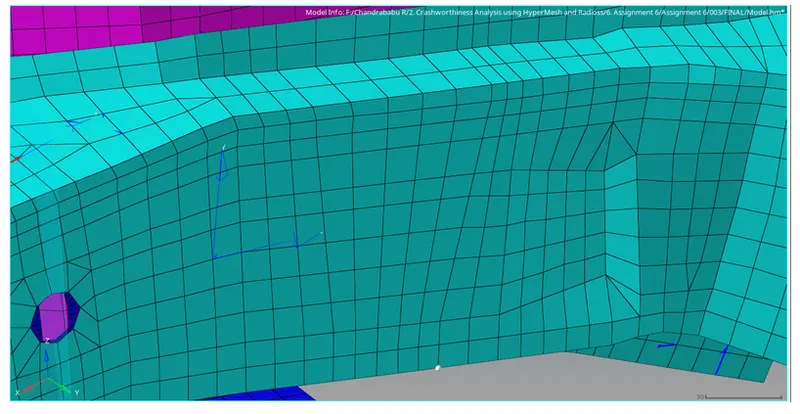
Fig 3.1
- And then we have to create the sections on the indicated node
-
A section is a set of nodes and a set of elements. A section is a cut in the structure, where forces, moments or energy will be computed and stored in output files (using /TH/SECTIO). In Radioss /SECT, /SECT/PARAL and /SECT/CIRCLE can be used to define a section.
- To create the sections path shown in fig 3.2
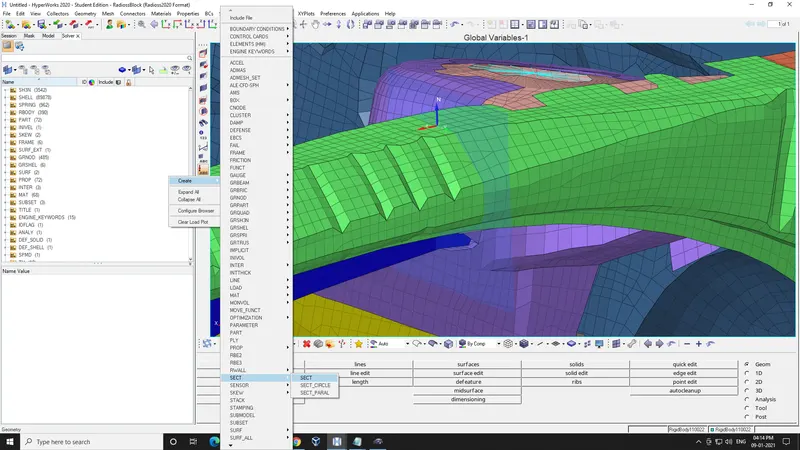
Fig 3.2
- We have to select the N1 ,N2 ,and N3 as which the direction of the car is moving as shown in fig 3.3
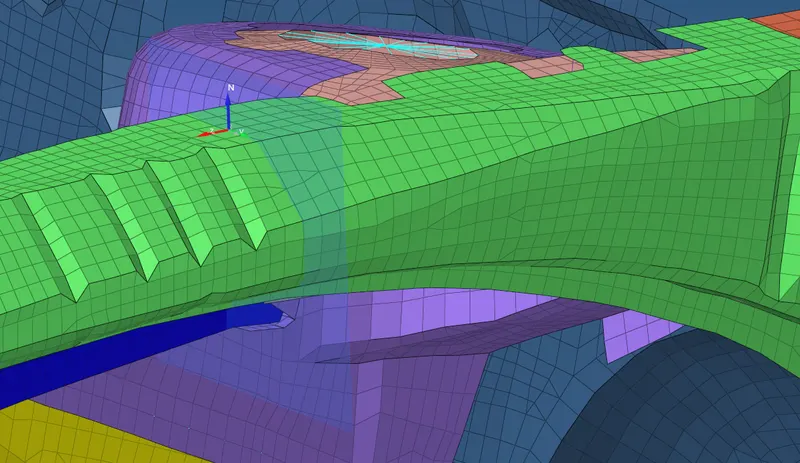
Fig 3.3
- In that we have to select the elements around to create a section over there as shown in the fig 3.4
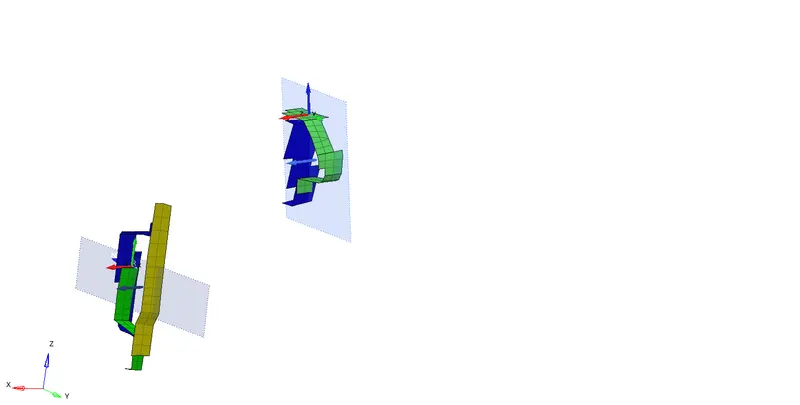
Fig 3.4
- And same for the all indicated nodes where we have to create the sections as shown in the fig 3.5
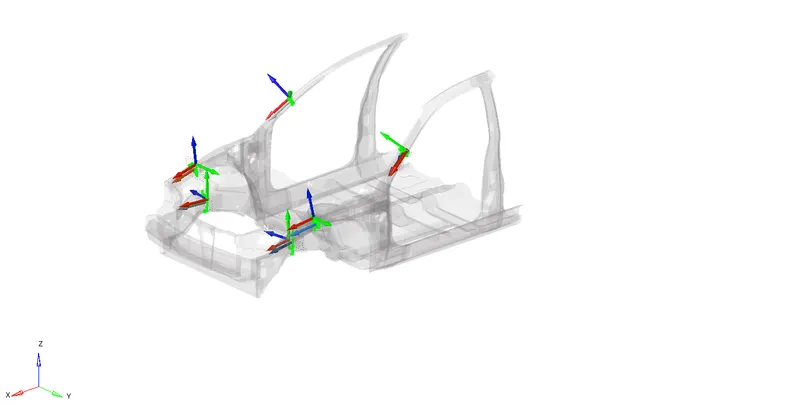
Fig 3.5
2 :- Acceleration curve received on the accelerometer at base of B pillar (on B pillar rocker).
- To get Acceleration curve we have to keep the accelerometer over there
- To set the meter Solver > ACCEL > Select node And create as shown in the fig 3.6
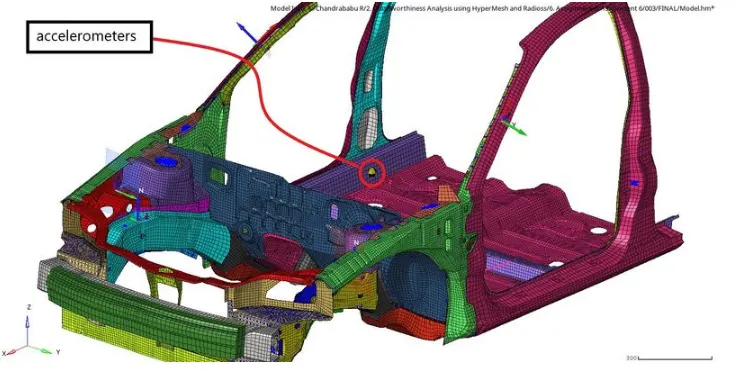
Fig 3.6
3 :- Intrusions on the dash wall on nodes 66695,66244.
- To get the intusions on dash wall on nodes 66695,66244.
- We are going to create the spring elements perpendicular and we can find the intrutions by calculating the elongation of the springs after simulations , springs created as shown in fig 3.7
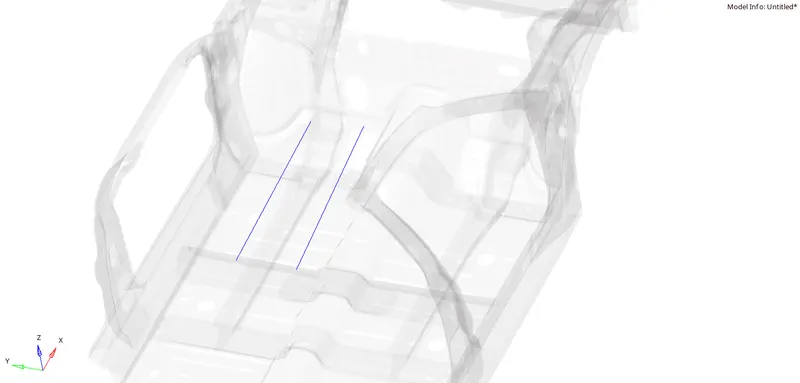
Fig 3.7
4:-RESULTS and simulation
- Before running the simulation make sure to delete the unused and run the model checker TOOLS>MODEL CHECKER>RADIOSS BLOCK
- If there is any errors or incompatable kinamatic contitions fix the error and run the simulation ANALYSIS>RADIOSS>RADIOSS simulation shown in GIF 4.1
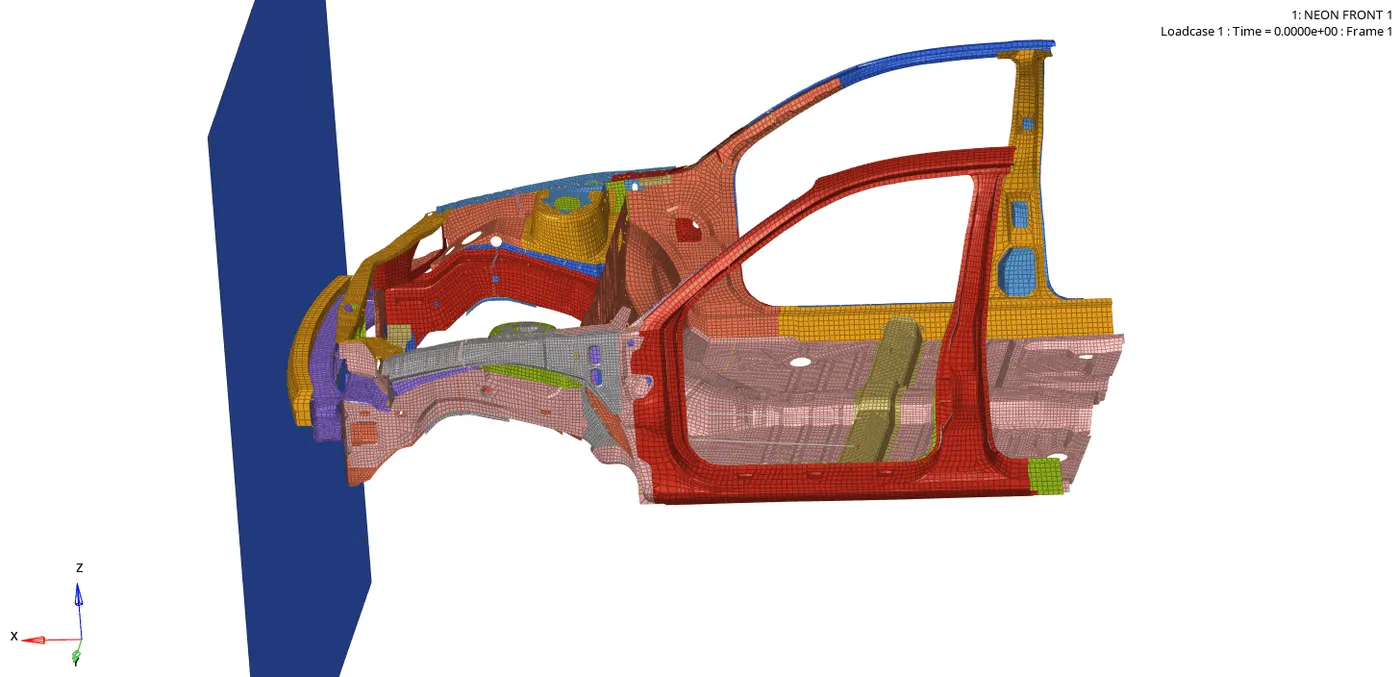
GIF 4.1
- After running the simulation check for the energy error and mass error as shown in fig 4.1
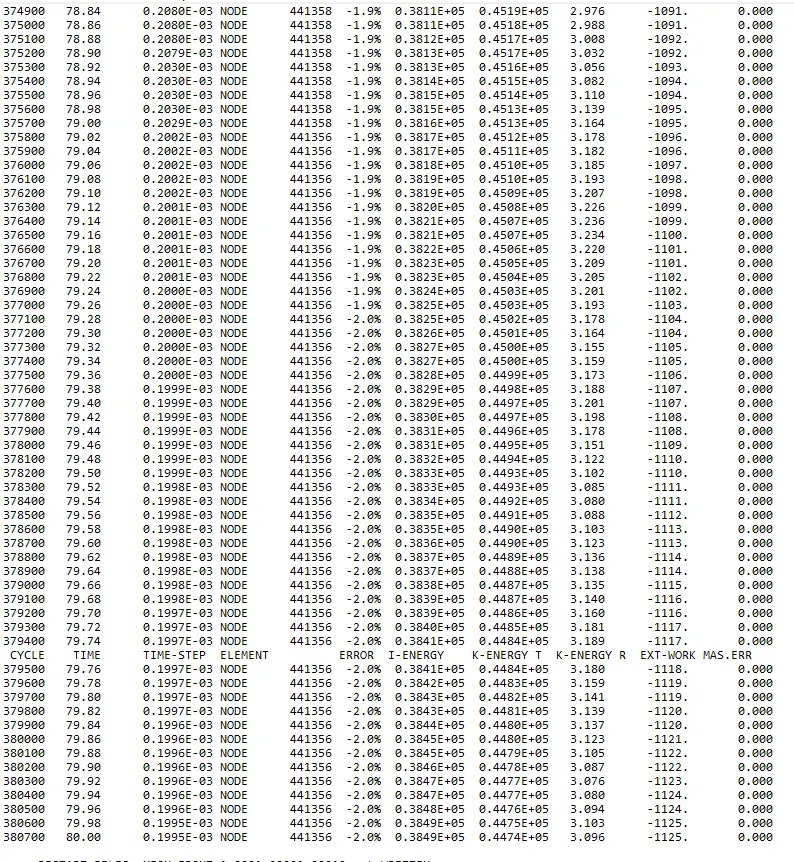
Fig 4.1
- energy error is -2.0% and mass error is 0.0 the model is good
- And the time taken for the simulation is 16950.70 s and number of cycles is 380706
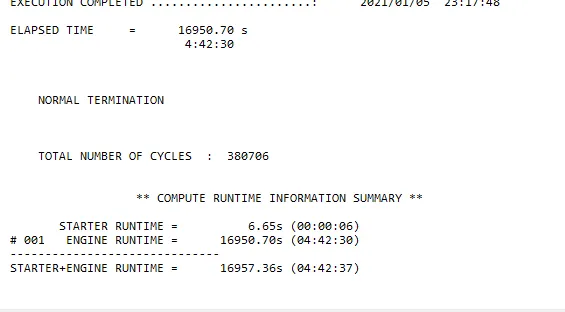
Fig 4.2
- We can see these results in the 0001.out file
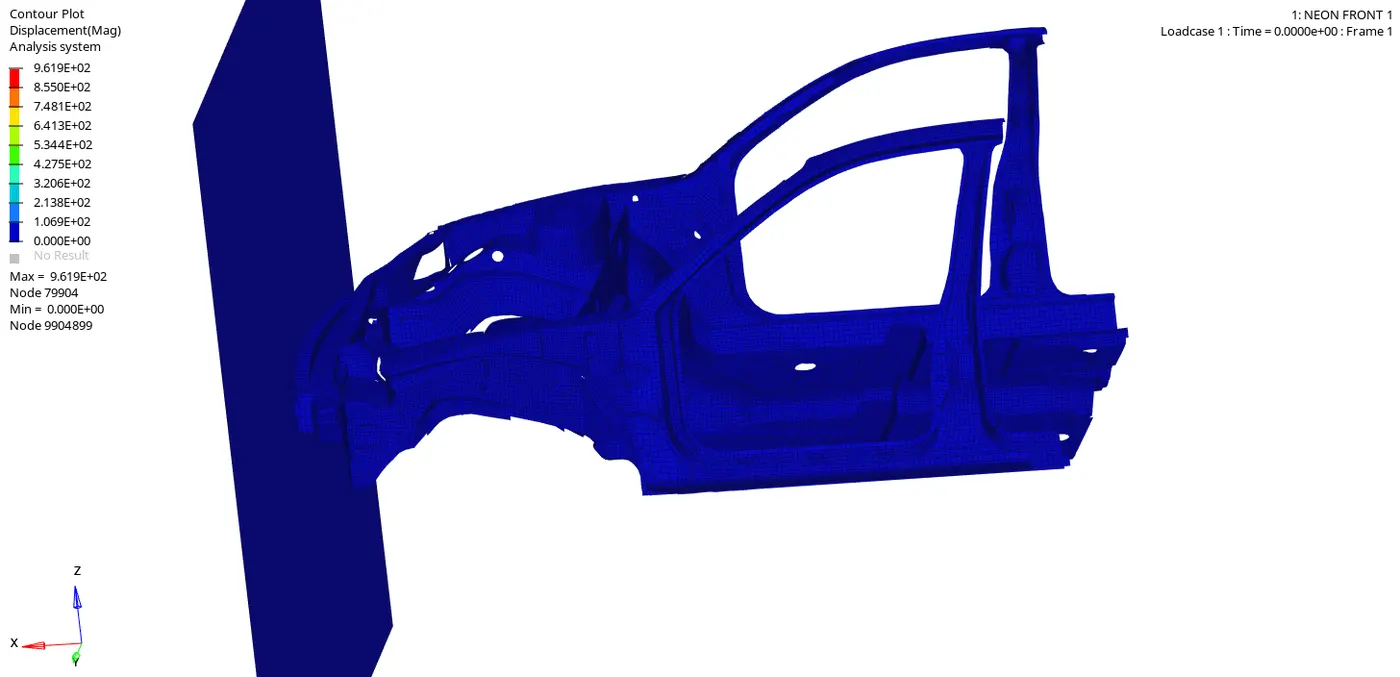
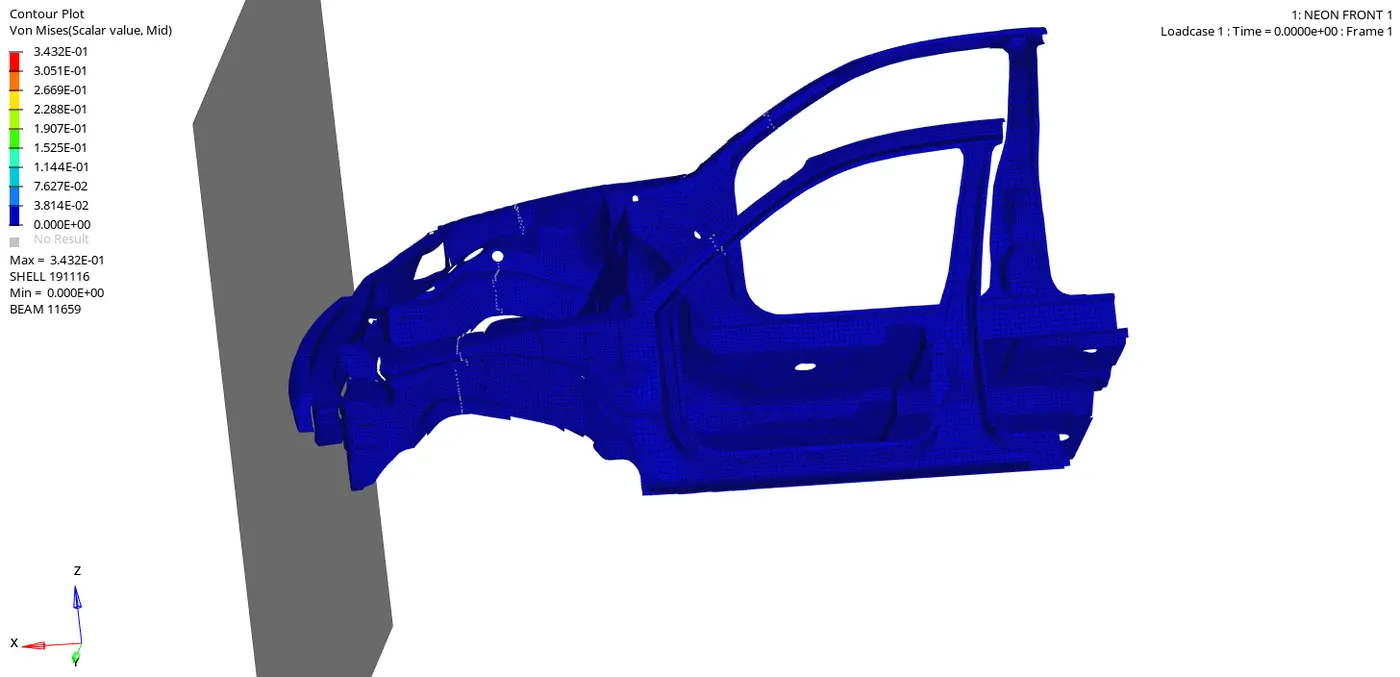
- Displacement is shown in GIF 4.2 and vonmisses in GIF 4.3 of the model
GIF 4.2
GIF 4.3
5:-plotting graphs
- To plot graph change it to the HYPER GRAPH 2D and select the T01 file
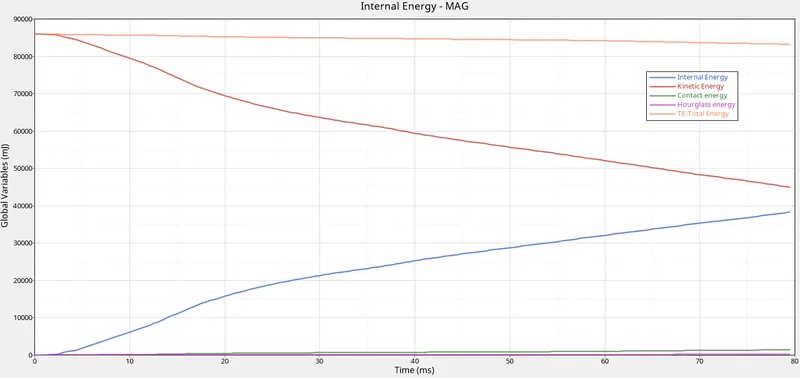
5.1 :- Graph 5.1 shows the IE ,KE ,CE ,HE ,TE to time
Graph 5.1
- Initially IE is zero and its increasingw,r,t to time until the the complete crash happens. because at initial stage we have maximum velocity,Kinetic energy is directly proportional to the Velocity. so kinetic energy is max at initial stage after hitting the KE is observed by plate so internal energy increase until the component reaches complete crash after that there is no energy observed (internal energy ΔU = q+w)
- we have Total Energy = Internal Energy + Kinetic energy + External Work, Here TE is not depending on external work because there is no any force acting on car BIW only the car is moving with velocity.as IE increasing and KE decreasing in same path so the TE is remains Constance. TE is slightly decreasing because of Contact energy i.e Contact energy is the energy acting opposite to the system to prevent the penetration acting on the system due to applied velocity.
- Hourglass energy is constantbecause both are controlled by elements formulation. here hourglass is controlledby Physical stabilization i.e changing material level in ISHELL is 24 QEPH Shell formulation.
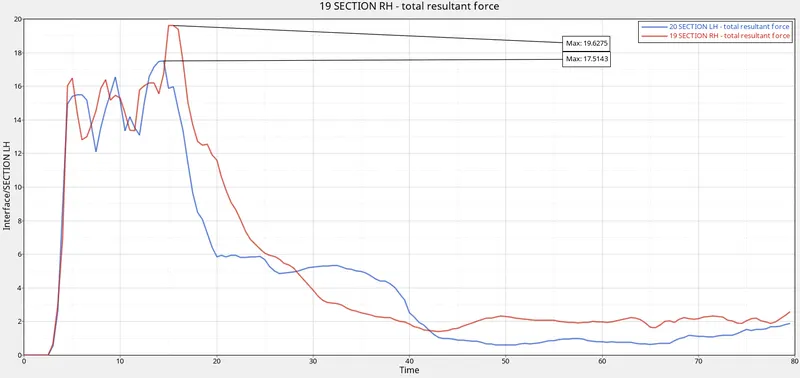
5.2 :- Axial forces acting on the BRACKET sections LH and RH which we created shown in the Graph 5.2
Graph 5.2
- The max force of LH side is 17.5143 KN and RH side 19.6275 KN at around 15ms axial force on bumper bracket
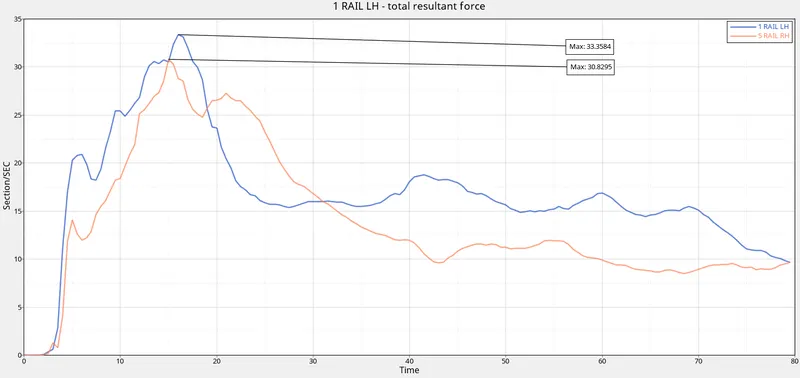
5.3 :- Sectional force for rails: From the bumper part of load will carry through LH & RH rails of car. we have section for the same. in the Graph 5.3 show the Sectional force for rails. From the graph the max force are flowing though the rails because the rail is more stiffer compare to the bumper and crush tube.
Graph 5.3
- Max force at LH rail is 33.3584 KN at 15 ms
- Max force at RH rail is 30.8295 KN at 17 ms
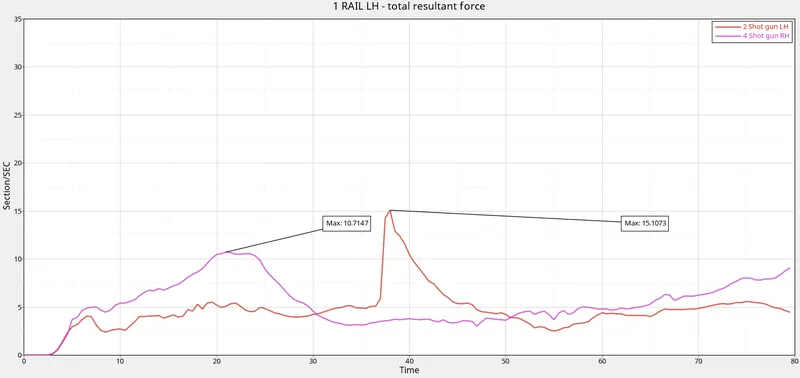
5.4 :- Shotgun sectional forces: From the bumper part of load will carry through LH & RH shotgun of car. we have section for the same. in the Graph 5.4 show the Sectional force for Shotguns. From the graph the force are flowing though the Shotguns is less then Rails because less stiffer and from the structure design we can see the distribution is more on rails then the shotgun.
Graph 5.4
- Max force at LH Shot gun is 15.1073 KN at 37 ms
- Max force at RH Shot gun is 10.7147 KN at 21 ms
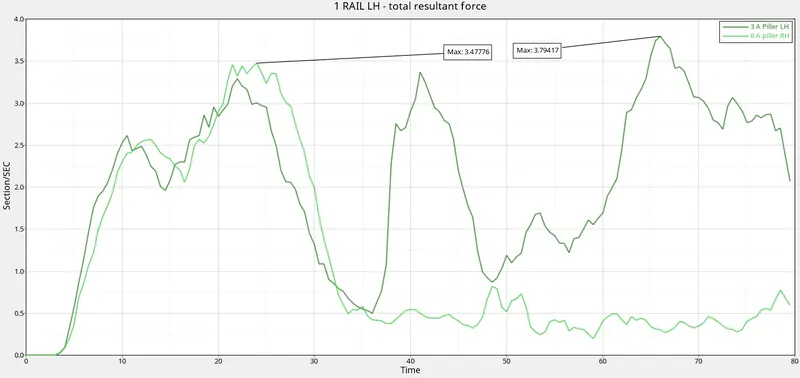
5.5 :- A pillar cross section: From the Shot gun load will carry through LH & RH A Pillerof car. we have section for the same. in the graph 5.5 show the Sectional force for A pillar. From the graph the force are flowing though the A pliier is less then Rails and Shotgun because less stiffer and from the structure design we can see the distribution is more on rails then the shotgun then A piller.
Graph 5.5
- Max force at LH A pillar cross section is 3.79417 KN at 66 ms
- Max force at RH A pillar cross section is 3.47776 KN at 25 ms
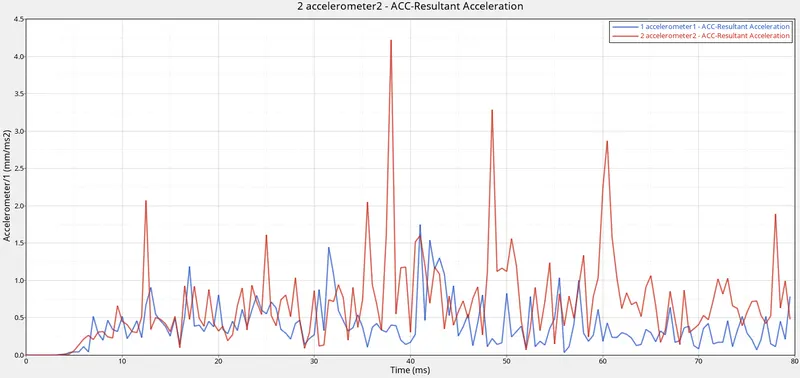
5.6 :- accelerometer An accelerometer is a device that measures the vibration, or acceleration of motion of a structure. The force caused by vibration or a change in motion (acceleration) causes the mass to "squeeze" the piezoelectric material which produces an electrical charge that is proportional to the force exerted upon it.
- We have mounted the meter on the rocker at bace of the B piller Graph 5.6 shows the accelerometer to time
Graph 5.6
- accelerometer 1 is RH side and accelerometer 2 is LH side
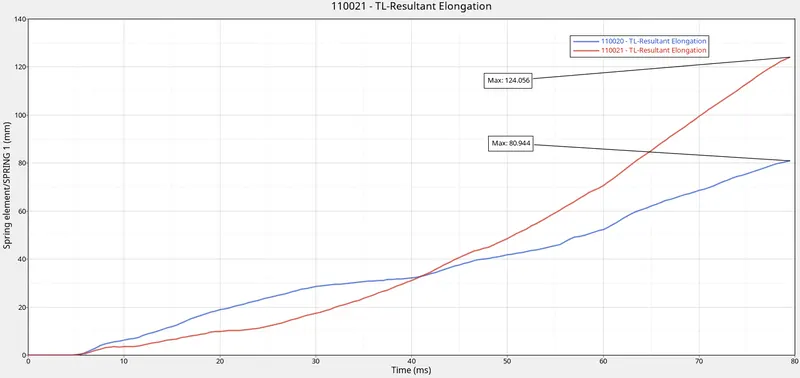
5.7 :- Intrusions on the dash wall 66695,66244 : Intrusion is change in space or decreasing length horizontally of car driver compartment. so due to Intrusions we can say safety of driver. intrusion is measured by creating spring element with less mass and stiffness so the one can check spring compression, from compression will give change in length of spring. in the Graph 5.7 shows the graph for spring compression as Intrusion.
Graph 5.7
- The resultant elongation of the spring elements we created on the dash wall 124.0 and 80.974
CONCLUSION :-
-
It is always best practice to remove unused joints or connecction established prior if not it may considered as error by solver
-
By comparing and understanding the all graphs the sectional forces we created the LH side absorbed more energy than compare to the RH side
- More intrusion takes place near spring 2 Comparatively to spring 1 on impact.
- Centre of Gravity plays important role in calculation of forces which can be adjusted by adding mass