Assignment 5-RADIOSS Interfaces & Study of Effect of Notches Challenge
Aim:
- to create the mesh for the bumper model with the target elements size as 6mm
- run the stimulation for the crash tube using the different interface cards (type 7 and type 11)
software used
Hypermesh, hyperview, hypegraph (2d)
Theory
Radioss uses different types of interfaces based on the application mainly type 7 and type 11
Type 7(node to element)
In the type 7 contact it uses penality method it uses master and the slave node in which the they are selected based on the material stiffness or the young modulus
Master : it guides the slave nodes towards the rigid body it does not allows the slave nodes to penetrate under it
Slave node : immediately deformable elements when the loads applied .
When the shock wave is allowed through the elements , the gap between the rigid body and the component which is fitted with the spring with the definite thickness is disturbed and which allows the penetration through the elements
Here, the displacement in the elements is inversely proportional to the stiffness of the spring and more the nodes more the timestep would be taken
Type 7 card contains
I gap : it defines the size of the gap between the components .it also considers the variable gap
Gap min: it the minimum gap between the parts where the stimulation gets activated. When the load applied breaks the minimum bridge value. Elements starts deformation
I stiffness: it is the stiffness between the master and the slave nodes. It shows the stiffness effected in the spring in the particular interface
I form :sliding forces in the elements due to the viscous or the frictional forces
ST min: it is minimum stiffness used in the interface .this is recommended when the contact elements are to smooth . and recommended when the elements deformation is high then the recommended value
I del : decides the behaviour master and slave nodes when the elements corresponding gets deleted
In act: it is used to check and sort out the initial penetration in the elements .it also used additional energy to drag the penetrated element which is accounted in the energy errors
(here , it avoids the contact when the elements corresponding gets deleted )
Recommended values
I gap =2
Gap min =0.5
I stiff = 4
I form = 2
ST min =1000N/mm
I del =2
In act = 6
Type 11(element to element )
here, the penetration between the elements occurs in form of the edge lines either in truss or the beam elements
this interface is used to overcome the defects of type 7 contact
recommended values are similar to the type 7 and the mathematical algorithm used In the type 11 is complex and time taking process
procedure
1.meshing the bumper assembly
- import the component into the data base using the import tool
- (import tool >select the file >import >ok)
- geometrical are sorted out for the model using the quick edit tools
- (quick edit >select the surfaces >add point >join the surfaces >ok)
- done meshing the component using the mesh tab
- (2d>select the area >size 6 >mesh >ok)
- 1d rigid connections are given between the elements where the gap is found
- (1d>rigids>RBE2>select the element by path >to >select the elements>create)
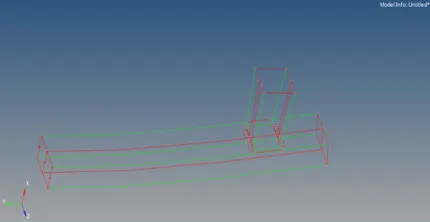
Before the geometry edit
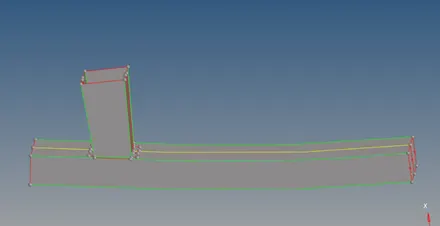
After geometry edit
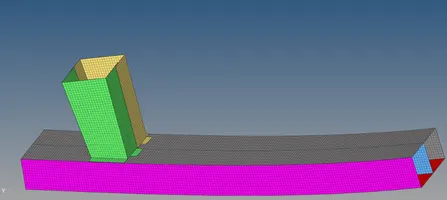
After meshing
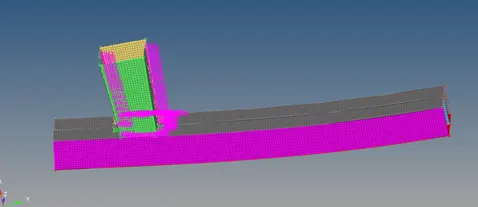
After deploying connections
2.case 1
- Import the crash tube 0000.rad file
- (import >select the file from pc >ok)
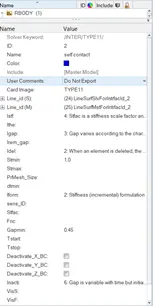
- Check the interface tab check the values for the type7 card
- (solver>inter>type 7>check values>save)
- Run the stimulation as the values recommended
- (analysis>radios>case 1crashtube_0000.rad>ok)
- Inact = 0(default value )
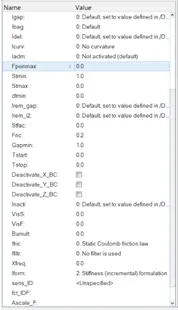
Fig Interface card(type7)
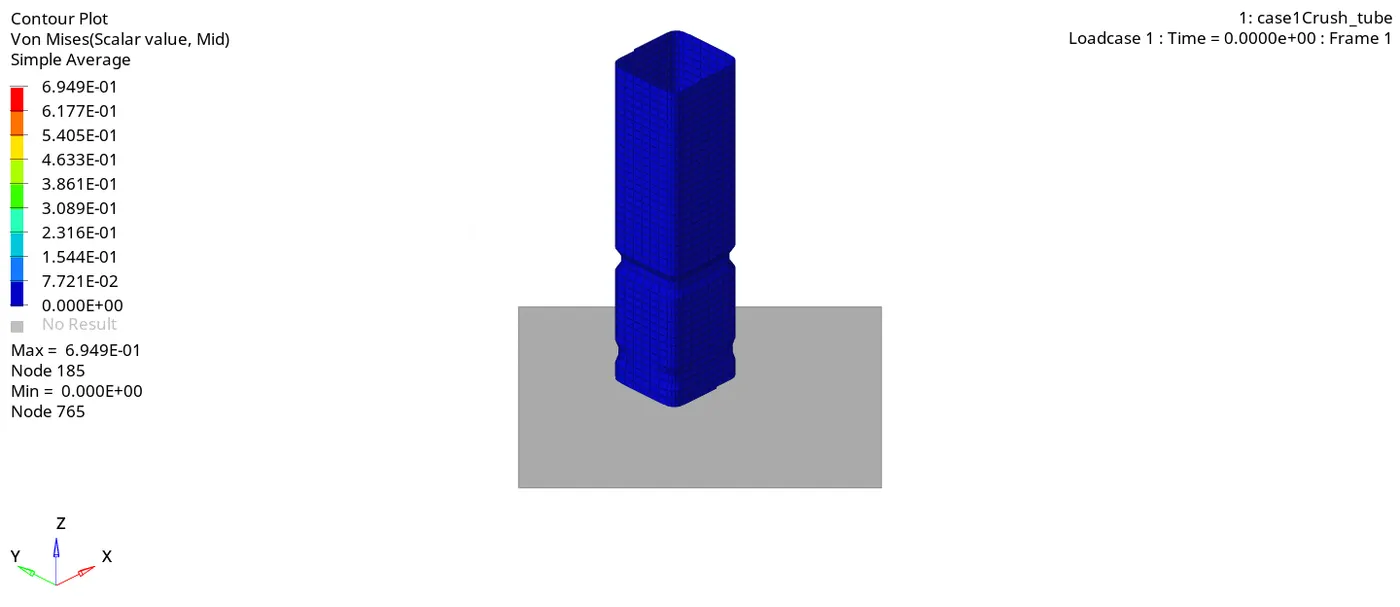
- The model is viewed in the hyper view for the addressing the maximum and the minimum stress point
- (hyperview>import>select the h3d file>ok)
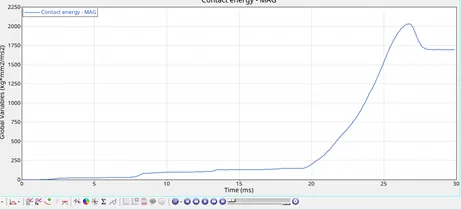
- Plotted the graphs between the mag vs energies
- (hypergraph 2d>select the to1 file>import>ok>global varibles>select the ke , ie , he , ce>mag>apply)
- Graph between the rigid walls and the time
- (rwall forces >time >ok)
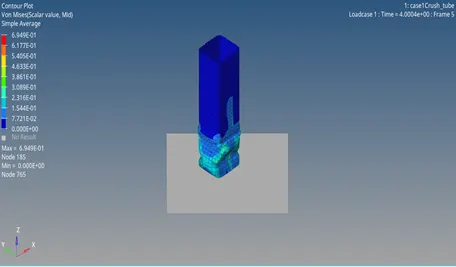
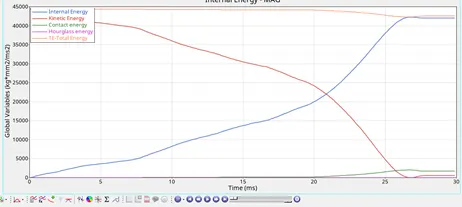
hyper view image showing maxmium stress point image showing all the energies
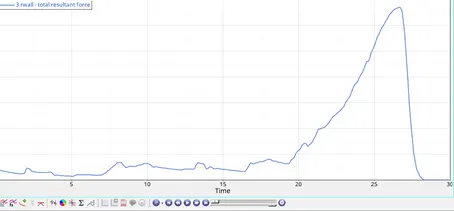
rigid wall forces contact energy
Observations
When the shock wave is allowed through the elements as the velocity goes on decreasing by the displacement the KE also gets decreases which tends to increase in the internal energy to balance the total energy
From the contact forces graph , it is absorbed that elements are deformed maximium upto maximum stress point and starts decreasing and it is maintained stable after the particular point
From the hyper view , the maximum stress is found that
Case 2
- Import the crash tube 0000.rad file
- (import >select the file from pc >ok)
- Check the interface tab check the values for the type7 card
- (solver>inter>type 7>check values>save)
- Run the stimulation as the values recommended
- (analysis>radios>case 1crashtube_0000.rad>ok)
- Inact = 6(which creates the addional gap if the elements are penetrated .)
- Fig Interface card(type7)
- The model is viewed in the hyper view for the addressing the maximum and the minimum stress point
- (hyperview>import>select the h3d file>ok)
- Plotted the graphs between the mag vs energies
- (hypergraph 2d>select the to1 file>import>ok>global varibles>select the ke , ie , he , ce>mag>apply)
- Graph between the rigid walls and the time
- (rwall forces >time >ok)
-
hyper view image showing maxmium stress point image showing all the energies
contact energy rigiidwall forces
Observations
When the shock wave is allowed through the elements as the velocity goes on decreasing by the displacement the KE also gets decreases which tends to increase in the internal energy to balance the total energy
From the contact forces graph , it is absorbed that elements are deformed maximium upto maximum stress point and starts decreasing and it is maintained stable after the particular point
From the hyper view , the maximum stress is found that
Comparsion of case 1 and case 2
- All the plotted graphs and energies are found similar in case 1 and case 2 although the inact is changed it is because there are no intimal penetrations found in the elements
Case 3 (creation of the type 11)
- Import the crash tube 0000.rad file
- (import >select the file from pc >ok)
- Create the interface card
- (Solver>INTER >create>card>type 11 >enter the recommended values >selec the slave and master nodes>by components>select component >ok)
- Run the stimulation as the values recommended
- (analysis>radios>case crashtube_0000.rad>ok)
- The model is viewed in the hyper view for the addressing the maximum and the minimum stress point
- (hyperview>import>select the h3d file>ok)
- Plotted the graphs between the mag vs energies
- (hypergraph 2d>select the to1 file>import>ok>global varibles>select the ke , ie , he , ce>mag>apply)
- Graph between the rigid walls and the time
- (rwall forces >time >ok)
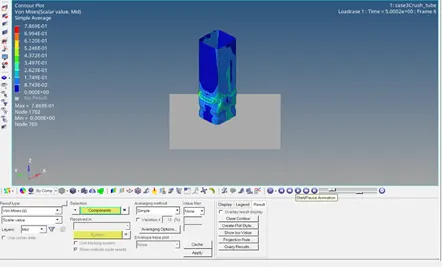
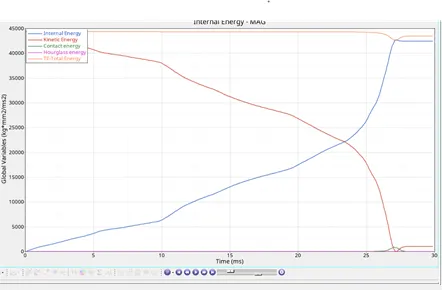
hyper view image showing maxmium stress point image showing all the energies
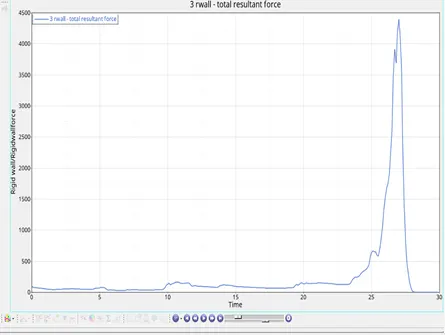
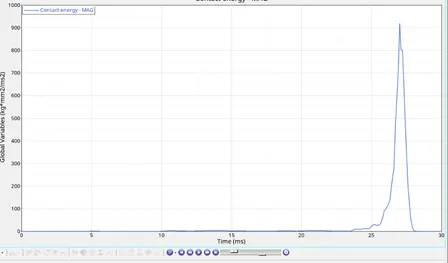
rigidwall forces contact energy
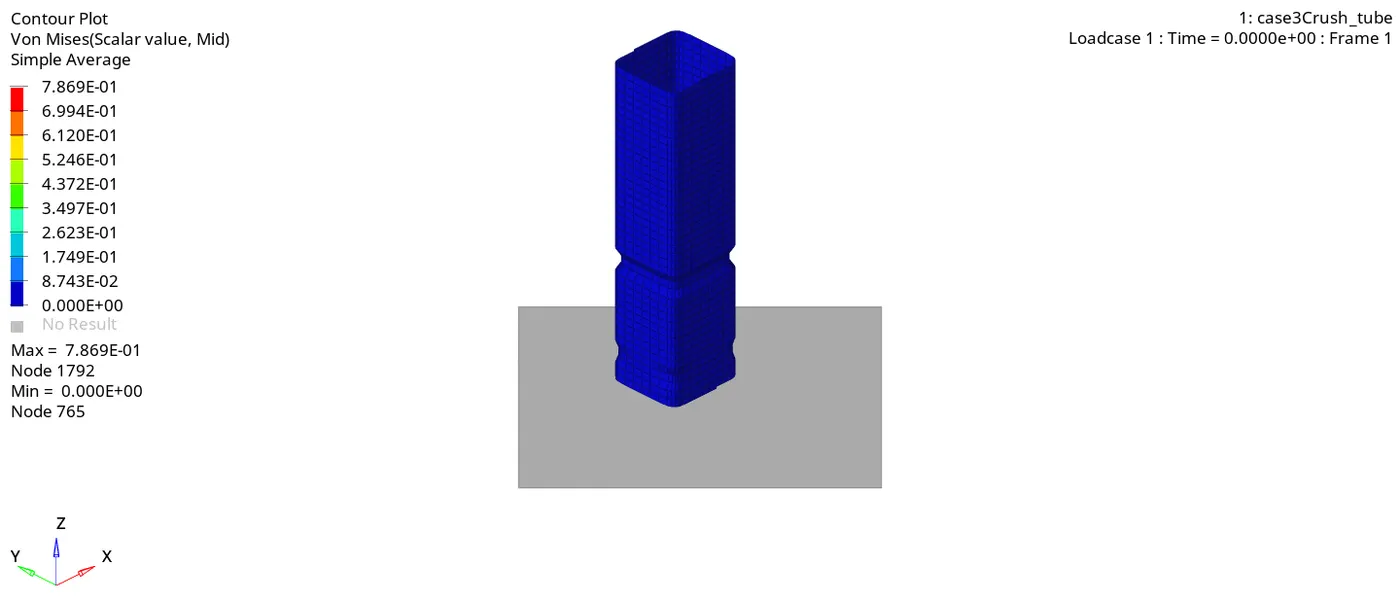
animated image of case3
Observation
Here, the stress energy is found maximum compared to the above case s which is found due to the additional contact forces happened . this additional forces are due to the addressing the additional penetrations happening
Comparision of case 1 and case 3
Here, in the type 11 contact forces are seen high due accounting the more penetrations
Stress energy is also found slightly in the case 3
Case 4 (no notches )
- Import the crash tube 0000.rad file
- (import >select the file from pc >ok)
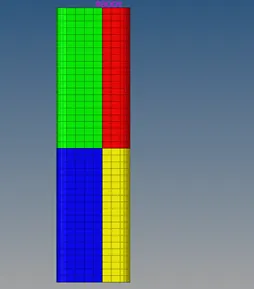
- notches are eliminated by using the align tool (f7)
- (align >select the parent nodes >select the notch nodes >align>ok)
- Run the stimulation as the values recommended
- (analysis>radios>case crashtube_0000.rad>ok)
- The model is viewed in the hyper view for the addressing the maximum and the minimum stress point
- (hyperview>import>select the h3d file>ok)
- Plotted the graphs between the mag vs energies
- (hypergraph 2d>select the to1 file>import>ok>global varibles>select the ke , ie , he , ce>mag>apply)
- Graph between the rigid walls and the time
- (rwall forces >time >ok)
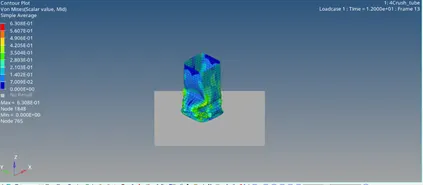
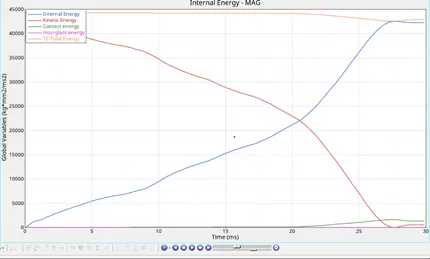
hyper view image showing maxmium stress point image showing all the energies
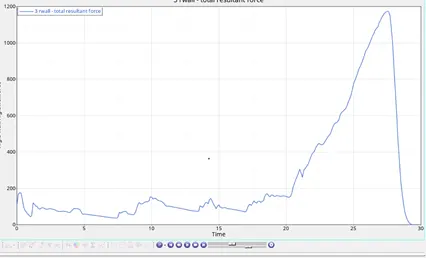
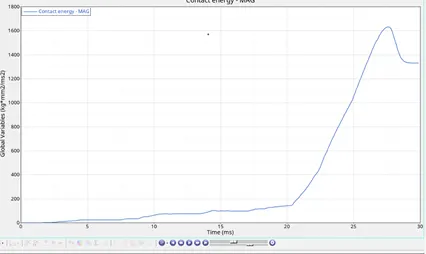
rigidwall forces contact enrgy
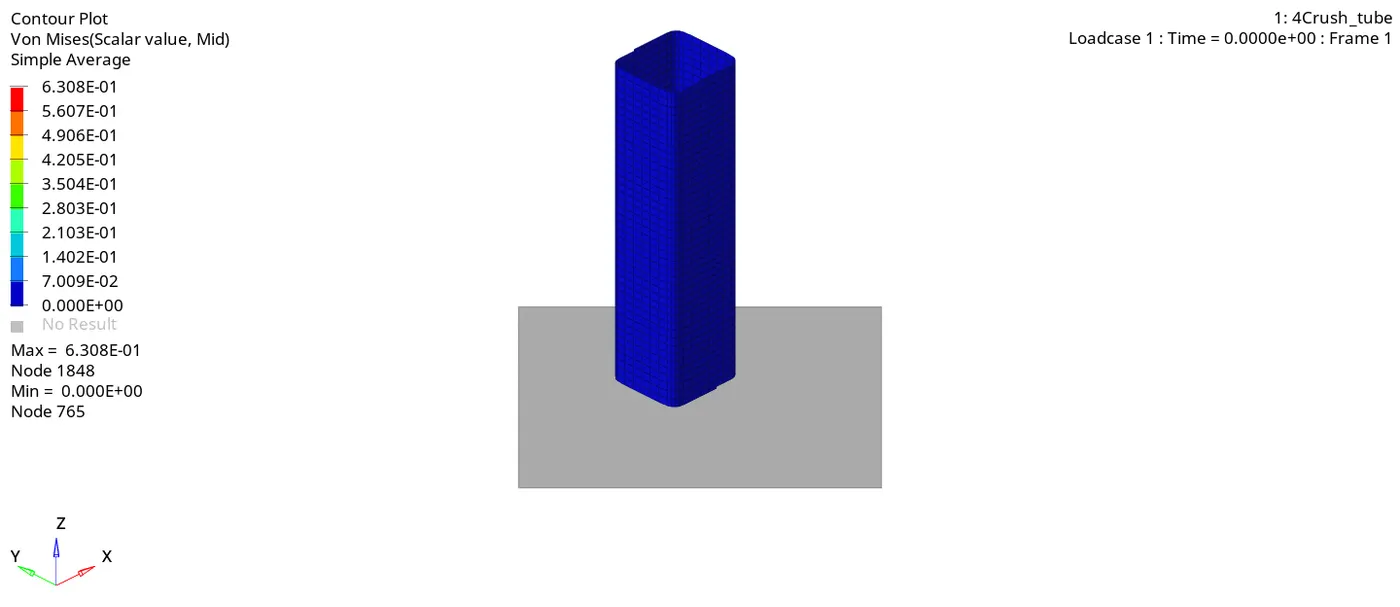
animated image of case 4
Observation
As there is no notches on the geometry the load applied is linearly distributed through the elements equally
From the contact forces graph it is displayed that the energy curve is increased in a step by step procedure
Comparision of case 4 and case 1
From the contact forces graph there is variation in the curve dor the same material card due to the absence of the notches
As there are no notches present the energy is equally distributed throught the flat surface
Case 5(create the notches at the middle )
- Import the crash tube 0000.rad file
- (import >select the file from pc >ok)
- Notches are created in this case using the translate tool
- (tools>translate>select the nodes .select the axis in the direction of the depth >value =>ok
- Run the stimulation as the values recommended
- (analysis>radios>case crashtube_0000.rad>ok)
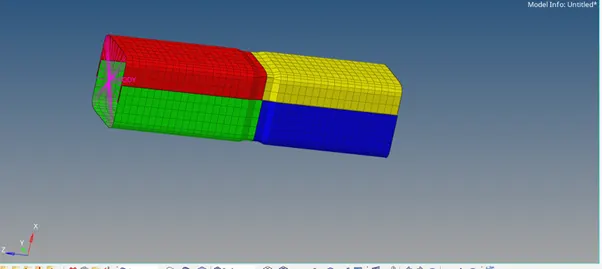
- The model is viewed in the hyper view for the addressing the maximum and the minimum stress point
- (hyperview>import>select the h3d file>ok)
- Plotted the graphs between the mag vs energies
- (hypergraph 2d>select the to1 file>import>ok>global varibles>select the ke , ie , he , ce>mag>apply)
- Graph between the rigid walls and the time
- (rwall forces >time >ok)
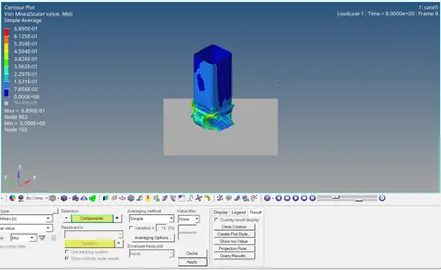
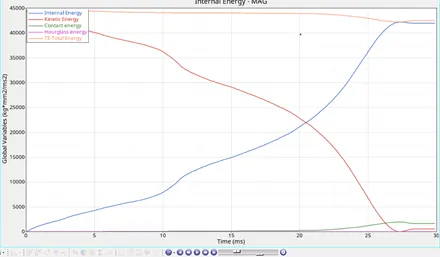
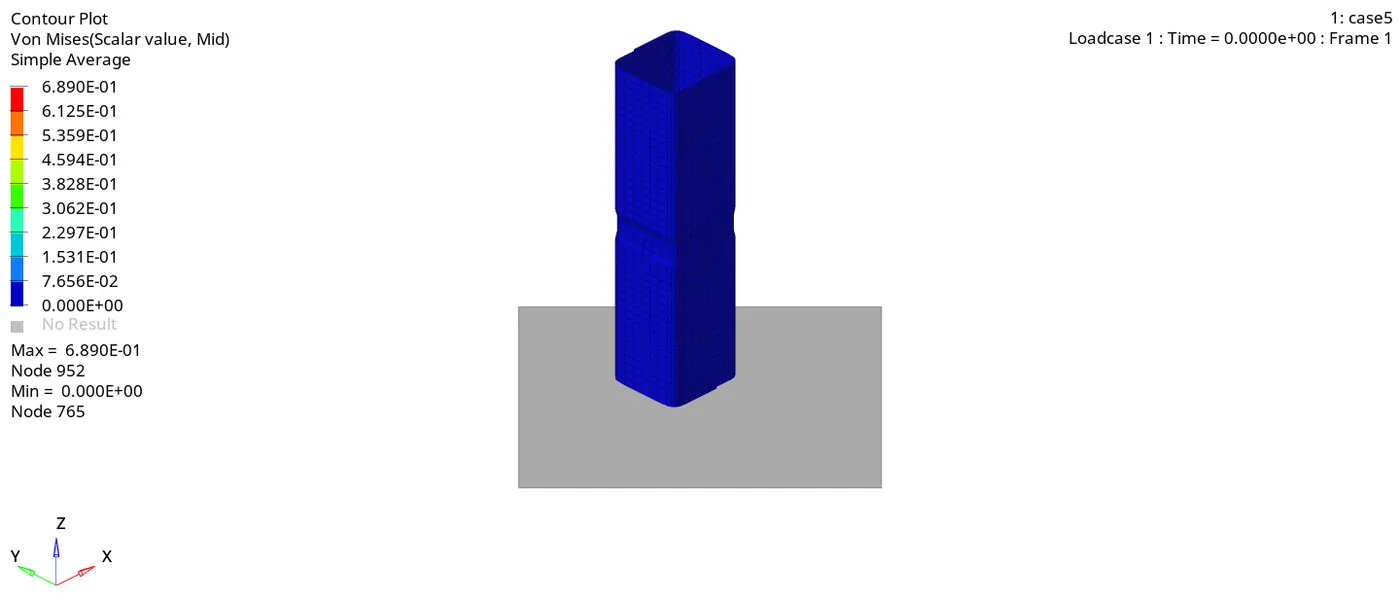
hyper view image showing maxmium stress point image showing all the energies
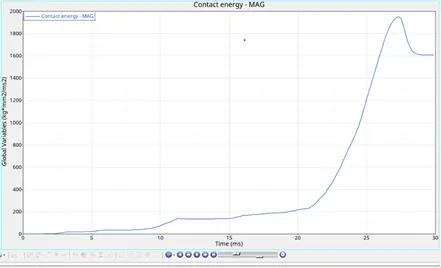
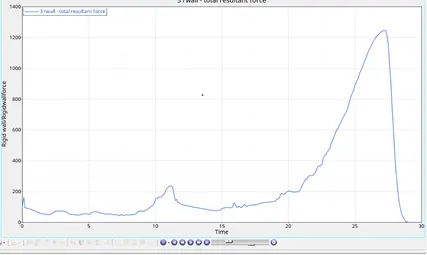
contact energy rigidwall forces
Case 6(notches on the opposite faces )
- Import the crash tube 0000.rad file
- (import >select the file from pc >ok)
- Notches are created in this case using the translate tool
- (tools>translate>select the nodes from opposite faces.select the axis in the direction of the depth >value =>ok
- Run the stimulation as the values recommended
- (analysis>radios>case crashtube_0000.rad>ok)
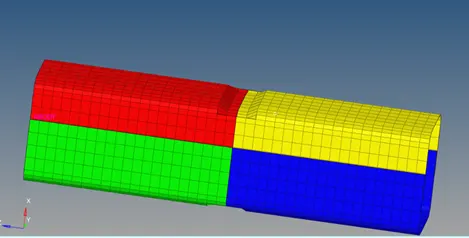
- The model is viewed in the hyper view for the addressing the maximum and the minimum stress point
- (hyperview>import>select the h3d file>ok)
- Plotted the graphs between the mag vs energies
- (hypergraph 2d>select the to1 file>import>ok>global varibles>select the ke , ie , he , ce>mag>apply)
- Graph between the rigid walls and the time
- (rwall forces >time >ok)
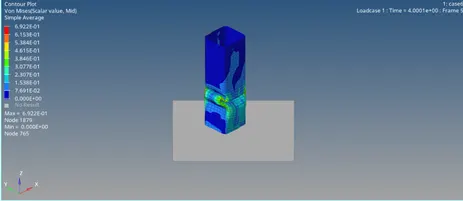
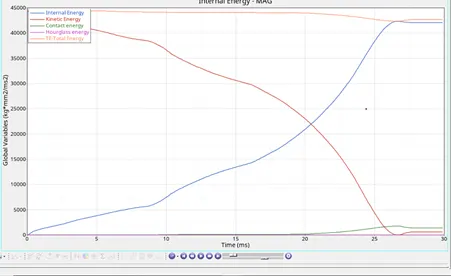
hyper view image showing maxmium stress point image showing all the energies
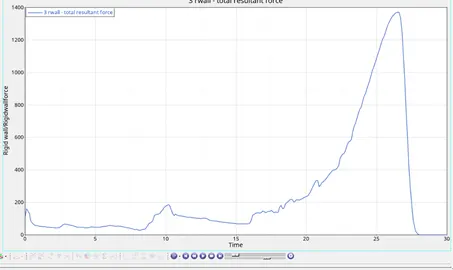
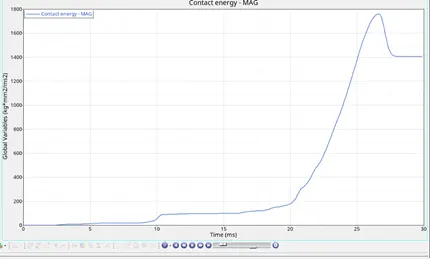
rigid wall forces contact energy
Comparision of case 4,5 and 6
When there are no notches the energy is flowed linearly which is quite opposite in the in case 5 , 6 in th 5, 6 the elements are deformed from the notches present in the component . here it also effects the length of the component in case 4 the length is slightly high compared to 5 and 6
Compared to case 4 and 5,6
We can find rigid wall forces are high in case 6 due to the maximum penetration of elements due to the notches on the opposite faces
Due to the notches there are also increase in the velocity which tends to penetrate to maximum number of the elements
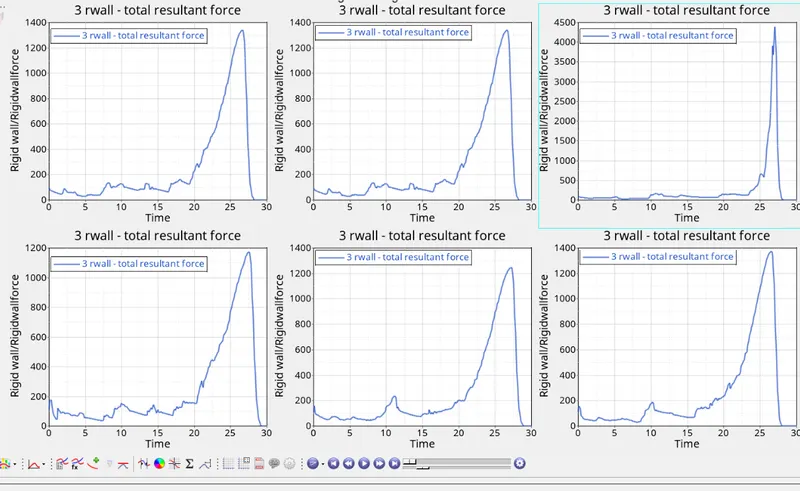
above image showing the rigidwall forces of all the cases
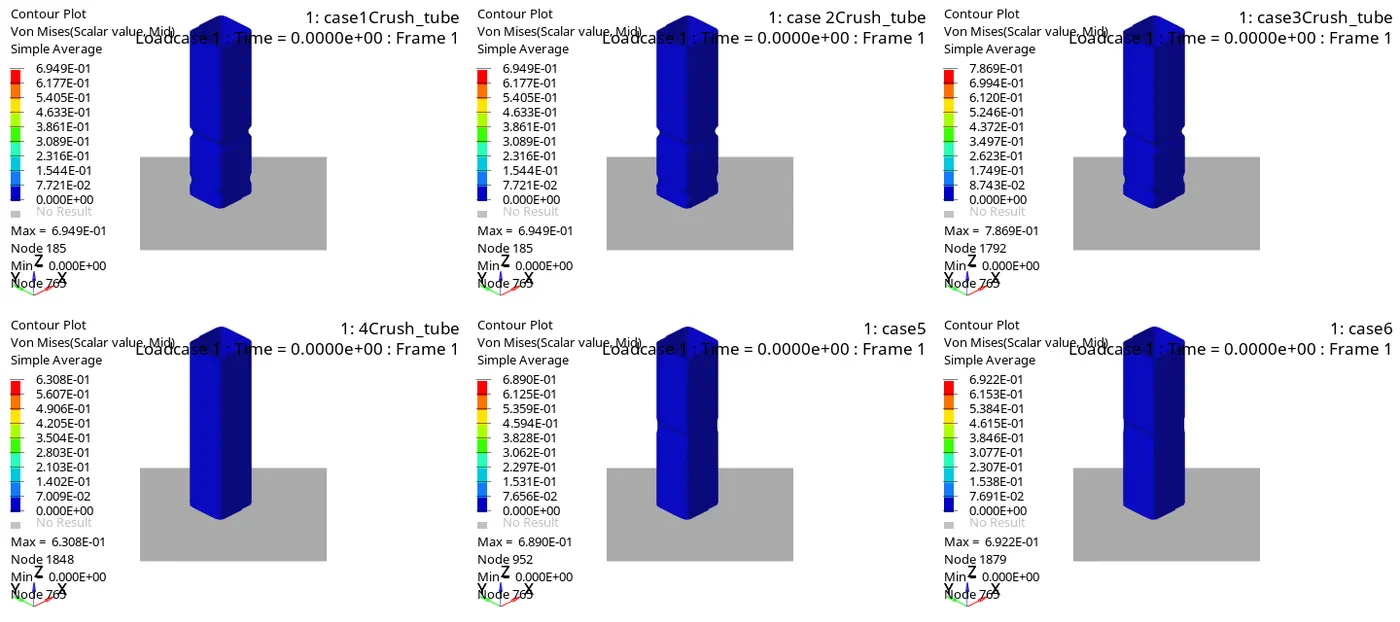
animated image of crash tube all cases
Outcomes:
- In the part 1 learnt how to mesh the bumper assembly and deploy the connection in the required area
- In the part 2 how to stimulate the component using the different interfaces by varying the dependent variables
- How to plot the energy graphs
- View the 3d animated diagrams in the hyperview