Interfaces & Study of Effect of Notches in RADIOSS
OBJECTIVE
- To mesh the bumper assembly, with the mesh size of 6 mm.
- To simulate the crash tube model as it is.
- To change the Inacti = 6, and run the simulation,
- To create the type 11 contact, and run the simulation.
- To remove the notches, remove the boundary condition on the rigid body node, and then run the simulation.
- To create a new notch in the middle, select the whole section and run the simulation.
- To create a new notch with nodes only from opposing two faces, and run the simulation.
MODEL 1
The first objective of the challenge was to mesh the bumper model. Fig. 1 shows the cad model of the bumper.
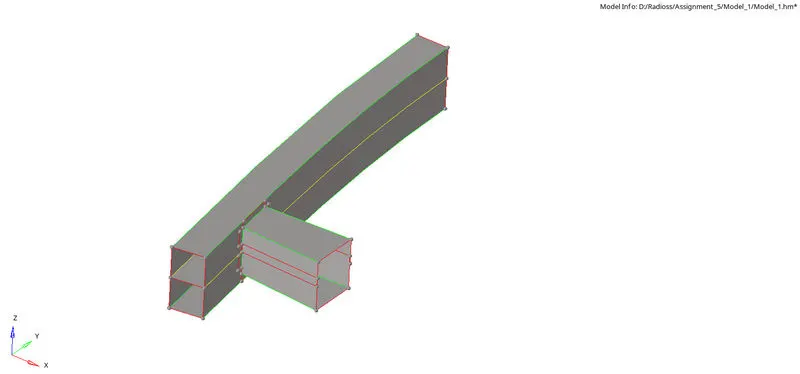
Figure 1: CAD model of the bumper.
The cad model was a midsurface of the bumper model. Thus, extraction of midsurface was not required. The model had some geometrical errors. Thus using line-editing and surface-editing tools, available on the Geom page, the errors were corrected.
Before starting the meshing of the model, using Preferences → Criteria File Settings, the target element size was set to 6. Then, using 2D → automesh, one-by-one, all the components of the bumper assembly were meshed, as shown in fig. 2.
Figure 2: 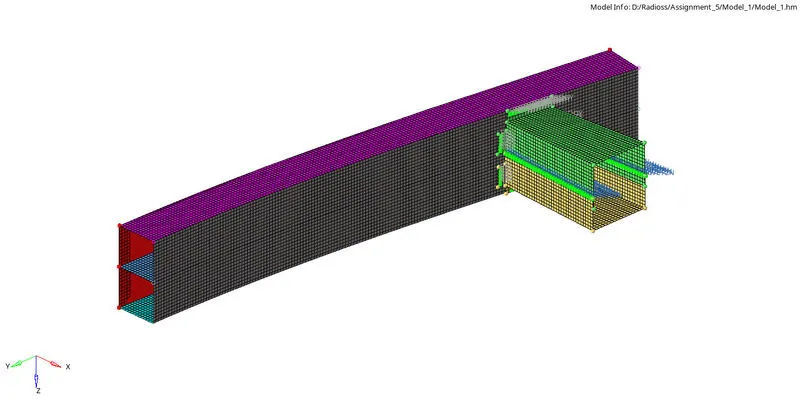
The crash box model of the bumper assembly is composed of two separate components. Logically, those must be bent sheets, which must be seam-welded, while manufacturing. Thus, using 1D → connectors → seam, the seam weld elements were created between those two components, as can be seen in fig. 3. The type of weld element was selected as ‘weld’.
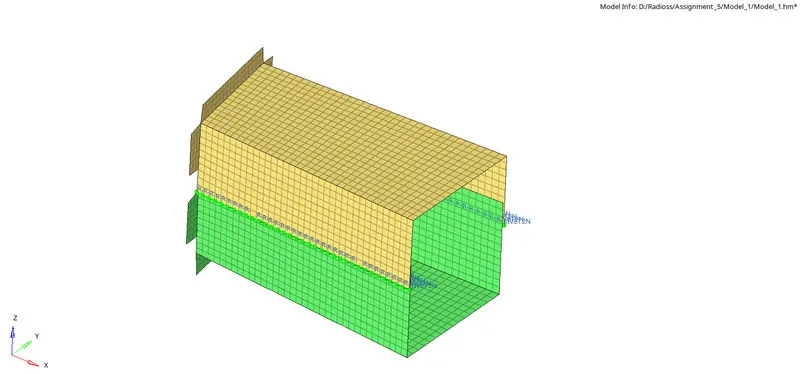
Figure 3: Seam weld connectors defined between two components, of crash box.
MODEL 2
Case 1
In the first case, the simulation of the crush-tube model had to run with the already applied properties. The Von-Mises contour of the model can be seen in the figure below.
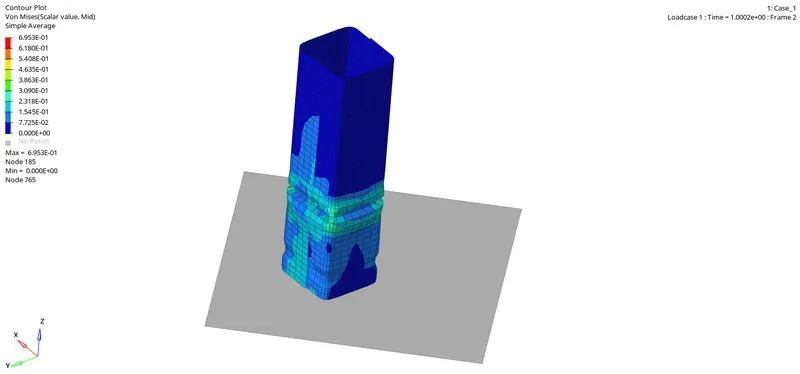
Figure 4: Von-Mises contour of the case 1.
Observing the simulation, it was found that the notches available in the tube getting crushed earlier than the rest of the areas of the tube. To observe the scenario more clearly, the rigid wall forces, internal energy, and contact energies were observed.
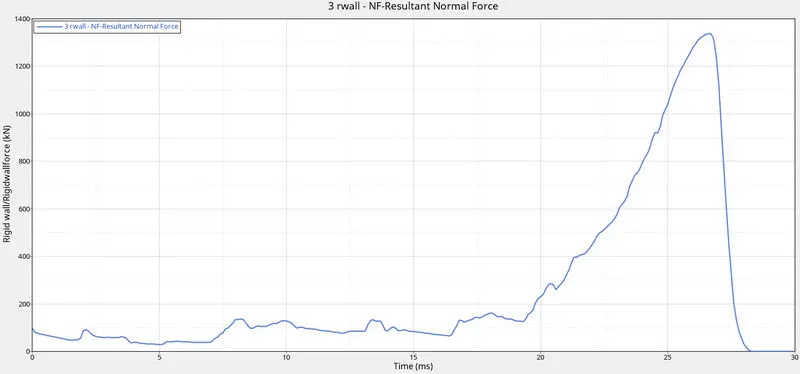
Figure 5: Plot of rigid-wall forces vs. time for case 1.
From fig. 5, it can be observed that the normal forces on the rigid were minimum until all the applied forces were getting absorbed by the crush tube. Once the crush tube was crushed completely, the normal forces on the rigid wall started rising.
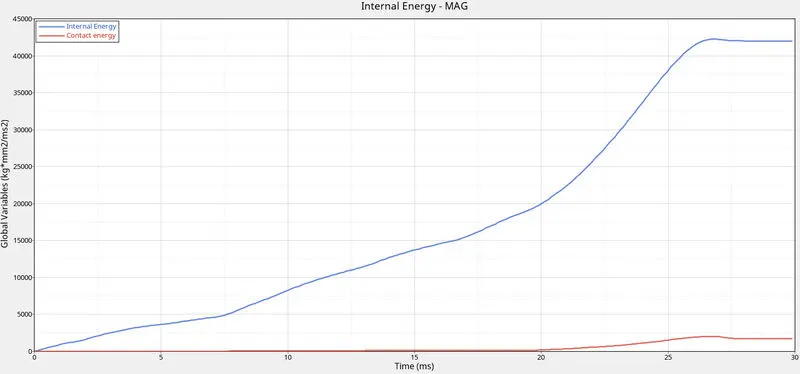
Figure 6: Plot of internal energy, and contact energy vs. time, for case 1.
A similar scenario can be observed in the plot of energy vs. time. The internal energy is the function of displacement. As the load is applied, it started deforming the elements and thus displacing the nodes. And therefore, deforming elements started developing internal energy, until their deformation was completely stopped (when the crush-tube model was completely crushed). When the crush-tube model was completely crushed, at that instant the contact between elements started increasing, as can be seen in fig. 6.
Case 2 (Inacti = 6)
In the second case, a change has been made in the interface property. The value of Inacti was changed to 6. Now, Inacti is the flag that allows to relax from initial penetration. In type 7 of an interface type, when a gap is defined around the master surface and slave nodes, if the nodes of the slave are inside the gap region of the master and/or vice-versa, it is called initial penetration. This initial penetration develops an error in the results; thus, it is always good to not have any initial penetration or intersections. Keeping Inacti = 6, it de-penetrates the model by moving the node slightly, and the gap is going to be varied with time.
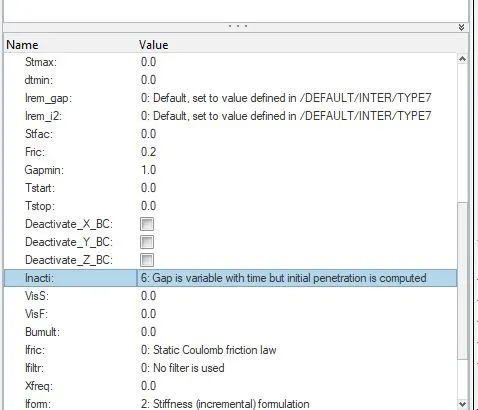
Figure 7: The Inacti was changed to 6 to de-penetrate the model.
Figure 7 shows that the Inacti has been changed in case 2 of simulation.
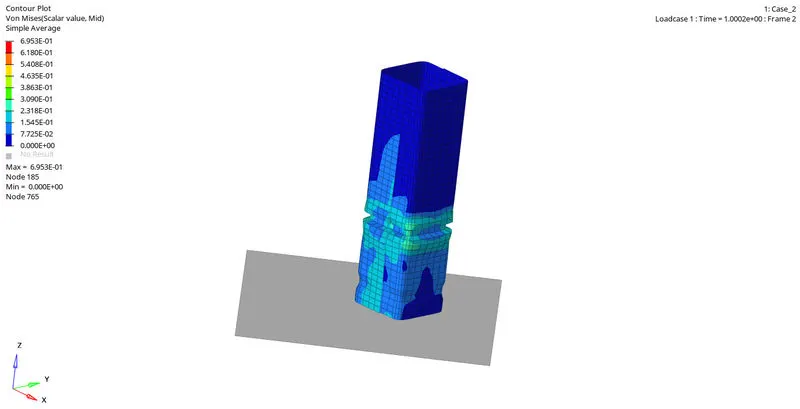
Figure 8: Von-Mises contour of the case 2.
The Von-Mises contour of the crush-box model shows that as soon as the load is applied to the model, the notches present on the model get deformed firstly. After notches get crushed by the applied load, then the plane area gets crushed.
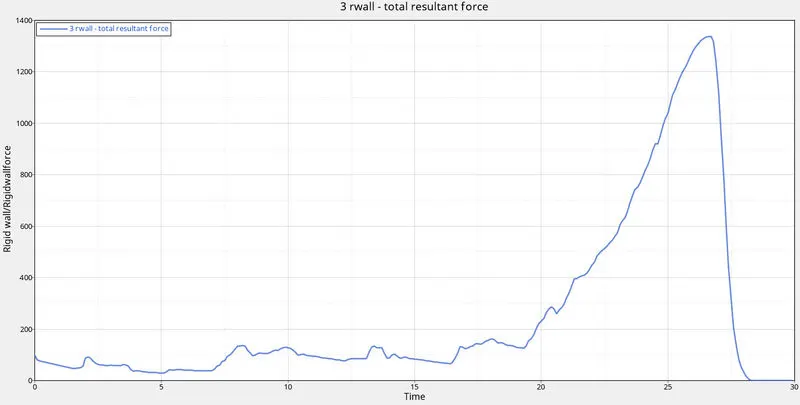
Figure 9: Plot of rigid-wall forces vs. time for case 2.
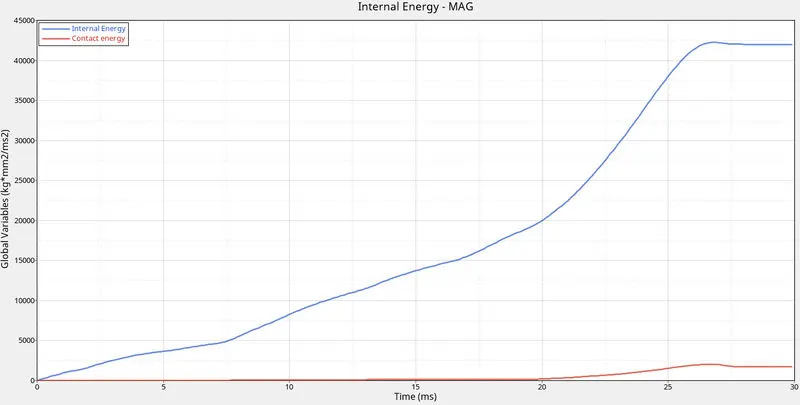
Figure 10: Plot of internal energy, and contact energy vs. time, for case 2.
The plot of rigid wall vs. time, fig. 9, and the internal and contact energy vs. time, fig. 10, is similar to case 1. Thus, no change has been found.
It was expected that the initial penetration must be present in case 1, and can be visualized. It is because, when Inacti = 0, the gap remains constant. There were four components in the model viz. PSHELL1, PSHELL2, pshell_2mm, and pshell2_2mm. The first two components were of 3 mm thickness and the other two were of 2 mm thickness. In the case of the first two components, the variable gap = max {Gapmin, max(Fscalegap.(gs+gm), Gapmax} = max{1, (3/2)+ (3/2)}=3, and in the case of the other two components, it is equal to 2. The gap between two similar thickness components is 2.1. Now because 2 < 2.1, components with 2 mm thickness must not have any penetration, but the components with 3 mm thickness must have penetration. It is because, the variable gap is more than the available gap, which results in initial penetration.
Case 3: (Interface Type 11)
Interface type 7 is a general node-to-surface contact, however, in some cases an issue arises when the components actually intersect, but the minimum gap region of node and surface does not come in the each-others periphery. This is not the realistic scenario that is expected. In such cases, type 11 (edge-to-edge contact for any application) is a better option.
In case 3, the type 11 interface has been created, as shown below in fig. 11.
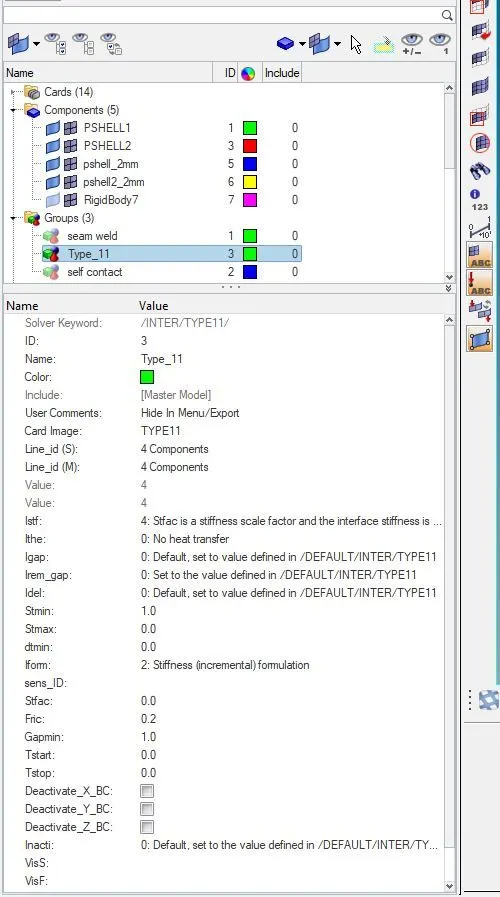
Figure 11: The type 11 interface has been created, for case 3.
The same values for interface 11 cards were maintained, as was available for earlier cases. The result can be seen in fig. 12.
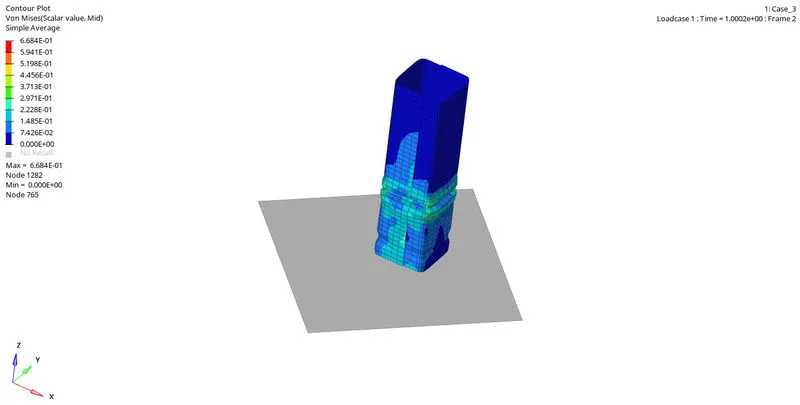
Figure 12: Von-Mises contour of the crush-tube model with type 11 interface.
The Von-Mises contour had shown no major difference. Thus, the simulation was observed on the rigid-wall, internal energy, contact energy vs. time plot, as can be seen in fig. 13, and fig. 14.
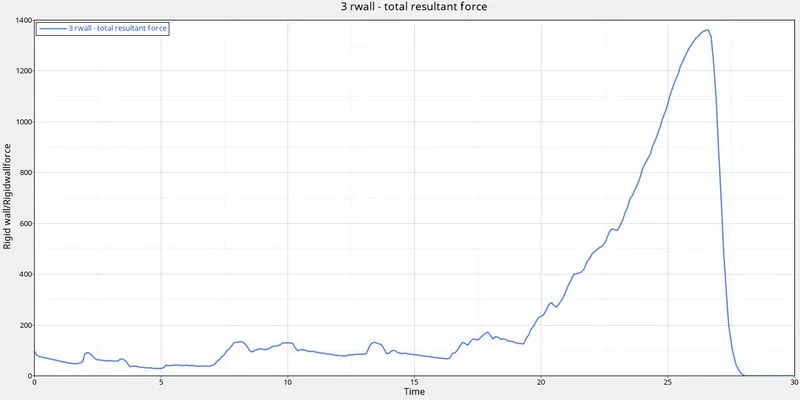
Figure 13: Plot of rigid-wall forces vs. time for case 3.
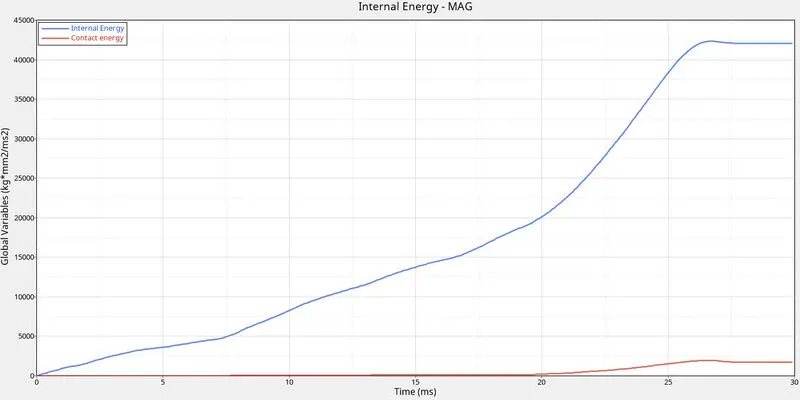
Figure 14: Plot of internal energy, and contact energy vs. time, for case 3.
Even the plots have not shown any major change in its behavior, probably because the intersection flaw of type 7 was not occurring in the earlier cases. However, the energy error increases slightly, and the simulation time was increased.
Case 4: (Remove notches and boundary conditions)
In case 4, the model was simulated by removing its notches, and its boundary condition. Figure 15 shows the crush-tube model with no notches on it.
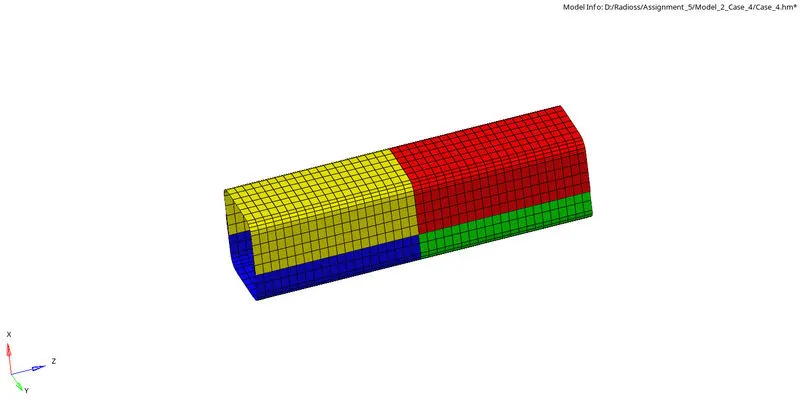
Figure 15: Crush-tube model with no notches.
The boundary condition was also deleted before performing the simulation. In the solver-deck, there’s a BCS component that had to be deleted to delete the boundary condition.
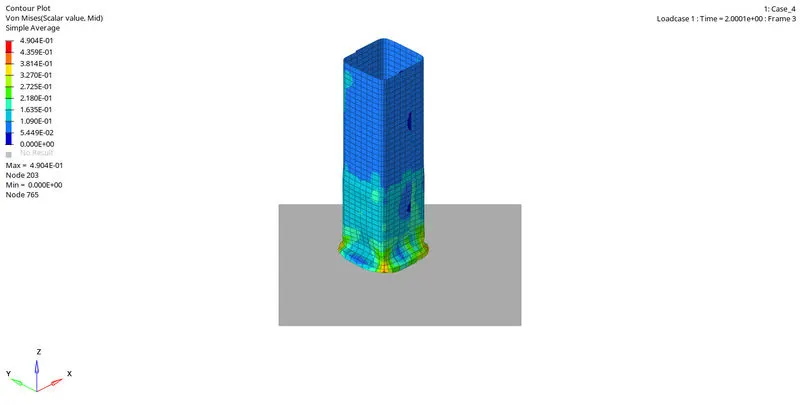
Figure 16: Von-Mises contour of the crush-tube model in case 4 conditions.
Fig. 16 shows the Von-Mises contour of the model. When the notches are removed, now the elements in contact with the rigid wall deforms earlier than other elements. Earlier, the notches were deforming than other elements.
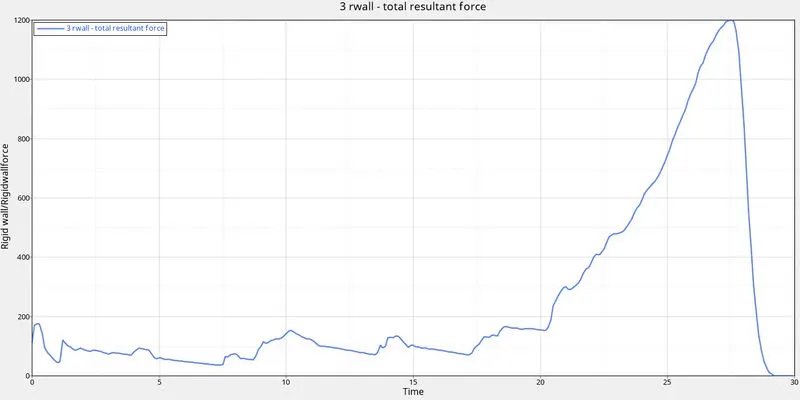
Figure 17: Plot of rigid-wall forces vs. time for case 4.
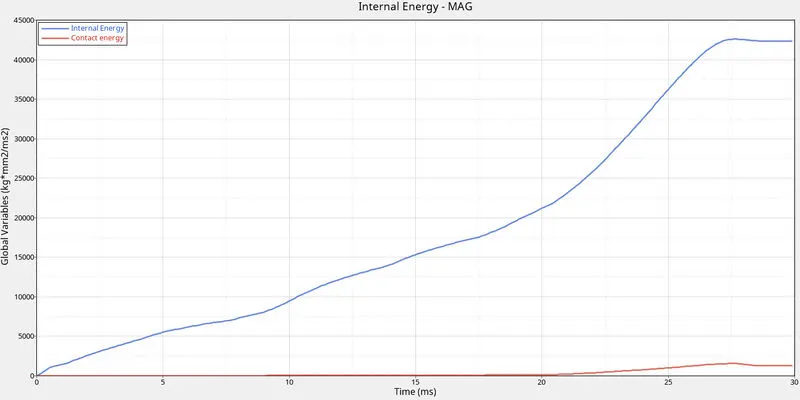
Figure 18: Plot of internal energy, and contact energy vs. time, for case 4.
From fig. 18 and fig. 19, the nature of the seemed to be similar to earlier cases, however, if it observed closely, the energy absorption capacity in case 4 has increased slightly. Earlier. The model was getting completely crushed before 27 ms but in case 4 there’s an improvement of 2 ms.
Moreover, the rigid wall force is also decreased to 1200, which was earlier above 1300.
Case 5: Creating the notch in the middle.
In case 5, using align option, the existed notches were removed, and using the translate option another notch was created in the middle, as can be seen in fig. 19.
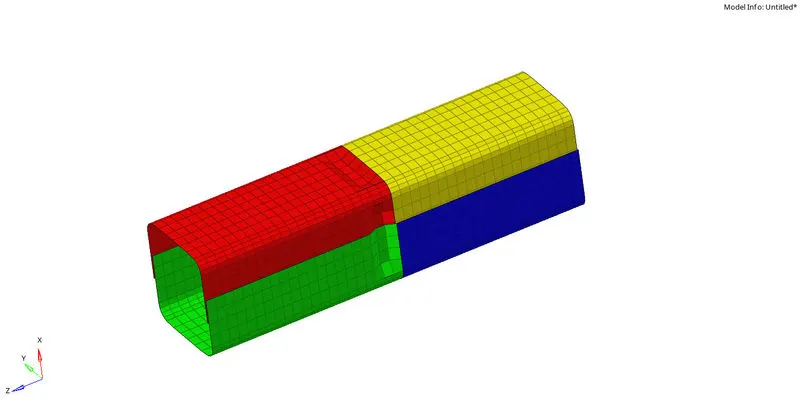
Figure 19: Notch created at the middle of the crush-tube.
The modified model was saved and simulated to see the changes that could occur.
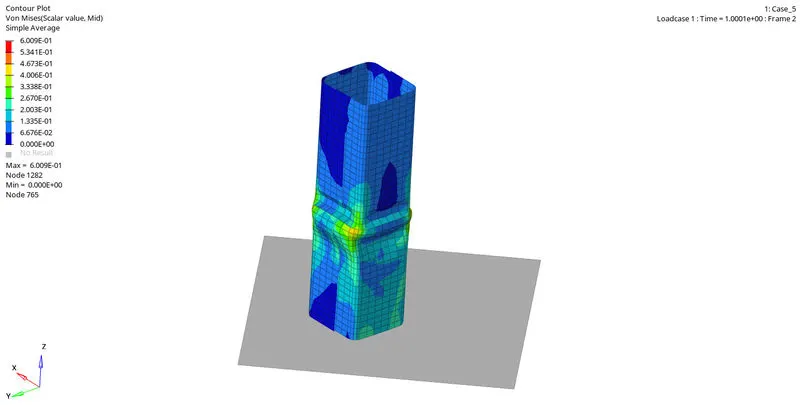
Figure 20: Von-Mises contour of the crush-tube model in case 5 conditions.
From fig. 19, it can be observed that the notch was created only on the plane area, and the bent area remained as it is. Thus, due to this inconsistency in the formation of the notch, the higher stress had firstly come on the bent region near the notch, and then it transferred to the other areas of the crushed model.
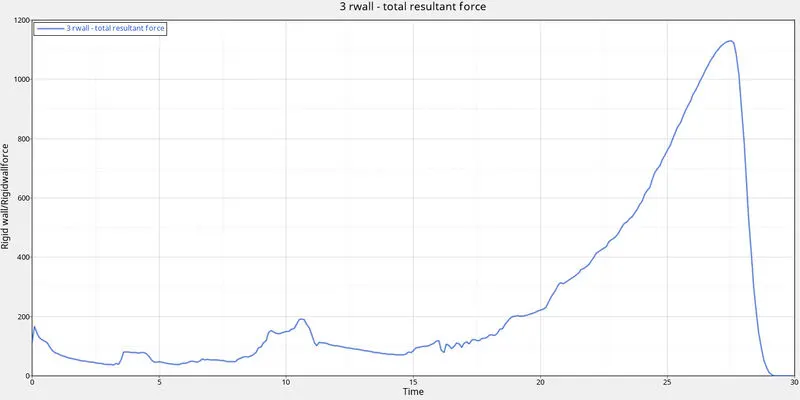
Figure 21: Plot of rigid-wall forces vs. time for case 5.
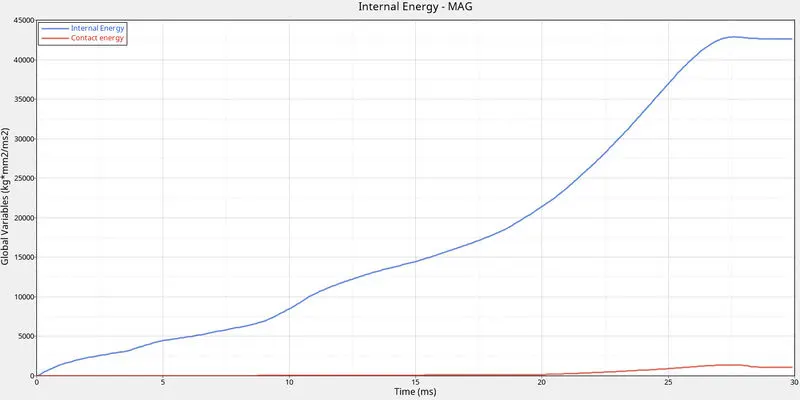
Figure 22: Plot of internal energy, and contact energy vs. time, for case 5.
In case 5, when the notch was made at the middle, the nature of rigid wall force, internal energy, and contact energy are almost similar, however, the rigid wall force reduced more than case 4. It is because the notch had come closer to the applied force, and thus energy was absorbed earlier. This is why, less energy remained to transfer to the rigid wall, and therefore, less force was exerted on it.
Case 6: (Only two opposite faced notches)
In case 6, two notches were created, on only two opposite faces, as can be seen in fig. 23.
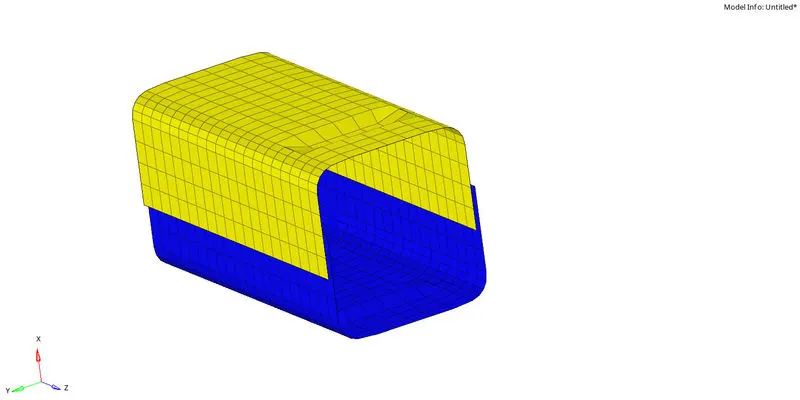
Figure 23: Two notches on opposite faces can be observed.
In fig. 24, it can be observed that, when there are only two notches present, the stress from the applied load comes on the corners of the notches, first. Then the load transfers to the rigid wall contact region, and that too present on the notch side face.
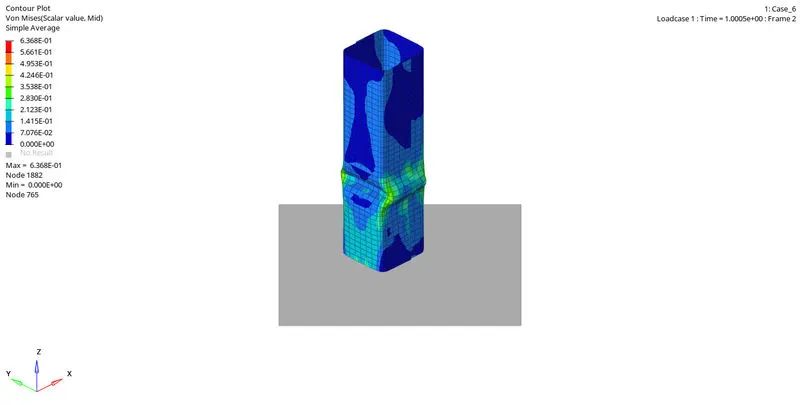
Figure 24: Internal energy vs. time plot for case 6.
In fig. 25, the nature of rigid wall force vs. time is similar to case 4.
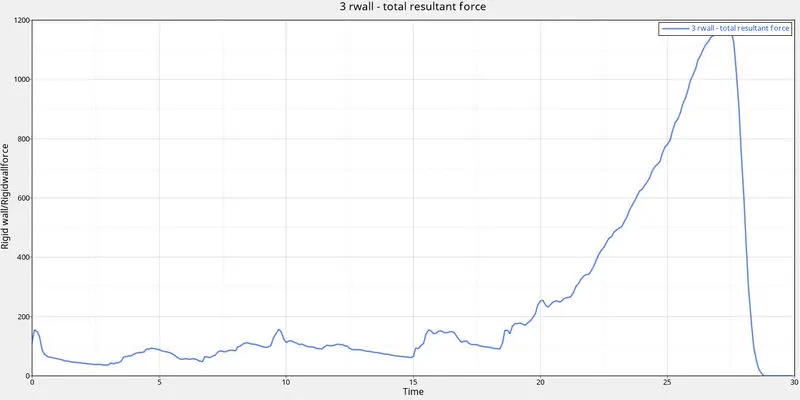
Figure 25: Plot of rigid-wall forces vs. time for case 6.
The nature of energies, in fig. 26 is also similar to case 4.
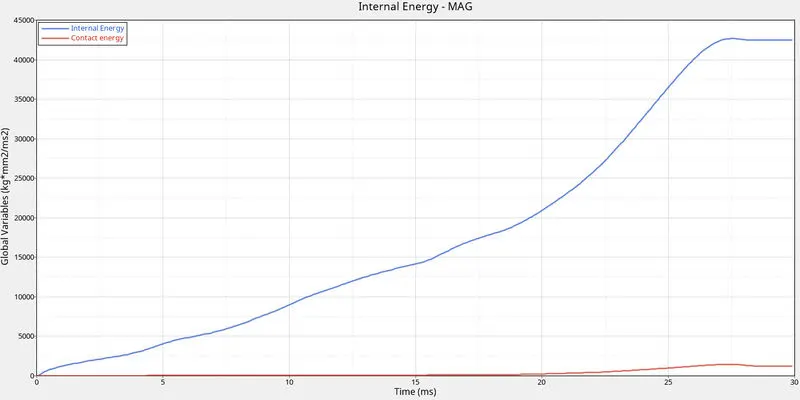
Figure 26: Plot of internal energy, and contact energy vs. time, for case 6.
RESULT AND DISCUSSION
In case 1, when the load was applied, the initial stress came on the notched zones. This led to less force transfer on rigid walls, and the energy was getting absorbed by the crushing model. As the absorption capacity of the model finished, the rigid wall force increased exponentially. Now, it was because the applied load was directly exerting on the rigid wall.
In case 2, the default value of Inacti changed to 6. Inacti = 6 is responsible for removal initial penetration. However, when the model was analyzed, no change was observed in it, as was expected.
In case 3, the interface type was changes to type 11(edge-to-edge), which was type 7 (node-to-surface), in earlier cases. In some cases an issue arises when the components actually intersect, but the minimum gap region of node and surface does not come in the each-others periphery. This is not the realistic scenario that is expected. In such cases, type 11 (edge-to-edge contact for any application) is a better option to utilize. In this simulation, no major difference was observed, but the increase in the total number of cycles and decrease in Von-Mises stress suggests that it is a more accurate result than case 1 and case 2.
In case 4, the notches were removed, and the boundary condition was also removed. Earlier, the model was constrained to only the z-axis. Now, in this case, the model had 6 degree-of-freedom. Due to the removal of notches, and the removal of constrained nature of boundary conditions, the stress coming from the applied load got distributed, and thus reduced substantially.
In case 5, the existing notches were removed, and the new notches were created in the middle of the crush-tube model. This change in position of the notch led to more distribution of the stress, and thus a decrease in the rigid-wall force. Along with that, there was also a less total number of cycles and less energy error.
In case 4, only two opposite-faced notches were newly made, and the other notches were removed. Thus, initially, the whole stress came on the corners of the notches. Rest, the nature of rigid-wall forces, and the energies remained similar to earlier cases.
|
Description |
Total Number of Cycles |
Energy Error |
Mass Error |
Simulation Time |
Max. VonMises Stress |
|
|
CASE 1 |
Run the model as it is. |
83469 |
-3.8% |
0.000 |
65.06 s |
6.953E-01 |
|
CASE 2 |
Inacti = 6 |
83469 |
-3.8% |
0.000 |
62.63 s |
6.953E-01 |
|
CASE 3 |
Interface Type 11 |
97683 |
-3.9% |
0.000 |
97.29 s |
6.684E-01 |
|
CASE 4 |
No notches and no boundary conditions |
78261 |
-3.0% |
0.000 |
56.49 s |
6.518E-01 |
|
CASE 5 |
Notch at middle |
84779 |
-2.5% |
0.000 |
63.27 s |
6.009E-01 |
|
CASE 6 |
Only 2 notches on opposite faces |
74779 |
-2.9% |
0.000 |
53.60 s |
6.368E-01 |
CONCLUSION
The crush-tube model was analyzed with 6 different cases. In some cases, it showed some changes in its behaviors of deformation, but overall, the nature of deformation was almost similar. This might be because of the size of the model, due to which, the change was not found clearly. This case can be observed by seeing the difference that came in the results of case 3, case 4, and case 5, where the energy error was -3.9%, -3.0%, and -2.5% respectively.