Assignment 5-RADIOSS Interfaces & Study of Effect of Notches Challenge
RADIOSS Interfaces & Study of Effect of Notches
AIM:
- Mesh the given bumper model with 6mm size.
- To run the crash tube model by using differnt types of contact interfaces.
OBJECTIVE :
- Plot the rigidwall forces, contact forces. internal energy and create TH/part for all parts and ccompare results for 7 cases.
- Reason of Change in internal energies.
- How Notch effect the results.
CASES AND ITS DATABASE:
- Run the crash tube model as it is.
- Change the Inacti=6 and run.
- Create the type 11 contact and run.
- Remove both notches and remove boundary condition on rigid body node then run.
- Create a new notch in the middle ,select the whole section and run.
- Create a new notch with nodes only from opposing 2 faces and run.
RADIOSS FILES :

SOFTWARE USED :
Explicit solver - RADIOSS
PROCEDURAL STEPS :
1) Mesh the Bumper assembly with 6mm size.
- First import the bumper assembly into the GUI.
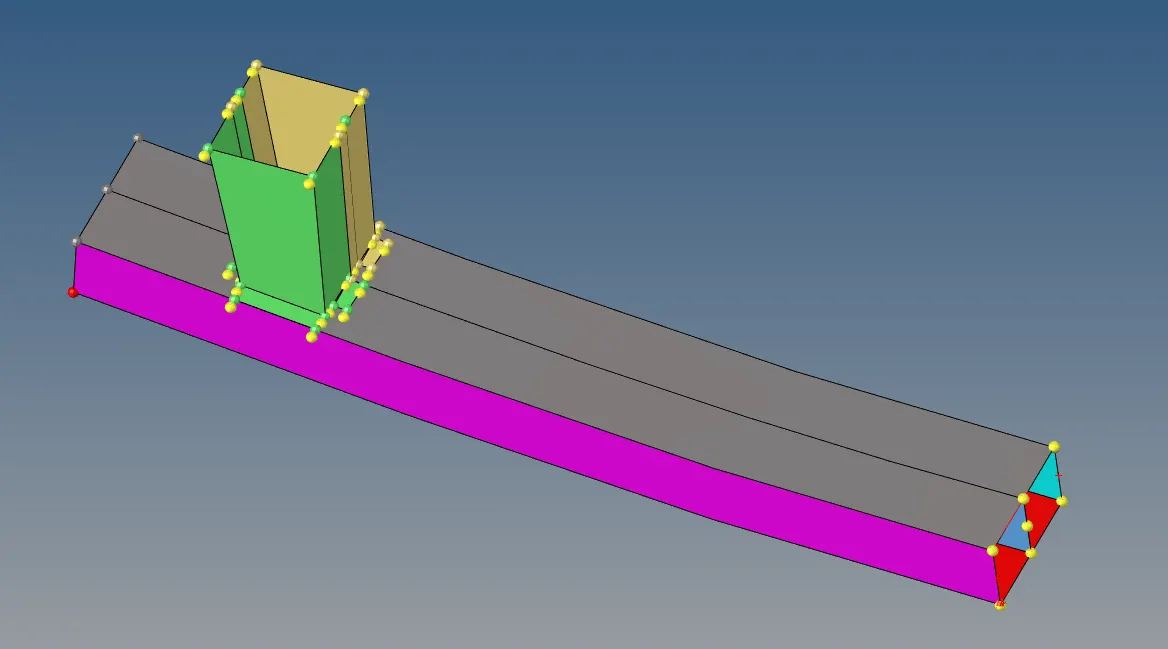
- Geometric cleanup of the model.
Before Geometric cleanup
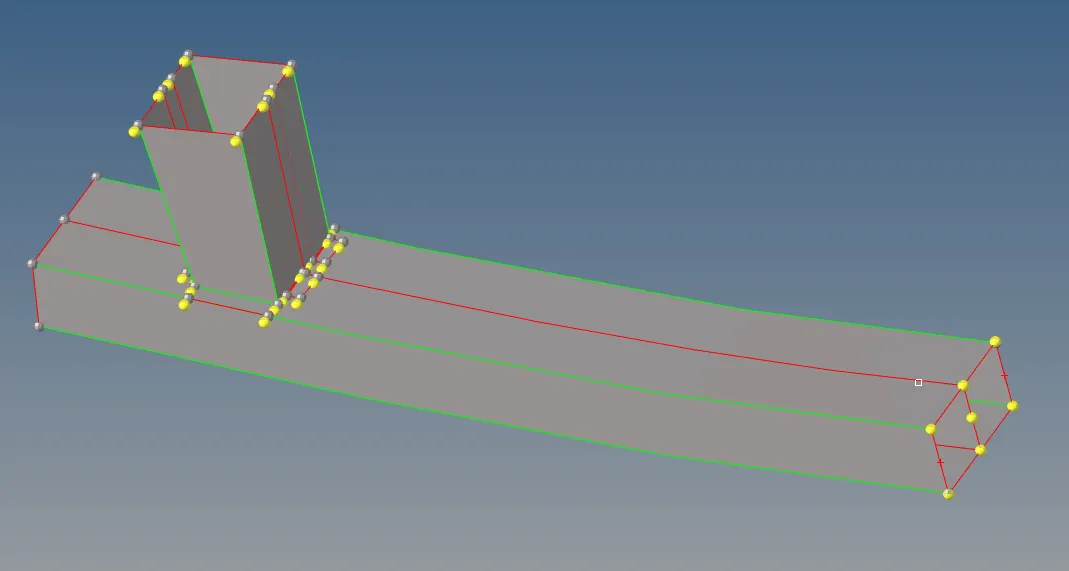
After Geometric cleanup
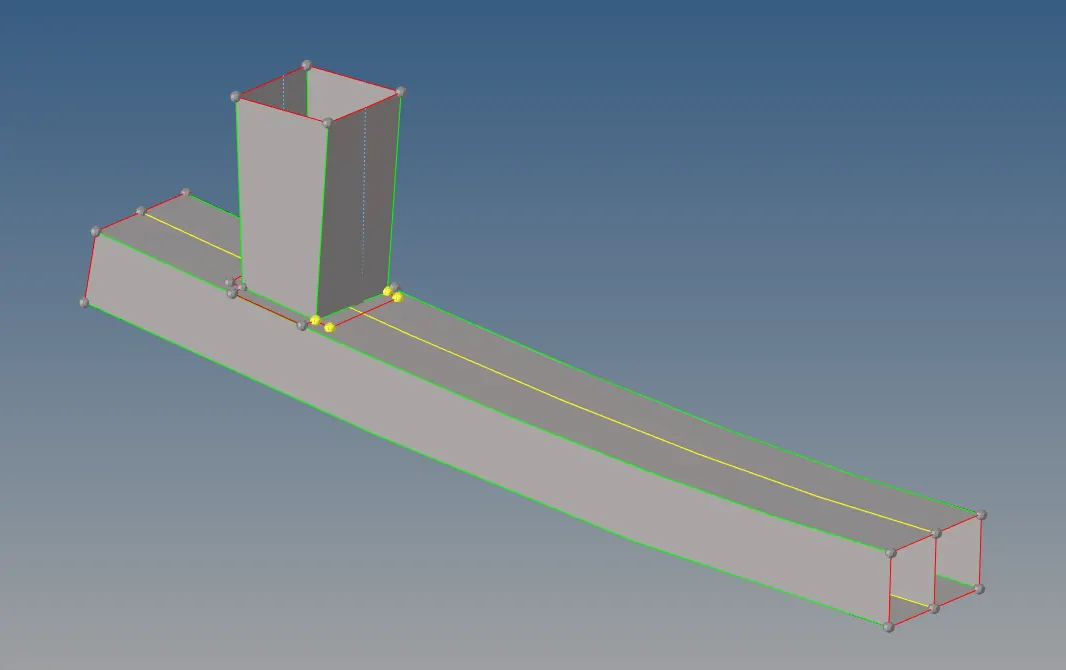
- 2D meshing of bumper model
To mesh,Go to 2D > Automesh Panel > Surfaces > Element size = 6mm > Mesh Type : Mixed > Check for align and size > Mesh.
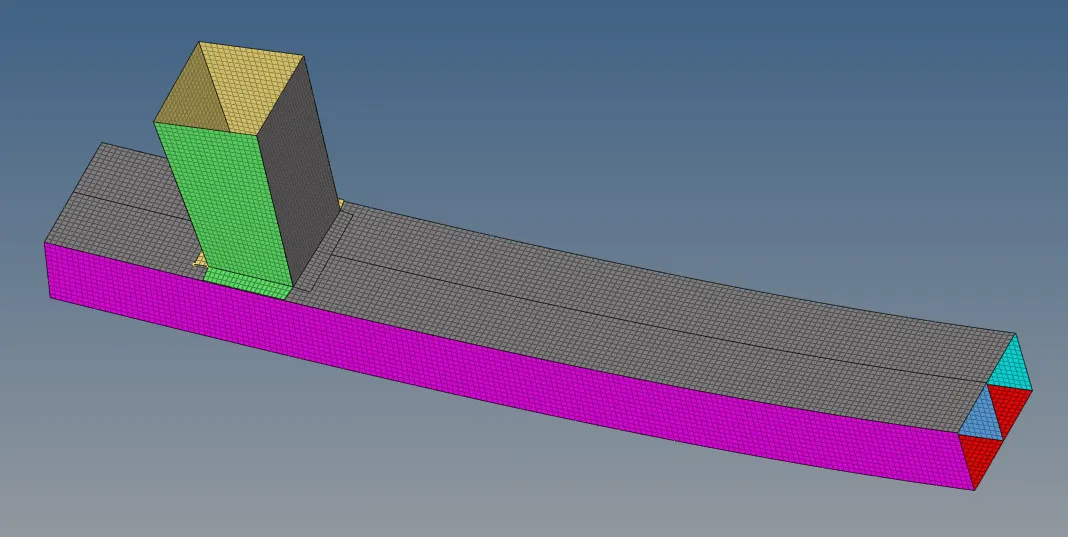
CASE ONE : Run the crash tube model as per default value.
PROCEDURAL STEPS :
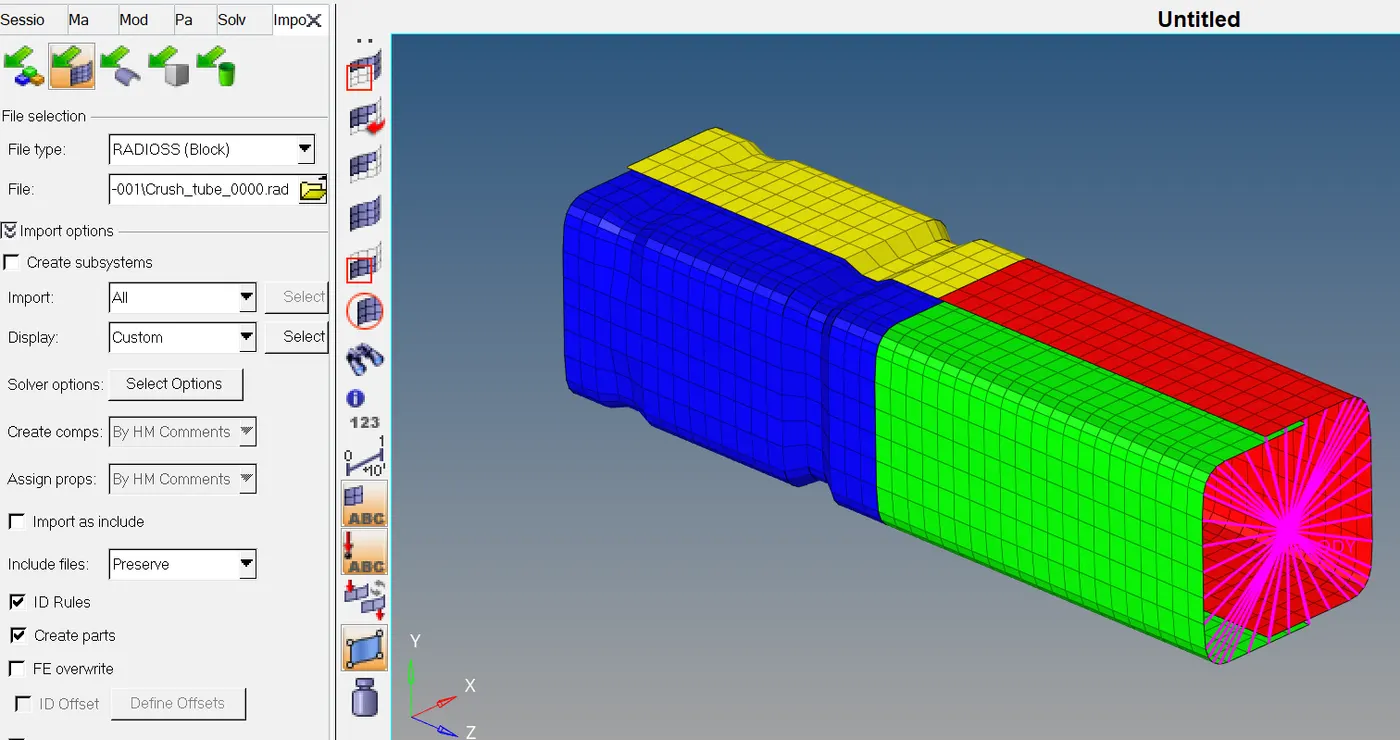
STEP 1 : Import the crash_tube_000.rad file.
- In order to import the .rad file by the following steps.
- File > import > solver deck > file type - radioss block > file name crash_tube_000.rad > imported it.
STEP 2 : Creation of TH
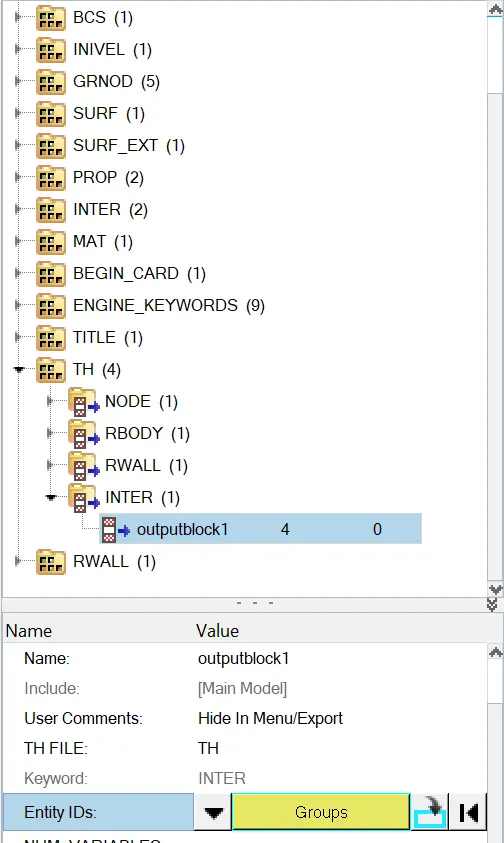
- Here to create TH for the for all the parts. Before running the simulation.We have to create TH for the interfaces.It should be followed for all the cases.
- To create TH, go to Solver Browser > Right Click on TH > Create > Inter > outputblock > entity IDs > selected the groups as seam and self contact > ok.
STEP 3 : RADIOSS job.
- Run the solver.
- Go to Analysis Panel > Radioss > Select the Input File > Save it in different Folder and Rename it as Case-1 > Run.
- Options helps to choose number of cores to solve this problem, here we have chosen 4 number of cores by (-nt 4).
- Then click on Radioss, and new window will get pop-up. A simulation will start to show result.
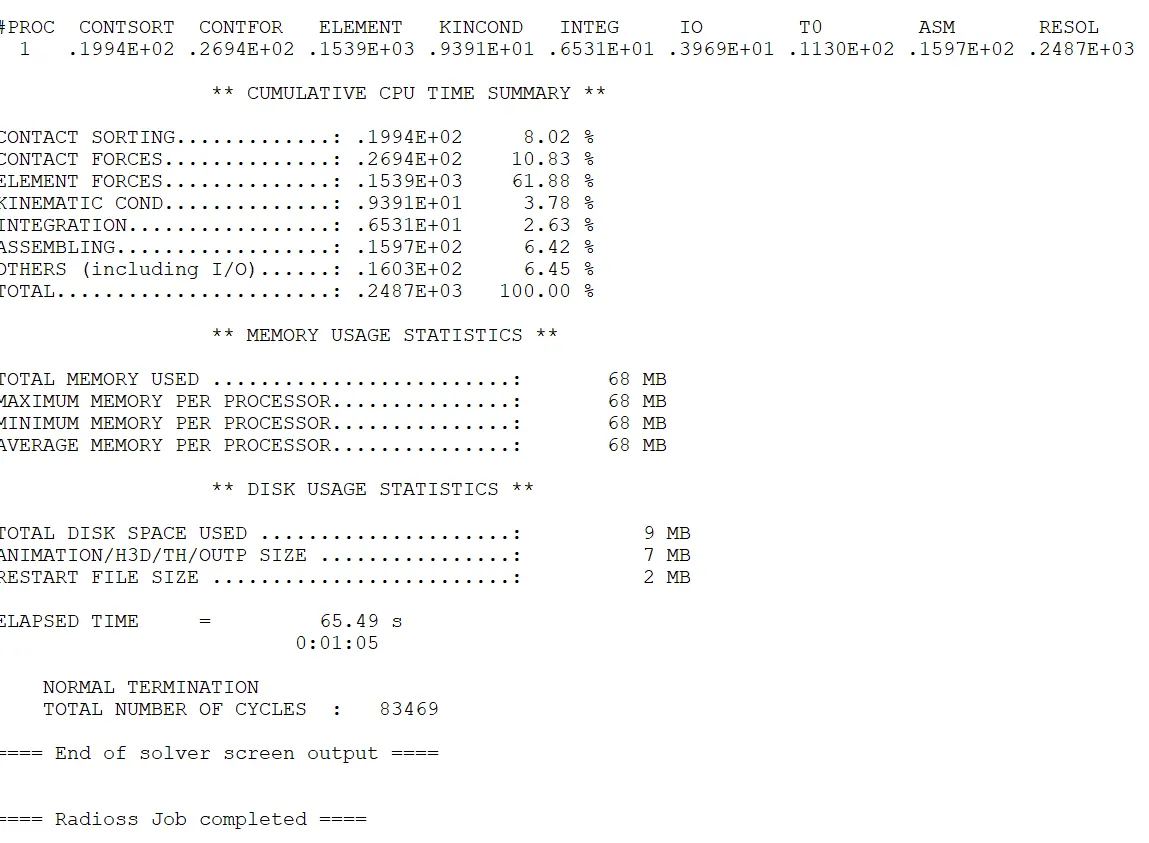
- After selecting the input file and completing the set up to run the solver.
- Radioss will pop the solver view stating Radioss Job Completed.
STEP 4 : Check engine 0001.rad file.
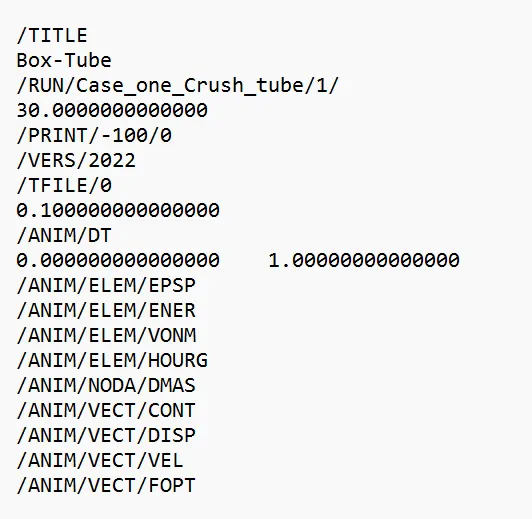
- After the end of the solver output go and check whether the engine has been edited or not.
- To check go to the file location where you have saved the starter file.
- Open the Case_one_crash_tube_0001.rad file.
STEP 5 : Check animation files .
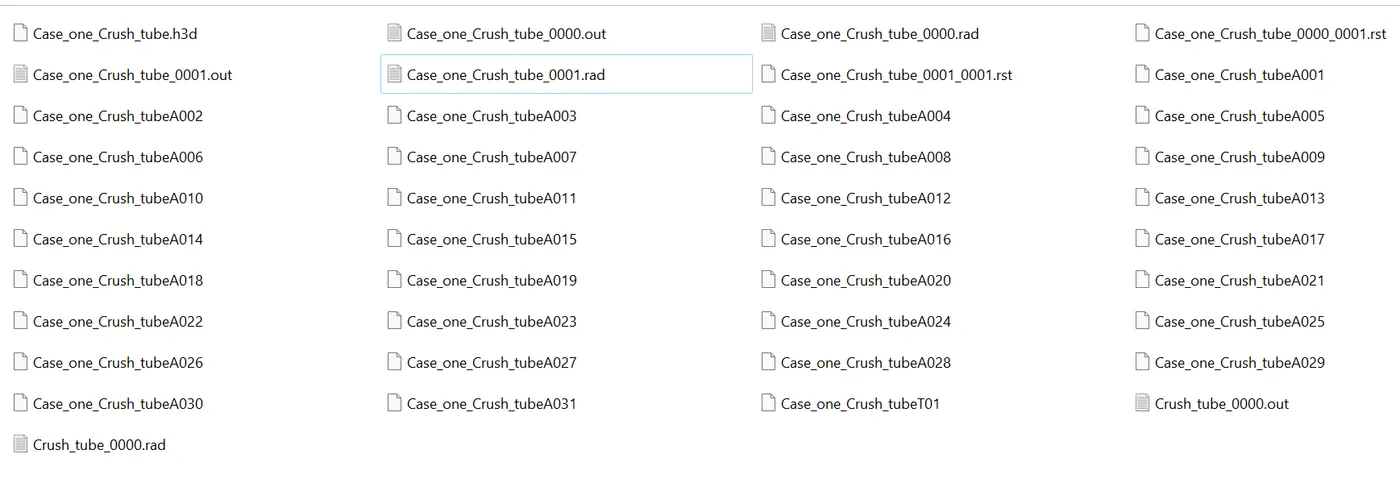
- 31 animated files are created.
STEP 6 : Check errors .
- Now engine output file [00001.out] has been generated after analysis.
- The engine output file [00001.out] contains the data like,
- Time step
- Energy error.
- Mass error.
- Internal energy error.
- Kinetic energy error.
- Contact energy error.
- The acceptable energy error is -15% to +5%.
- The acceptable mass error range is 0 to 2 % .

Maximum energy error = - 0.1%
Maximum kinetic energy = 0.4439E+05
Maximum internal energy = 0.4202E+05
Mass error =0 %.
STEP 10 : Post processing
1) Review the Simulation using -HyperView.
2) Plot the graphs using -Hypergraph 2D.
2) Review the Simulation using -HyperView.
- First to begin the postprocessing in the Hypermesh,Split the Screen .
- Import the animation file .h3d into the hyperview.
- After importing the .h3d file into the GUI,Enable the contour.
- The contour tool create contour plots of a model graphically visualize the analysis results.
- To enable contour,Go to Results > ToolBar > Contour .
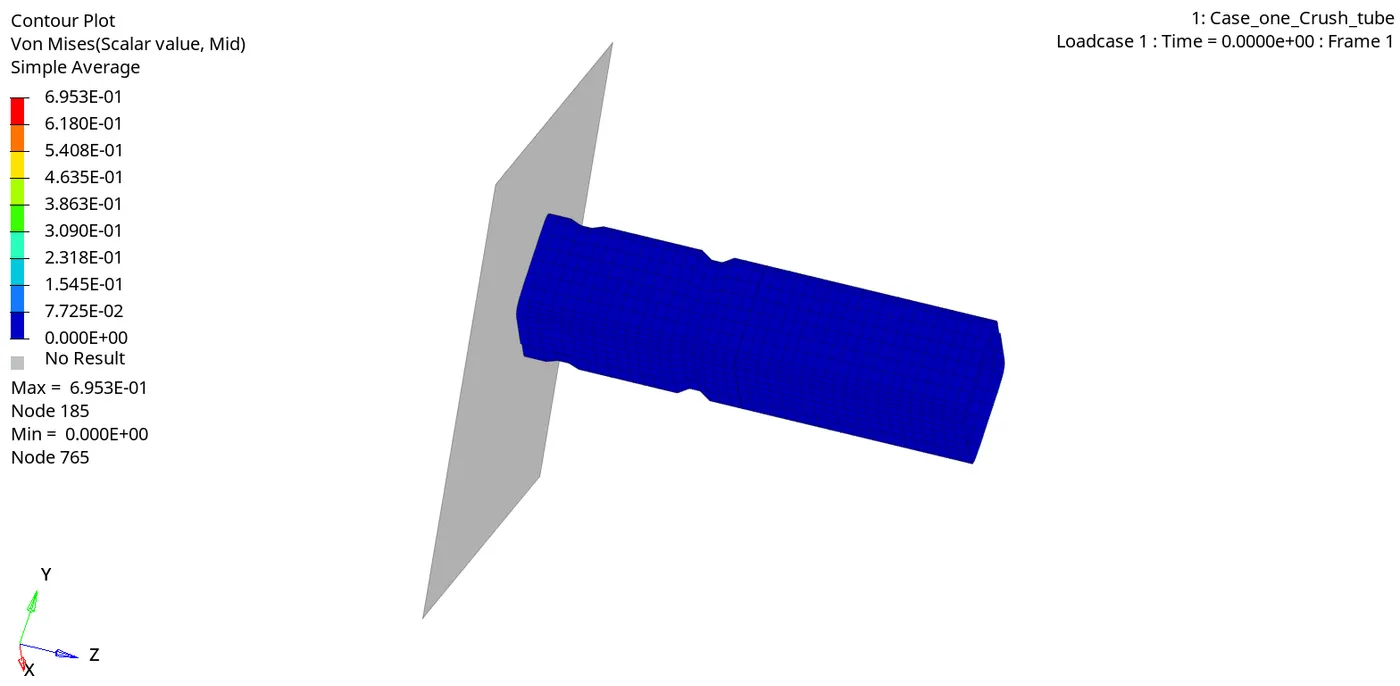
- Now switch to the Von Misses Stress in result type and select the component,select the averaging method as simple and then click apply.
Stress contour :
Max stress developed = 0.6953 Mpa.
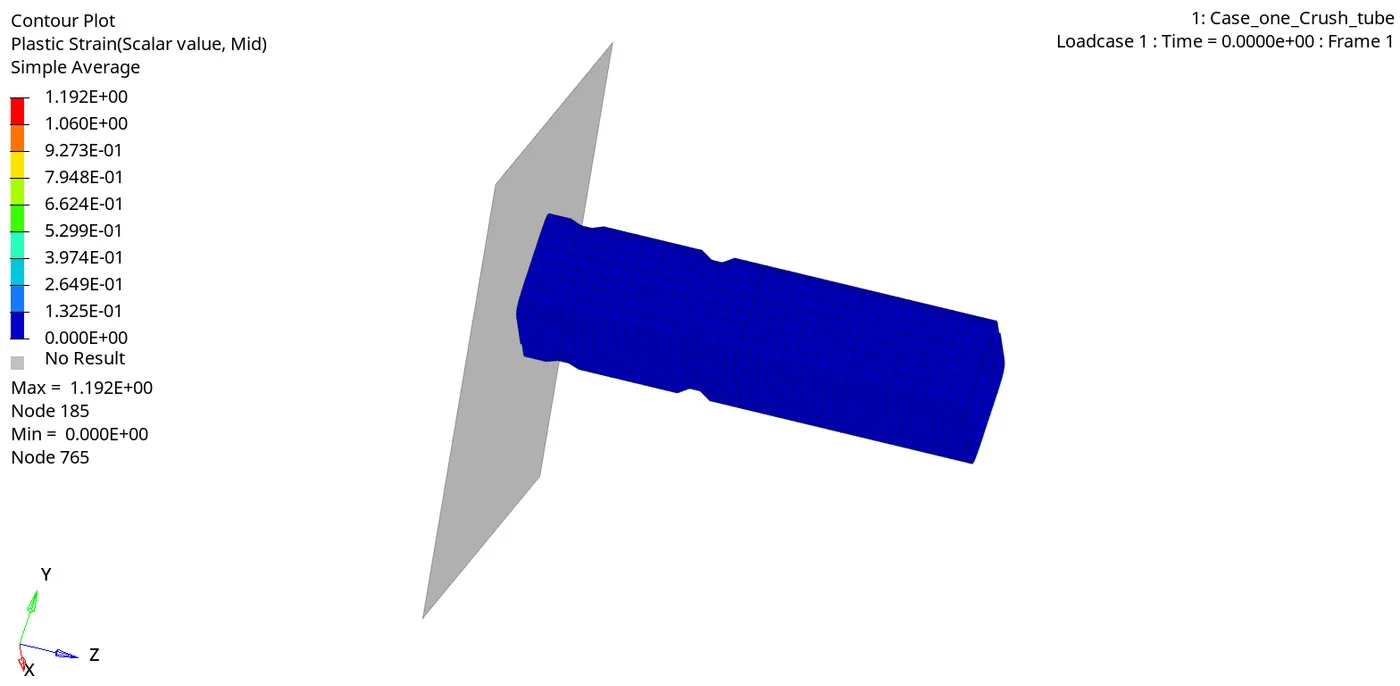
Strain contour :
Max strain developed = 1.192
3) Plot the graphs using -Hypergraph 2D.
- Now plot the graphs using Hypergraph 2D,We are plotting the graphs to see what is happening in the rail component.
- Hypergraph 2D is a powerful data analysis and plotting tool with interfaces to many popular file formats.
- Here switch to the Hypergraph 2D to plot the graphs.
- To switch,Go to Client Selector > Choose the Hypergraph 2D.
3a) Plot of the Rigid Wall Forces.
- To plot the graph,go to Hypergraph 2D > Data File > Solver_file_T01 > Apply.
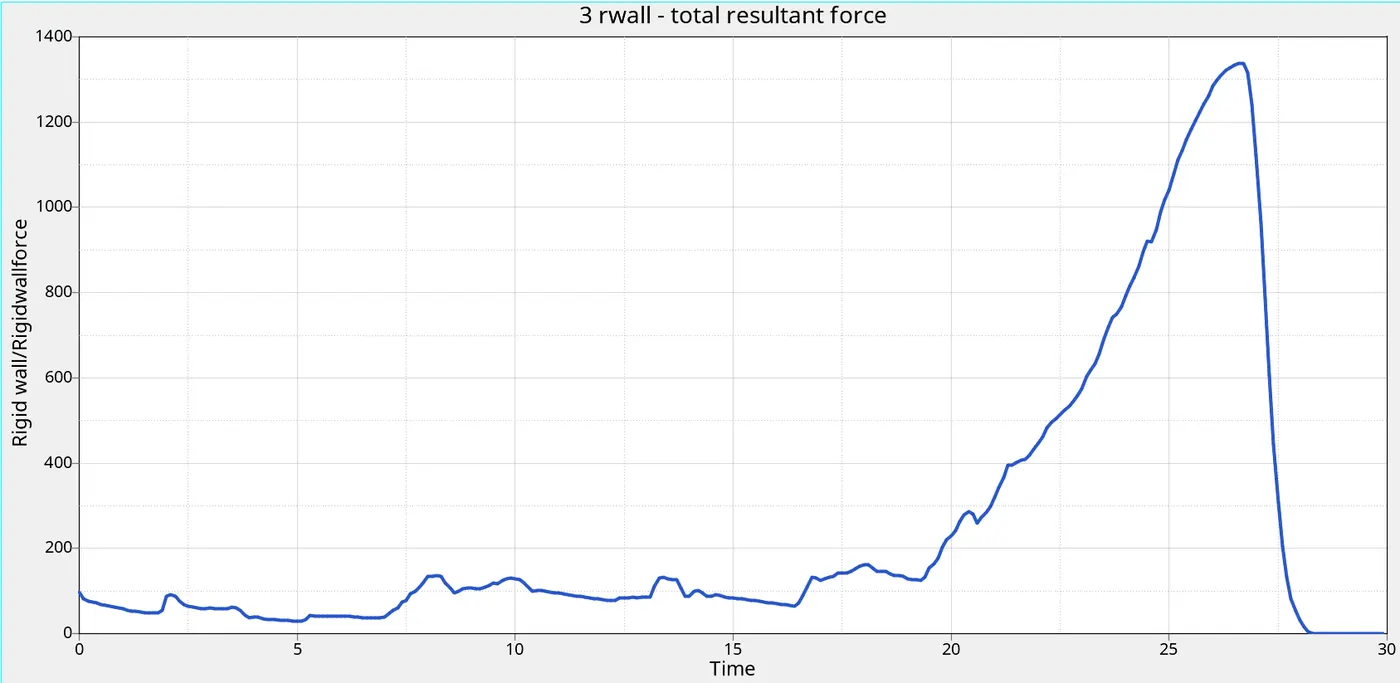
Max resultant force = 1338.16 N
- Initially there is contact between rigidwall and the aluminium crash tube , so the curve is in starts from 97.76 N.
- When resultant force will be increasing,cause the elements are getting deformed and the rigid wall forces suddenly reaches peak upto 1338.16N.,cause the entire crash tube collides with the rigid wall. And again its decreasing,cause after the collision,the entire component will be at rest,So its decreasing.
3b) Plot of internal energy.
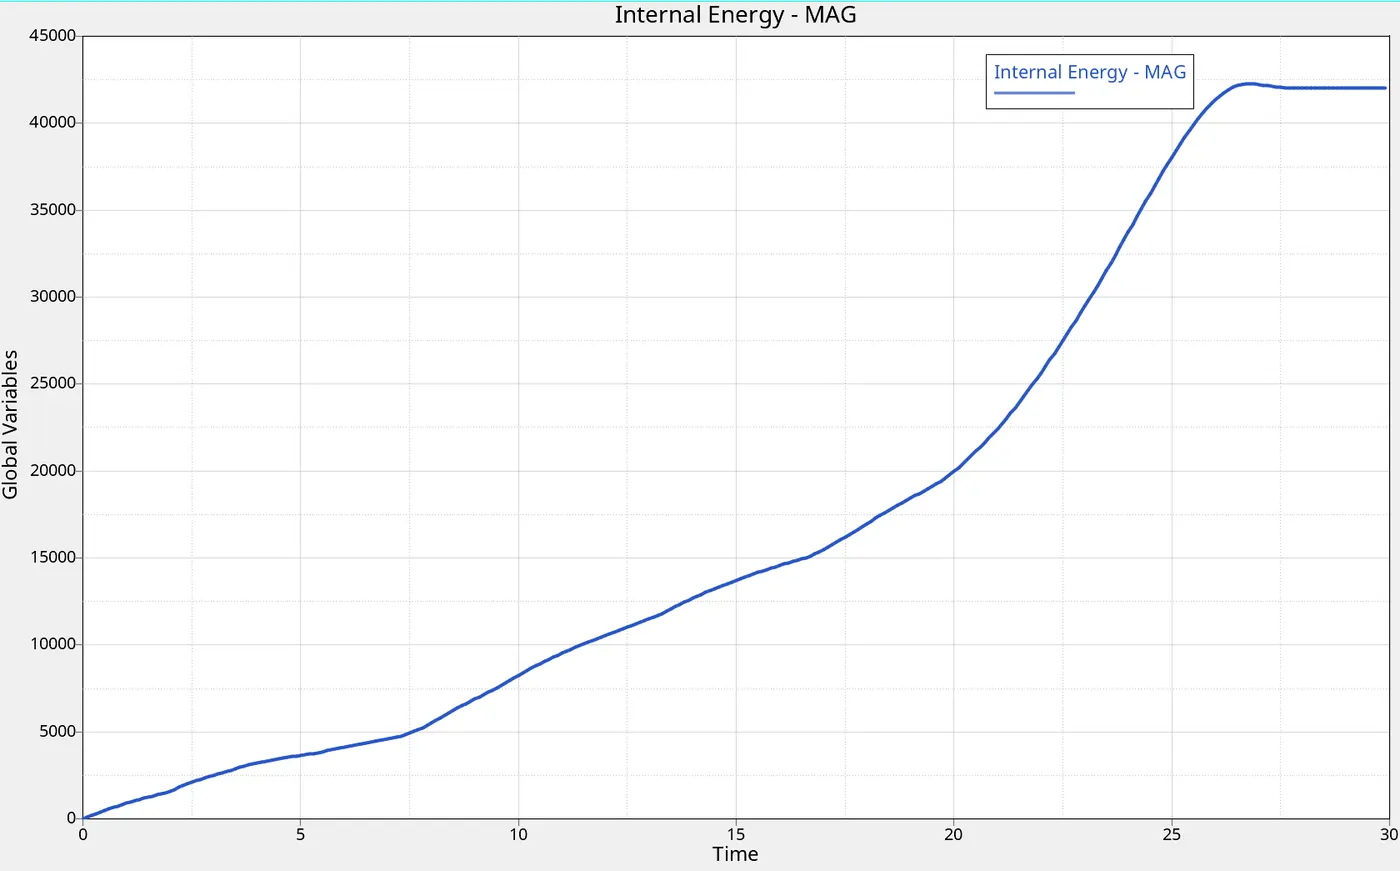
Max internal energy = 42273 gm (mm /ms²)
- Initially internal energy of the steel tube is zero, because there is no contact between rigidwall and steel tube. after steel tube crush against the rigidwall deformation occurs , then the internal energy of the plate gradually increases,why because the deformation or displacement is happening,when the displacement increases the internal energy increases.
3c) Plot of kinetic energy.
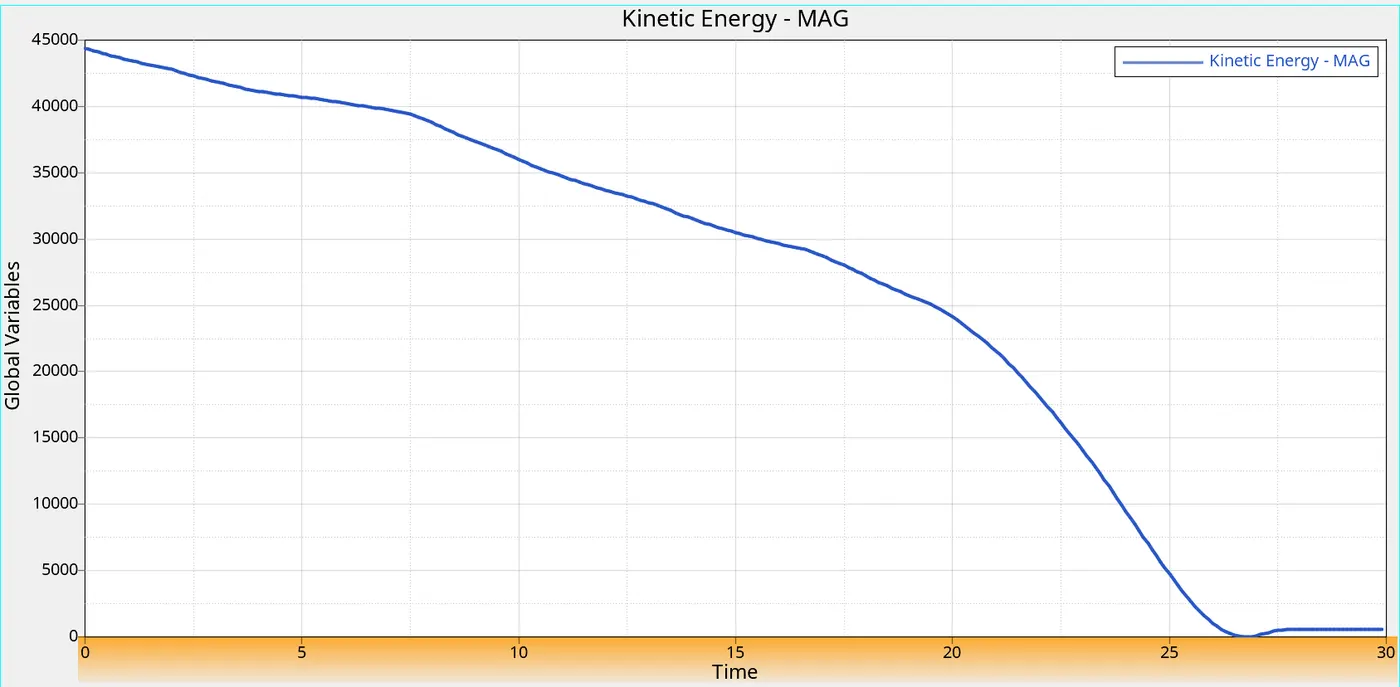
- Max kinetic energy = 44400 gm (mm /ms)²
- Here kinetic energy is increasing in the beginning itself,Why because the initial velocity is given for the component. And it goes on decreasing,cause the deformation is happening to the crash tube,so the kinetic energy is decreasing.
3d) Plot of self contact force.
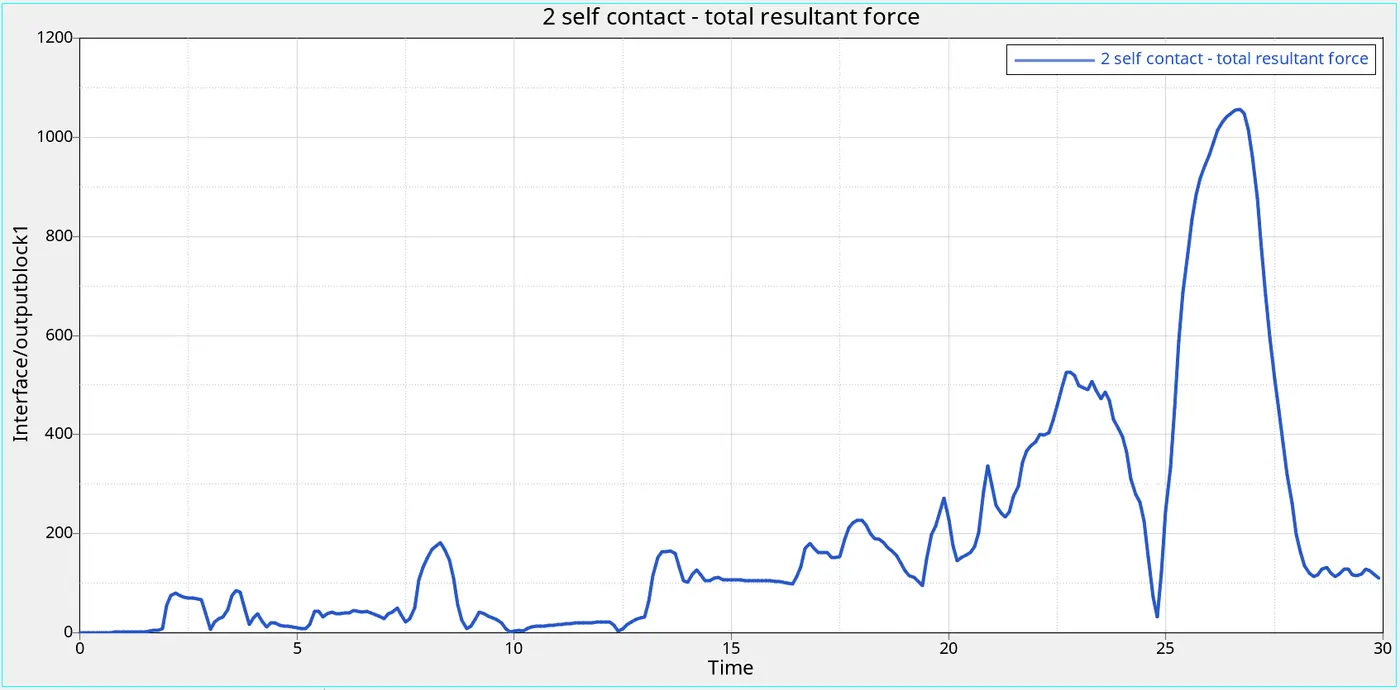
- Max contact resultant force = 1057 N.
- Here the contact forces are in origin,cause initially there is no contact and impact.
- And it goes on increasing slightly,cause the deformation is happening and suddenly it reaches peak upto 1057N cause the entire crash tube collides to the rigid wall.And it decreases,cause after collision,the crash tube will be at rest.
3f) Plot of seam weld force :
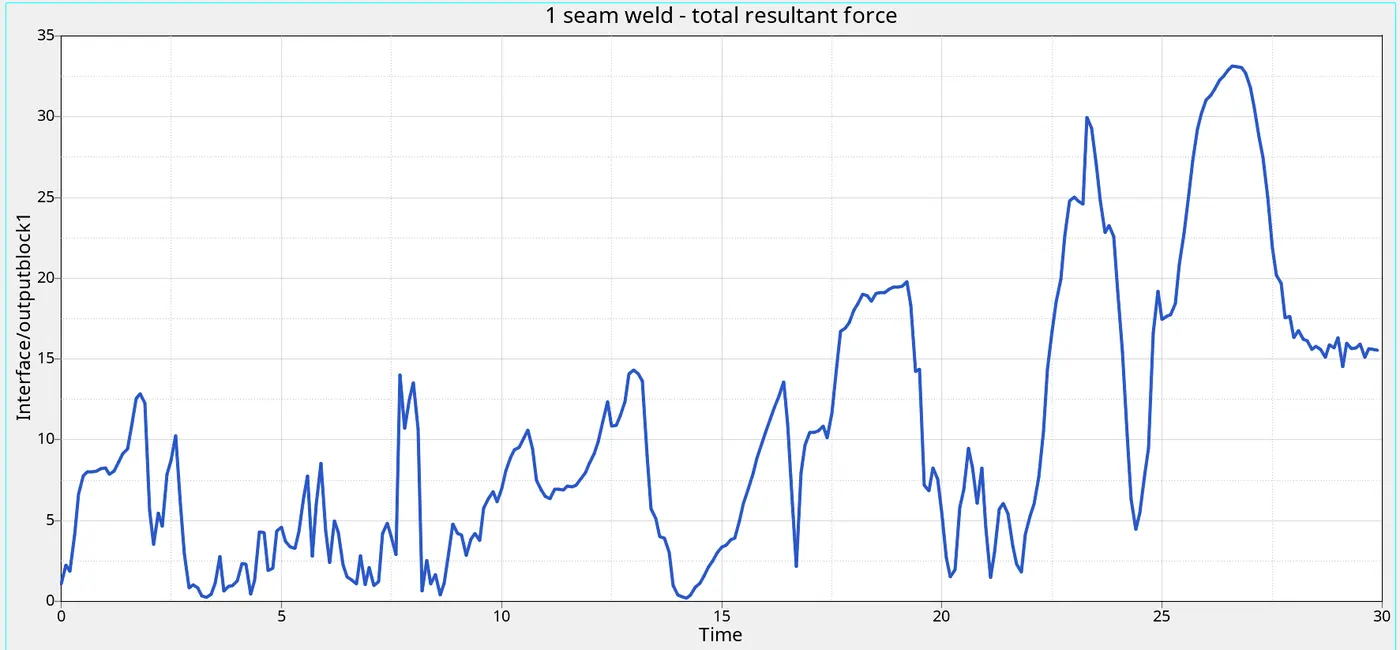
- Minimum seam weld resultant force = 1 N
- Maximum seam weld resultant force = 33.15 N
- Initially seam weld force is low as 1N then after crushing starts on the crash tube it gradually increases upto 33.15 N act on seam weld and it decreases,cause after collision,the crash tube will be at rest.
2e) Plot of contact energy.
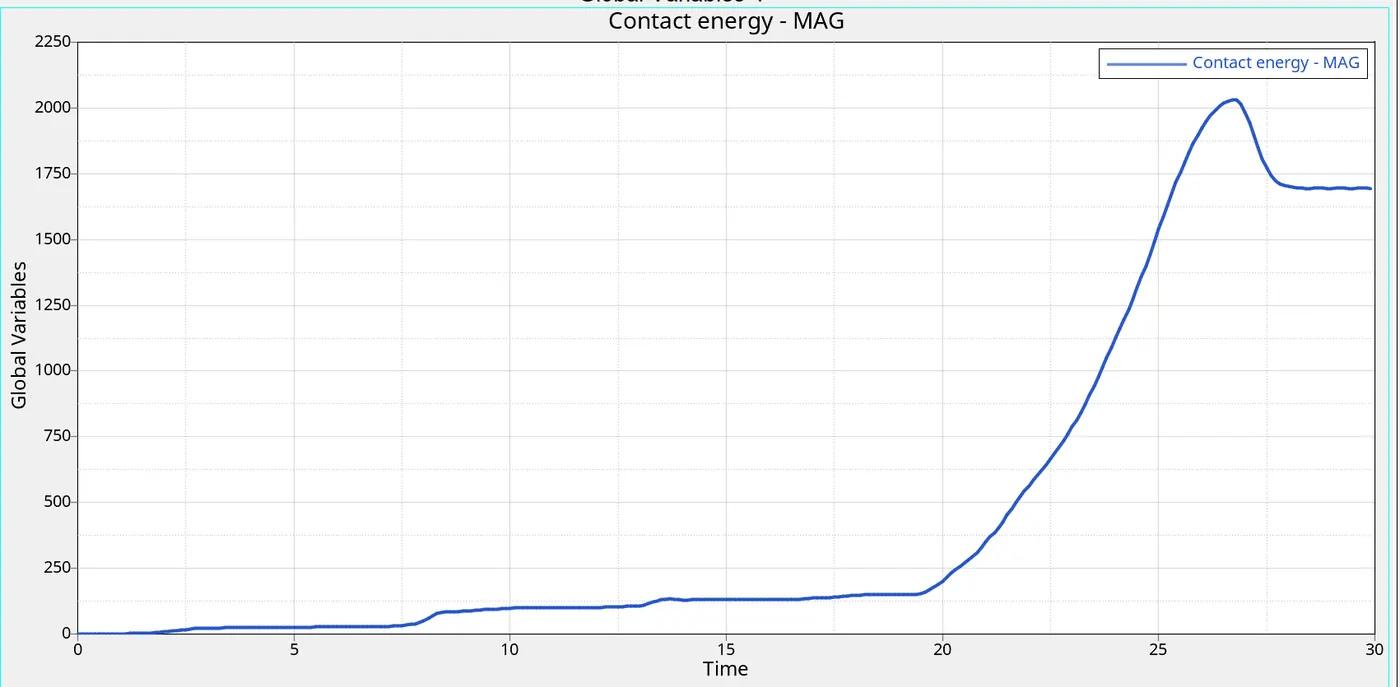
- Max contact energy = 2029.77
- Here the contact energy starts from origin,Cause the crash tube component is in intial condition. Intially there is no contact between the crash tube component and rigid wall.
- There is also no deformation intially,But when the component goes and hits on the rigid wall,The contact energy starts increasing. When the deformation or displacement happens to the component,the contact energy increases,cause the crash tube comes into the contact to the rigid wall.So the contact energy goes on increasing.
2f ) Plot of Hour glass energy.
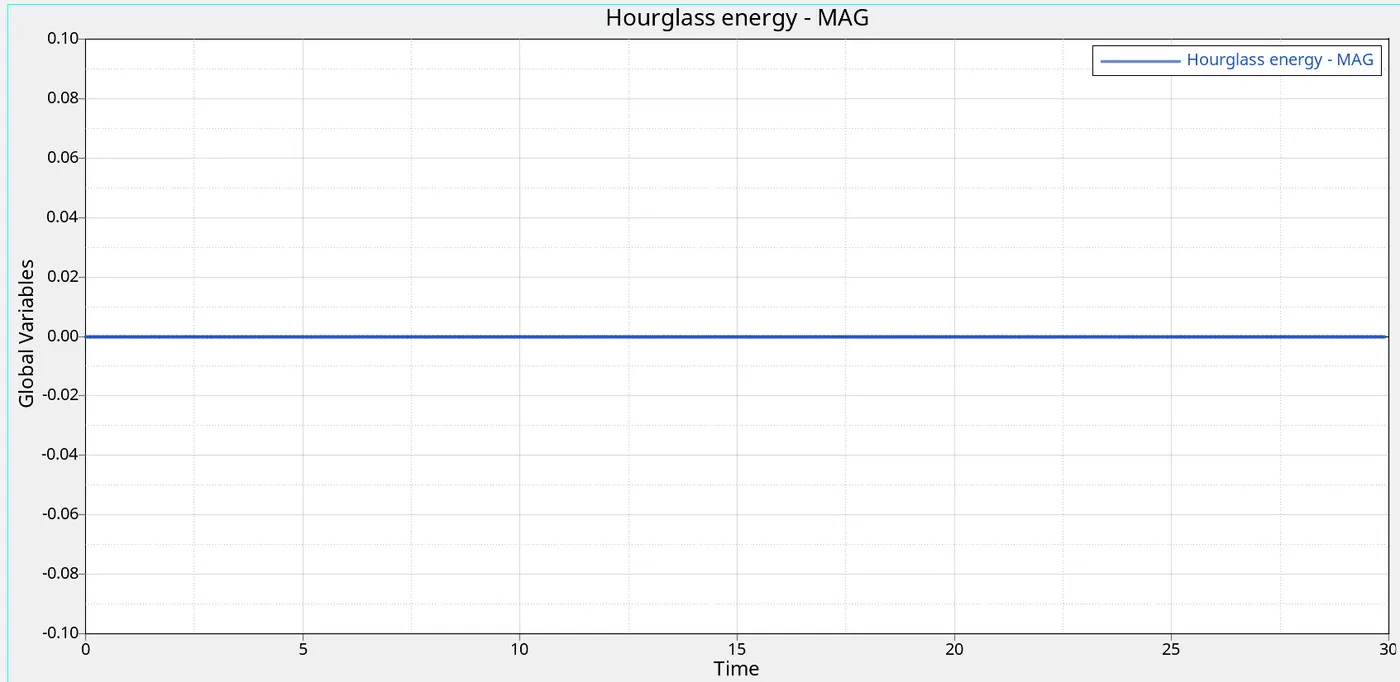
- Here the hourglass energy is constant,Because the recommended parameter Ishell=24 has been assigned to the property card,So the hourglass energy is constant.
2g) Plot of total energy .
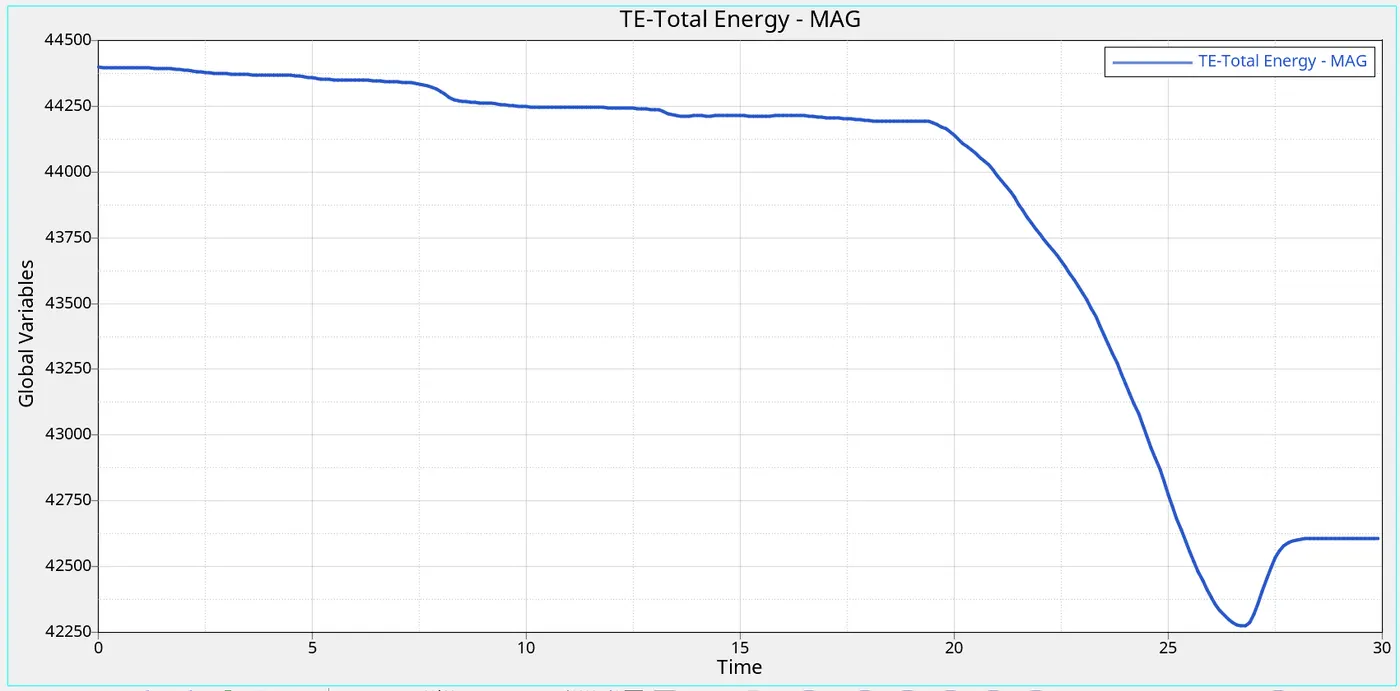
- Max total energy = 44400 gm (mm /ms)²
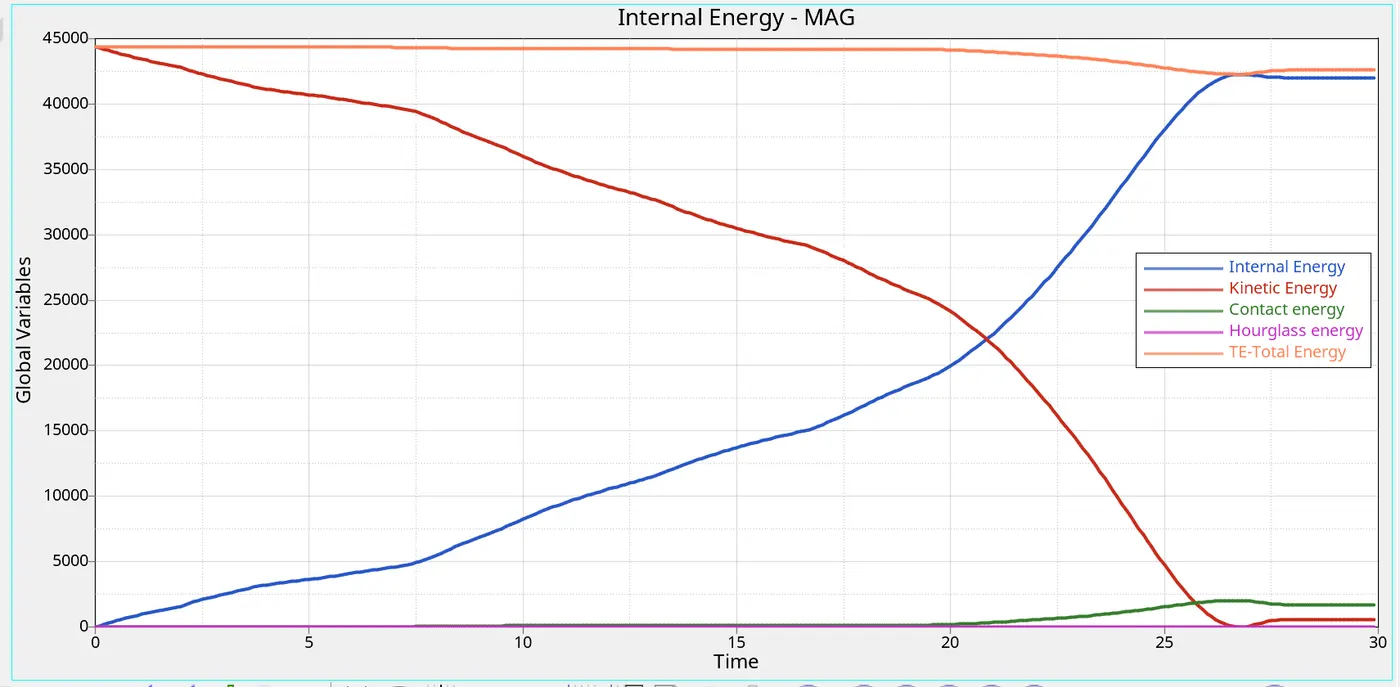
- Total Energy is sum of Kinetic Energy+Contact Energy+Hourglass Energy + Internal Energy. Here total energy starts from higher value,In starting itself its increasing,Why because the total energy is sum of Kinetic Energy+Contact Energy+Hourglass Energy + Internal Energy.
- All energies are in initial condition except kinetic energy,So kinetic energy is only there Total Energy=Kinetic Energy+0+0+0. Kinetic enrgy is directly proprtional to the total energy. So the total energy is increasing in the beginning. And its slightly decreasing,Due to -3.8% of energy error,the total energy is decreasing.
2h) Plot of all energies.
CASE 2 : Change the Inacti=6 and run.
STEP 1 : Change the Inact value
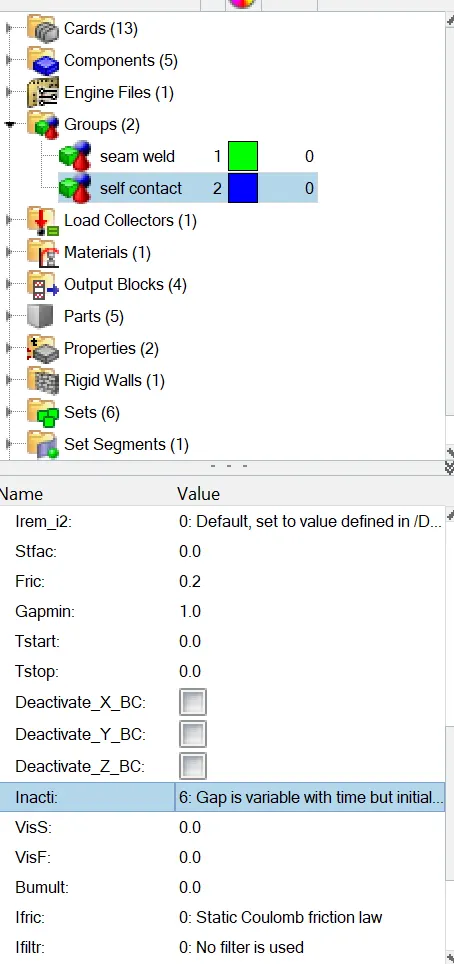
- Here change the parameter value as Incti=6,Keep the remaining parameters as it is default.
- Inacti Parameter=6,It will remove the penetration,the penetration won't happen between the slave and master node. It will reduce the gap and adjust the gap.Like the gap will be reduced and scaled.The Inacti value is changed.
- Inorder to change the Inact value by the following steps.
- Model browser > groups > self contact > Inacti value is changed to 6 >done.
STEP 2 : Repeated the same steps as above case one.( Step 3 to step 6 )
STEP 3 : Post processing
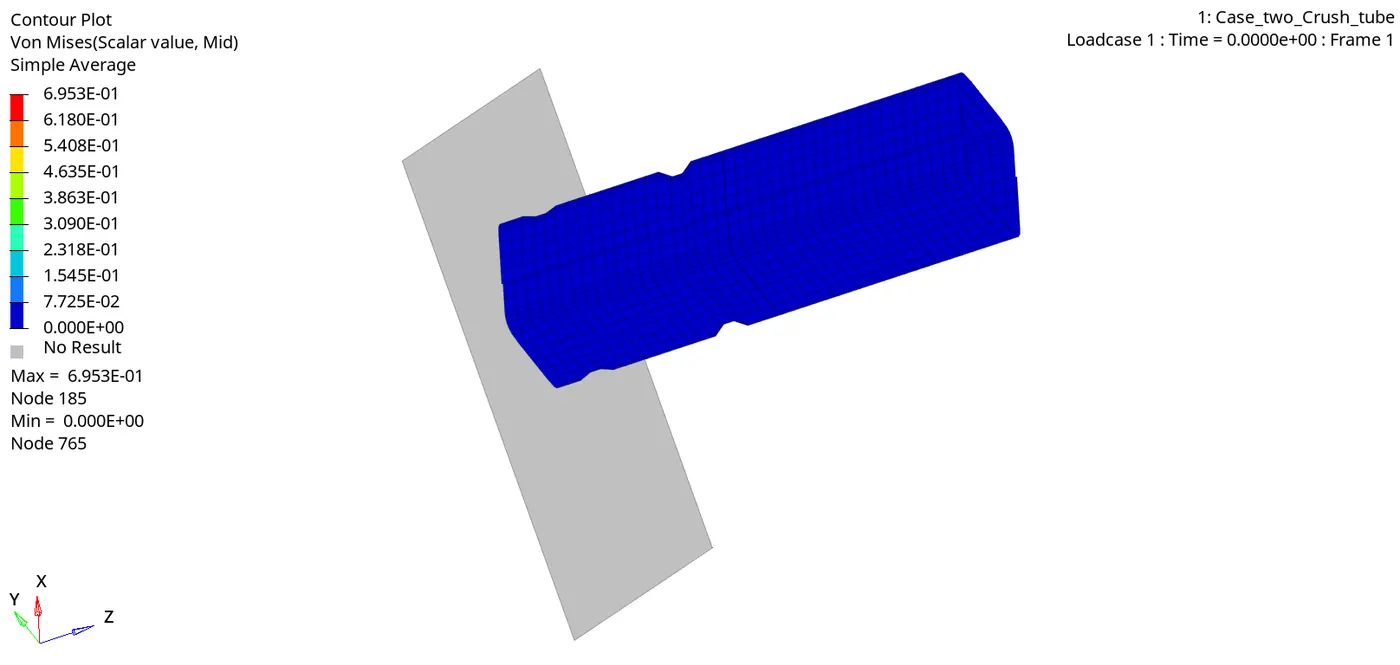
Stress contour :
Max stress developed = 0.6953 Mpa.
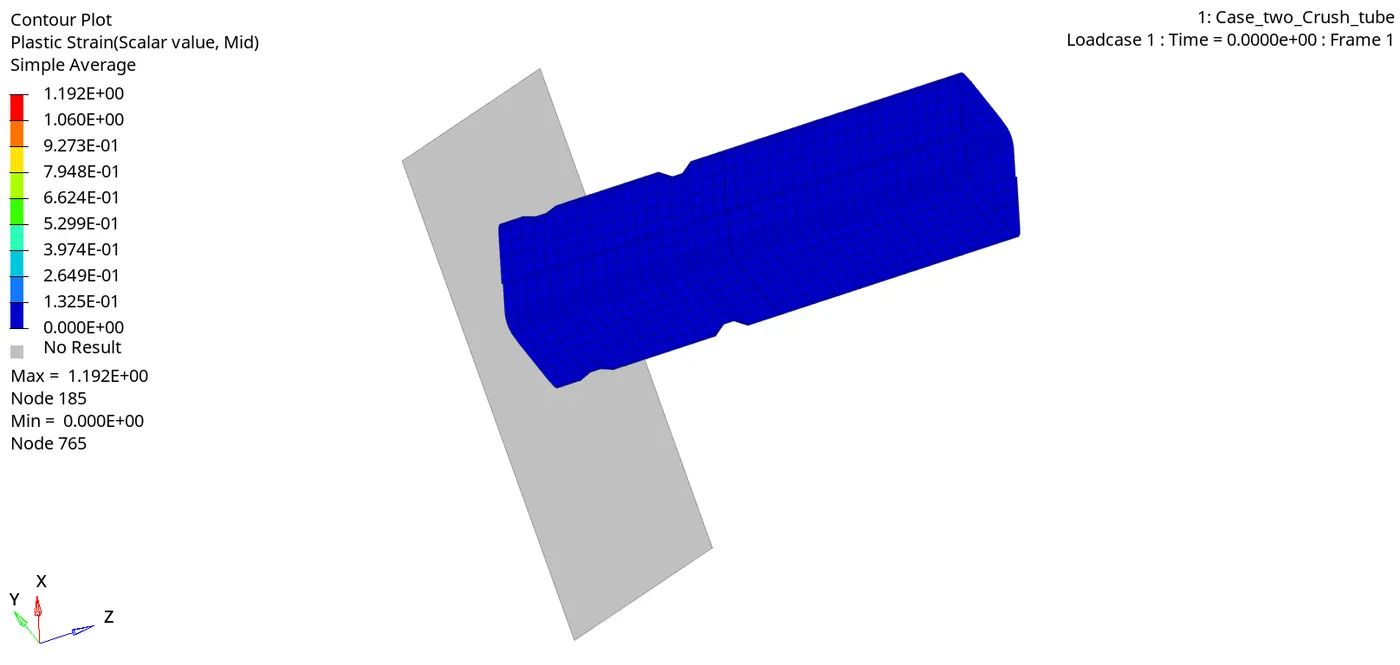
Strain contour :
Max strain developed = 1.192
3a) Plot of the Rigid Wall Forces.
- To plot the graph,go to Hypergraph 2D > Data File > Solver_file_T01 > Apply.
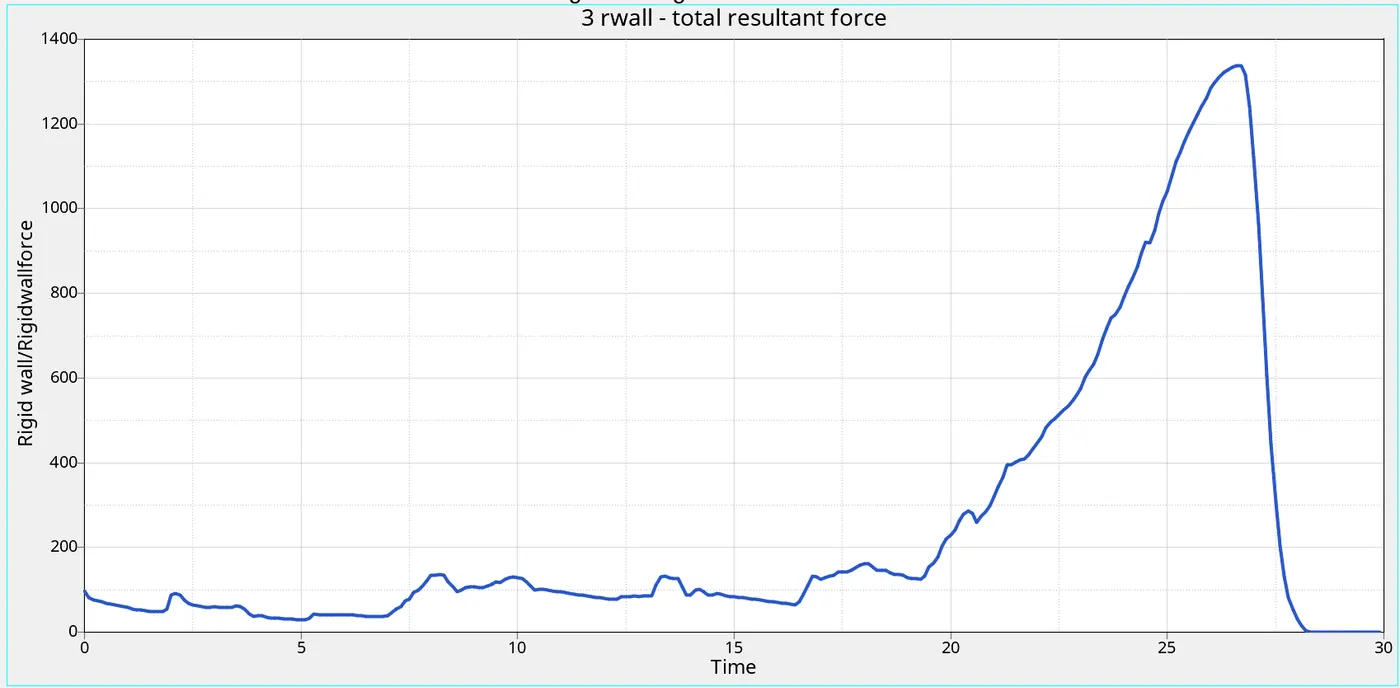
Rigidwall Max resultant force = 1338.18 N
- Initially there is contact between rigidwall and the aluminium crash tube , so the curve is in starts from 97.76 N.
- When resultant force will be increasing,cause the elements are getting deformed and the rigid wall forces suddenly reaches peak upto 1338.16N.,cause the entire crash tube collides with the rigid wall. And again its decreasing,cause after the collision,the entire component will be at rest,So its decreasing.
3b) Plot of internal energy.
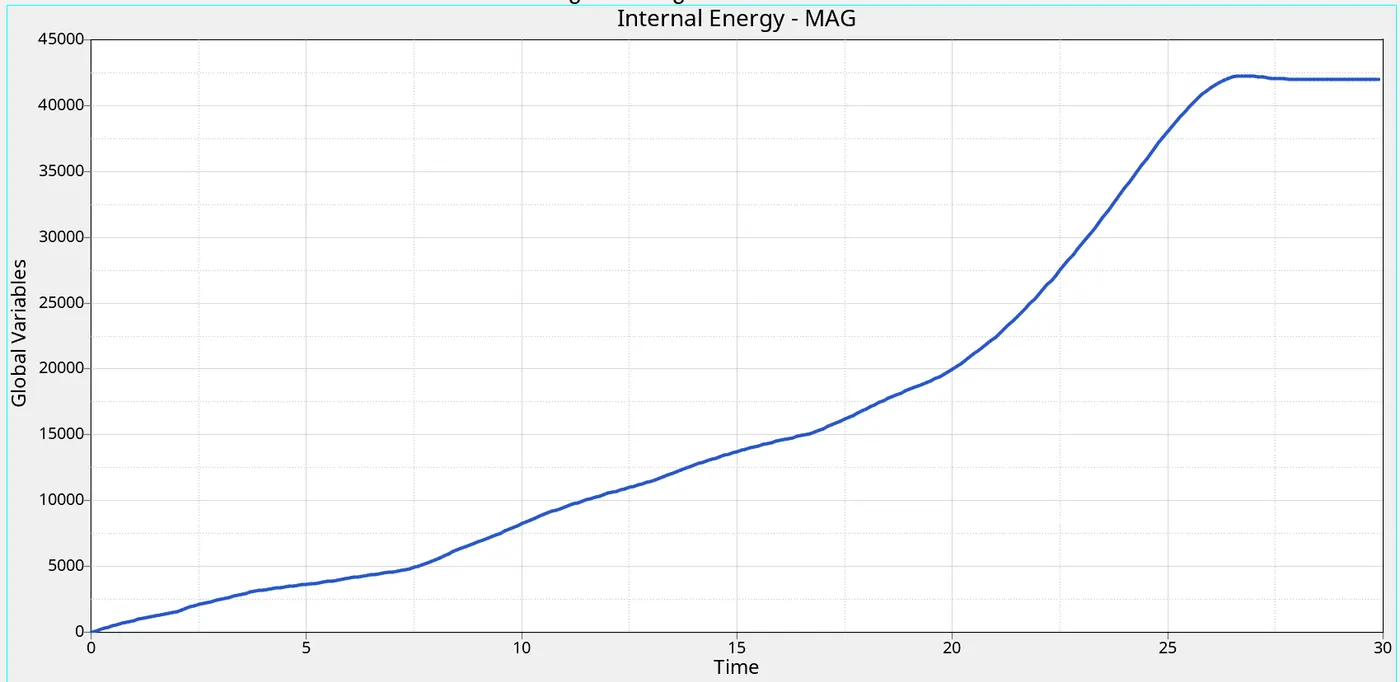
- Max internal energy = 42273 gm (mm /ms²)
- Initially internal energy of the steel tube is zero, because there is no contact between rigidwall and steel tube. after steel tube crush against the rigidwall deformation occurs , then the internal energy of the plate gradually increases,why because the deformation or displacement is happening,when the displacement increases the internal energy increases.
3c) Plot of kinetic energy.
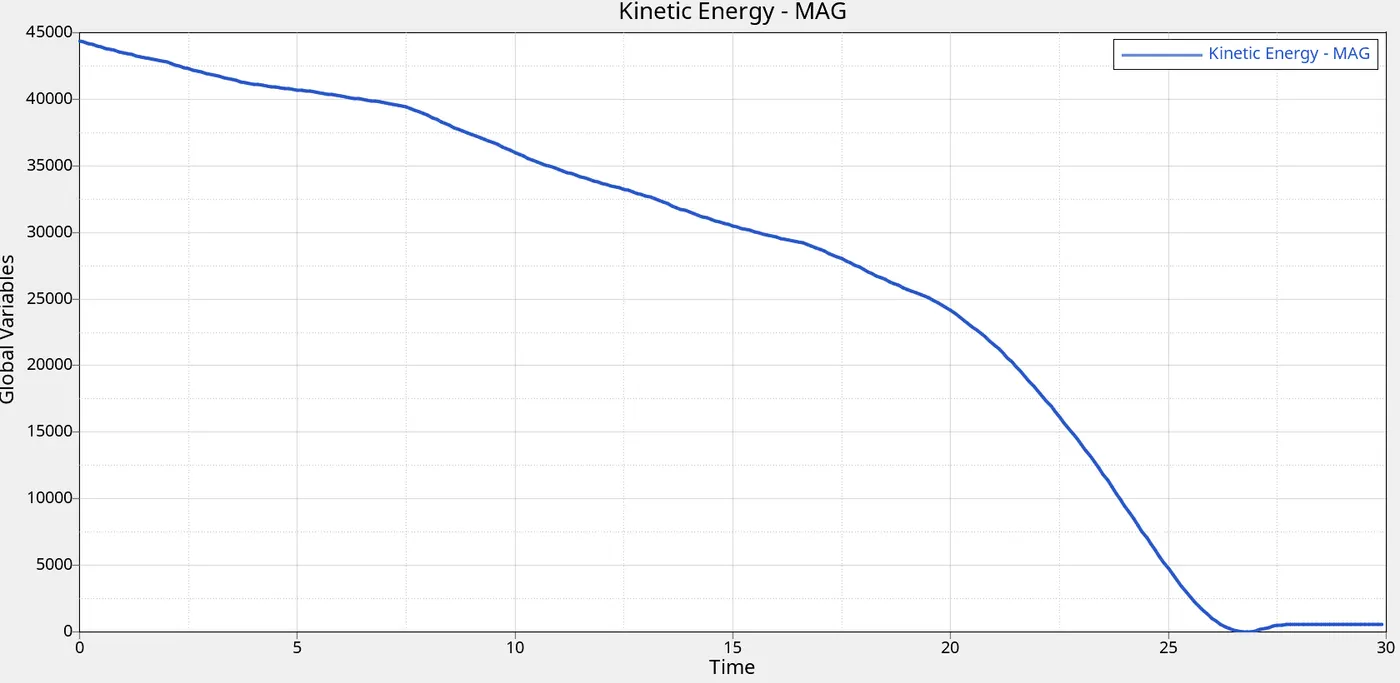
- Max kinetic energy = 44400 gm (mm /ms)²
- Here kinetic energy is increasing in the beginning itself,Why because the initial velocity is given for the component. And it goes on decreasing,cause the deformation is happening to the crash tube,so the kinetic energy is decreasing.
2d) Plot of self contact force.
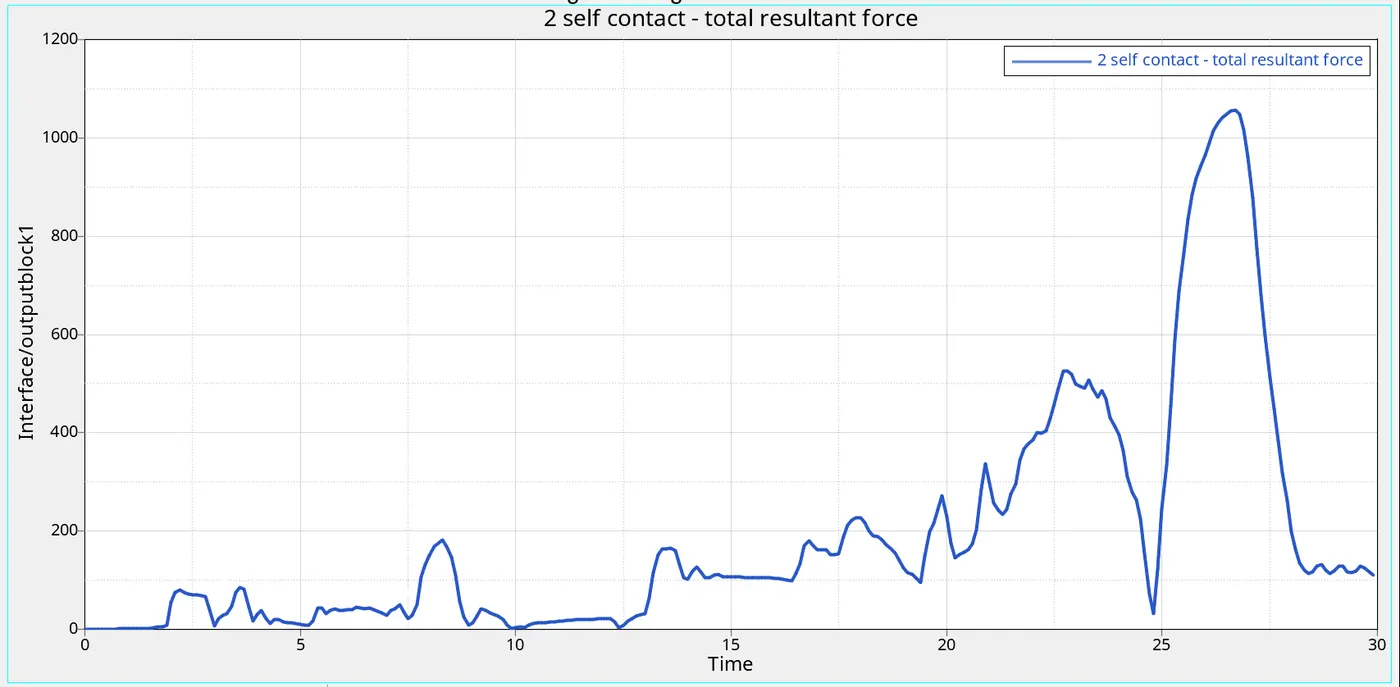
- Max contact resultant force = 1057 N.
- Here the contact forces are in origin,cause initially there is no contact and impact.
- And it goes on increasing slightly,cause the deformation is happening and suddenly it reaches peak upto 1057N cause the entire crash tube collides to the rigid wall.And it decreases,cause after collision,the crash tube will be at rest.
2e) Plot of seam weld total resultant force
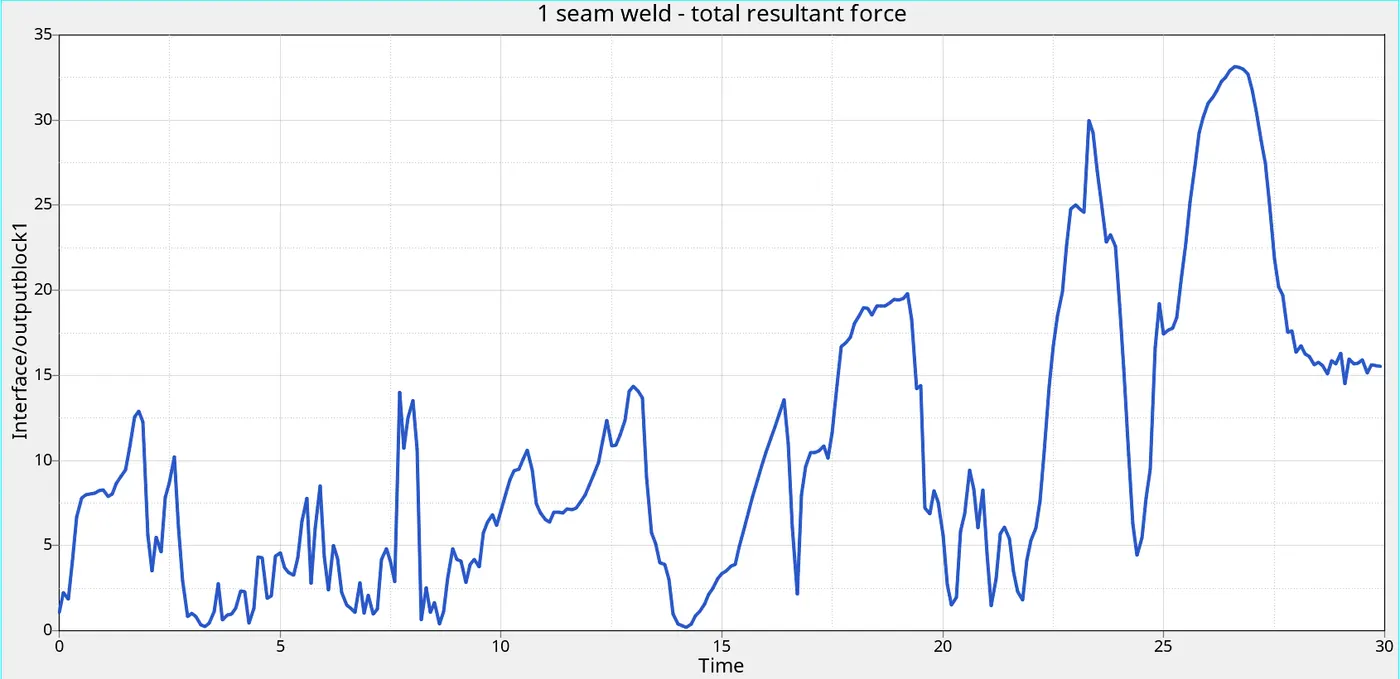
- Minimum seam weld resultant force = 1 N
- Maximum seam weld resultant force = 33.15 N
- Initially seam weld force is low as 1N then after crushing starts on the crash tube it gradually increases upto 33.15 N act on seam weld and it decreases,cause after collision,the crash tube will be at rest.
2f) Plot of contact energy .
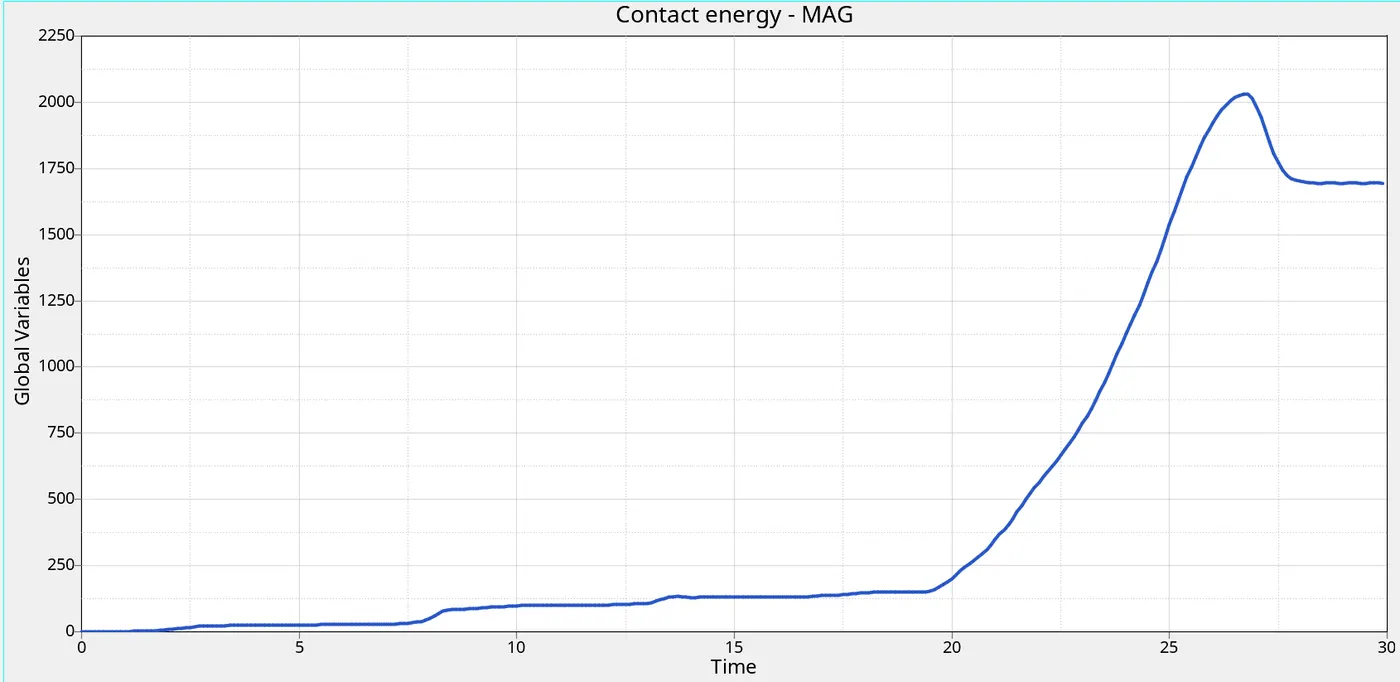
- Max contact energy = 2029.77
- Here the contact energy starts from origin,Cause the crash tube component is in intial condition. Intially there is no contact between the crash tube component and rigid wall.
- There is also no deformation intially,But when the component goes and hits on the rigid wall,The contact energy starts increasing. When the deformation or displacement happens to the component,the contact energy increases,cause the crash tube comes into the contact to the rigid wall.So the contact energy goes on increasing.
2g ) Plot of Hour glass energy.
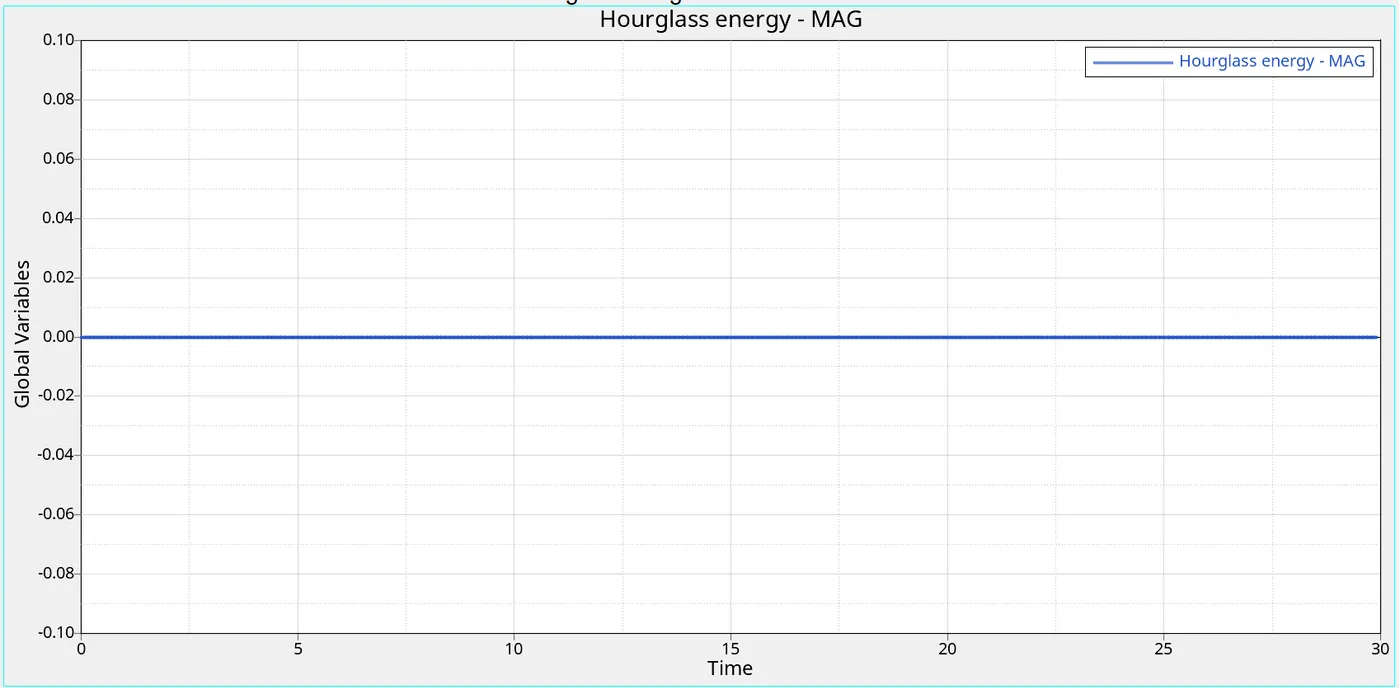
Here the hourglass energy is constant,Because the recommended parameter Ishell=24 has been assigned to the property card,So the hourglass energy is constant.
2h) Plot of total energy .
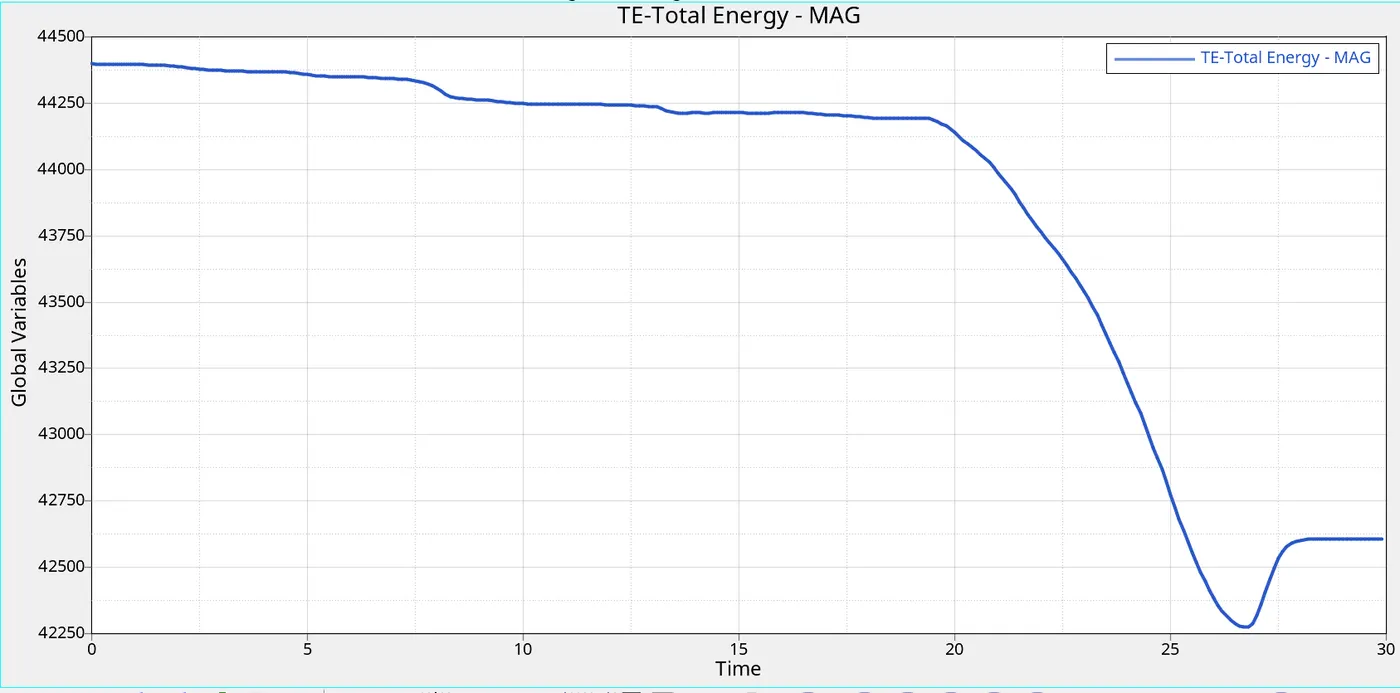
- Max total energy = 44400 gm (mm /ms)²
- Total Energy is sum of Kinetic Energy+Contact Energy+Hourglass Energy + Internal Energy. Here total energy starts from higher value,In starting itself its increasing,Why because the total energy is sum of Kinetic Energy+Contact Energy+Hourglass Energy + Internal Energy.
- All energies are in initial condition except kinetic energy,So kinetic energy is only there Total Energy=Kinetic Energy+0+0+0. Kinetic enrgy is directly proprtional to the total energy. So the total energy is increasing in the beginning. And its slightly decreasing,Due to -3.8% of energy error,the total energy is decreasing.
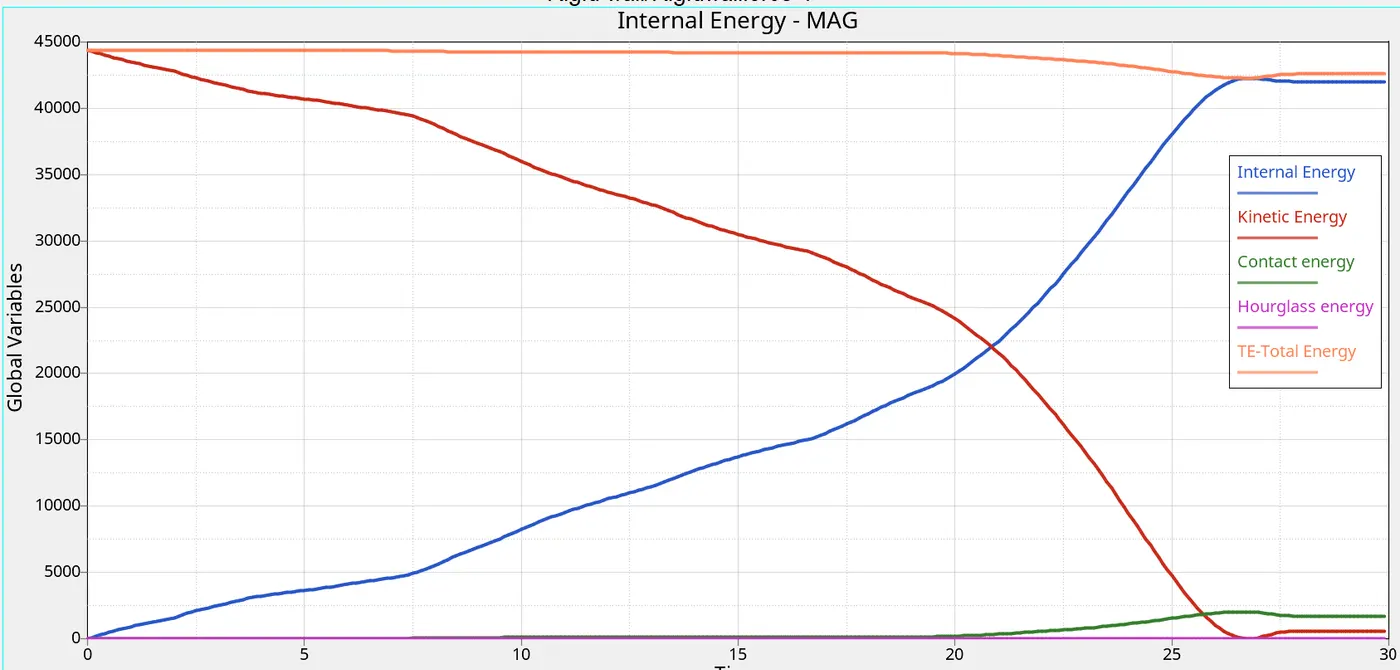
2i) Plot of all energies.
CASE 3: Create the type 11 contact and run.
STEP 1 : Creation of card
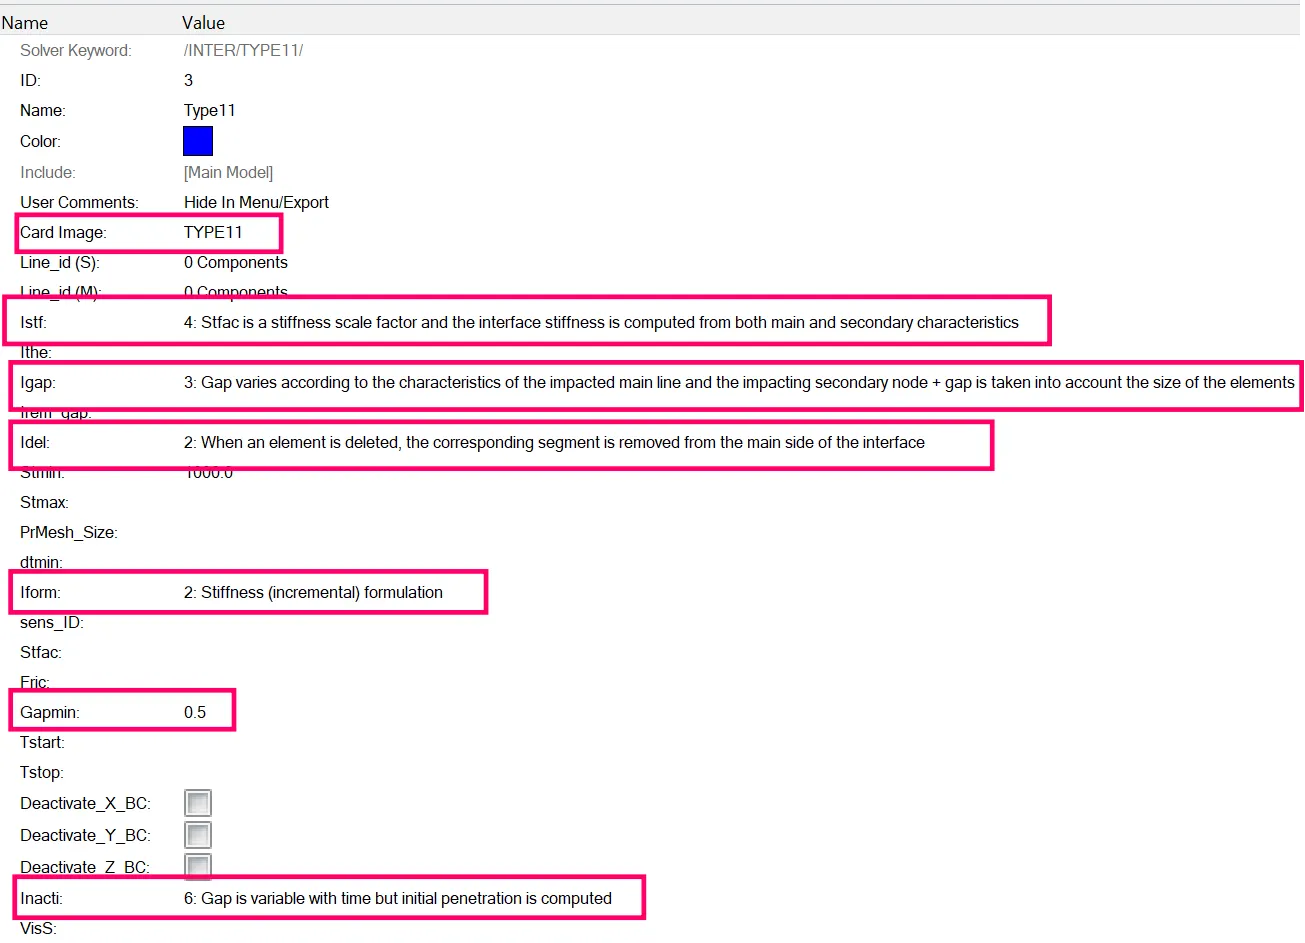
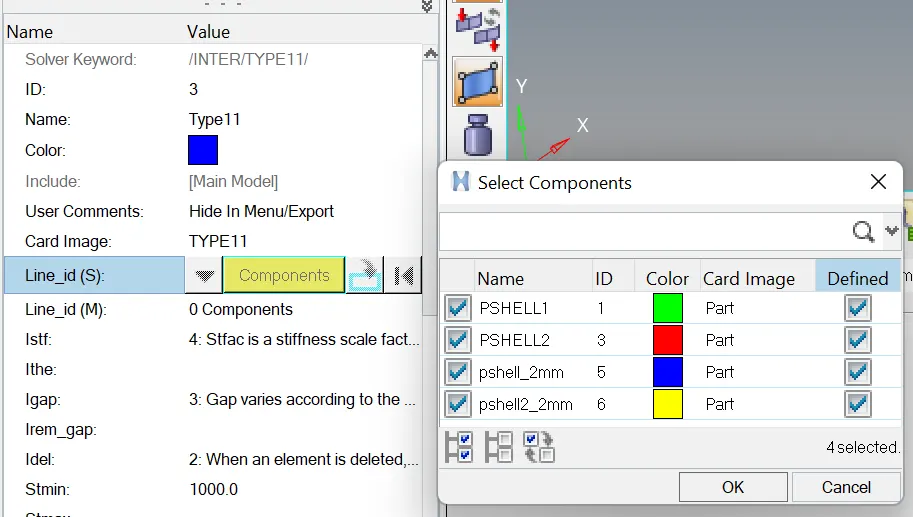
- Now for this case,we have to create new contact called Type 11 [Edge to Edge Contact] and define the slave and master for the type 11 contact by the following steps.
- Model browser > group > create new group named as type11 > done.
- Click on type 11 group > set the values of Istf, Igap , Idel ,Iform ,Gapmin and Inacti as per requested values.
STEP 2 : Creation of TH
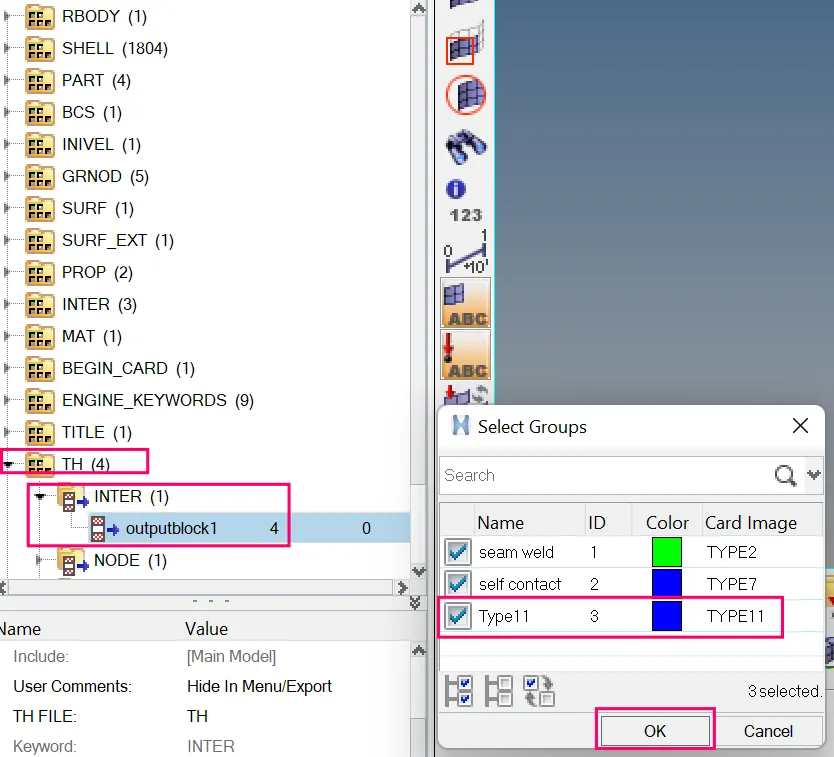
- Here to create TH for the for all the parts. Before running the simulation.We have to create TH for the interfaces.
- To create TH, go to Solver Browser > Right Click on TH > Create > Inter > outputblock > entity IDs > selected the groups as type11, seam weld,and self contact > ok.
STEP 3 : Repeated the same steps as above case one.( Step 3 to step 6 )
STEP 3 : Post processing
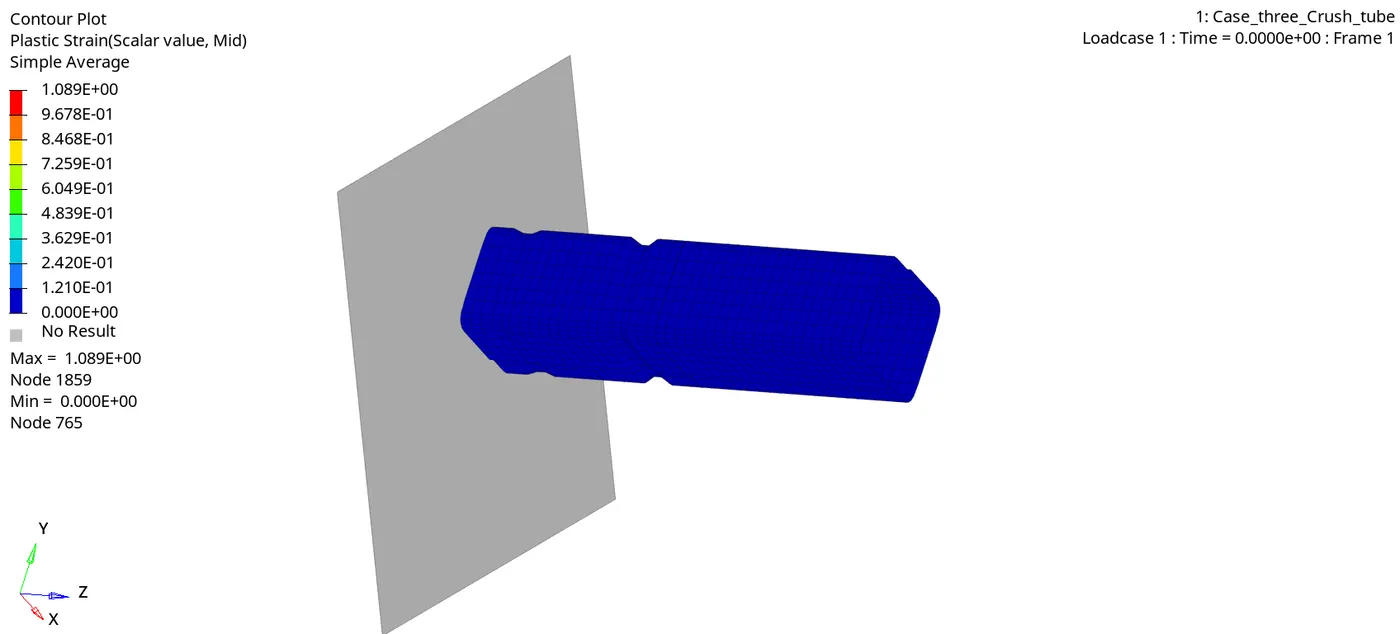
Stress contour :
Max stress developed = 0.6454 Mpa.
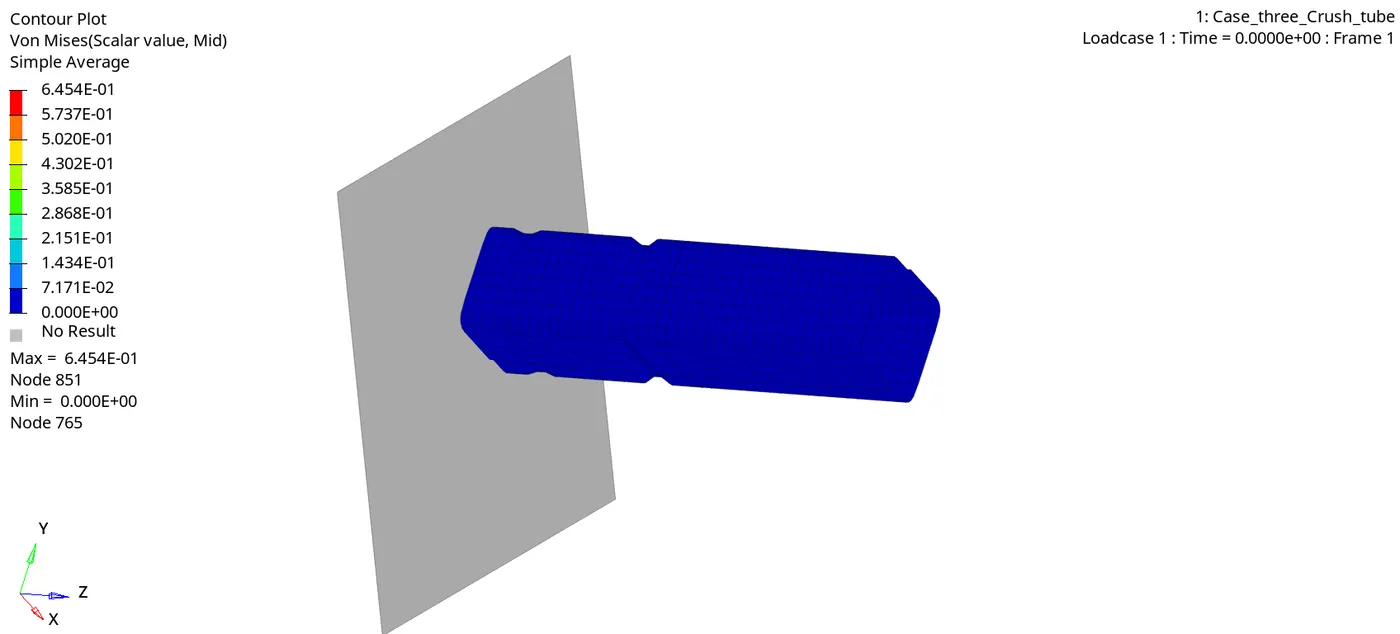
Strain contour:
Max strain developed = 1.08
3a) Plot of the Rigid Wall Forces.
- To plot the graph,go to Hypergraph 2D > Data File > Solver_file_T01 > Apply.
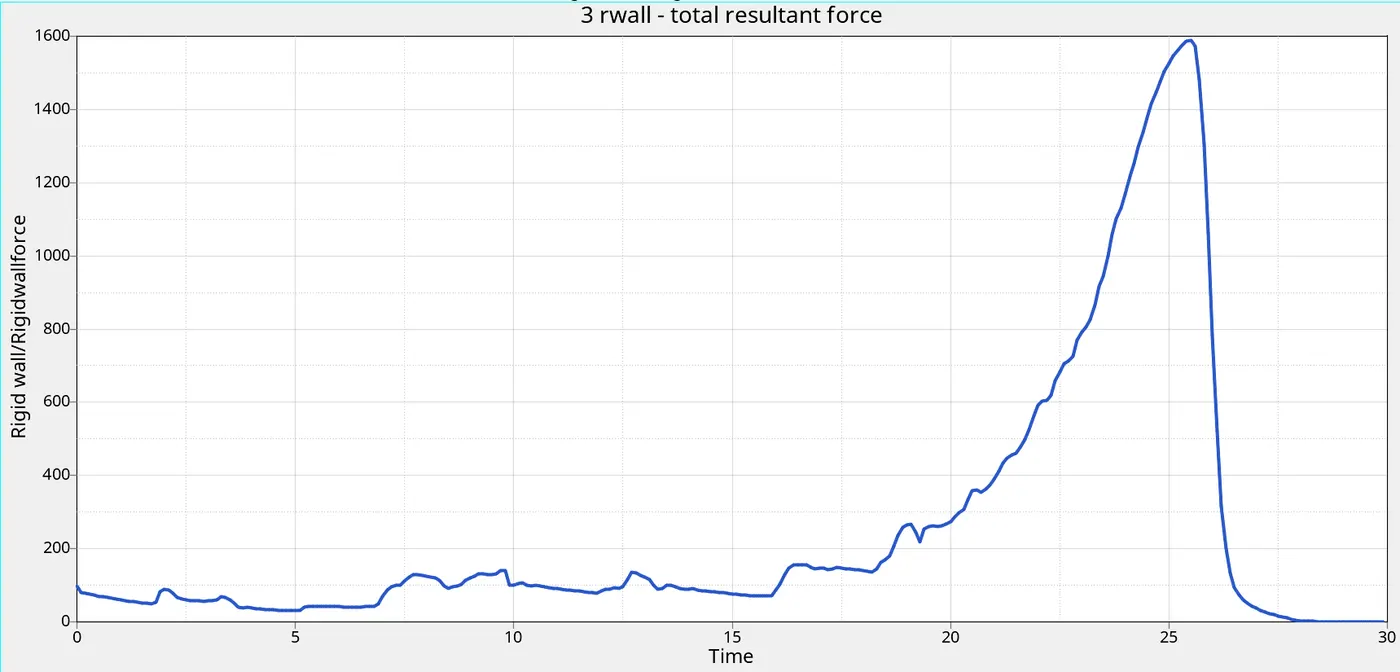
Rigidwall Max resultant force = 1588 N
- The graph obtained for the rigid wall forces . Here the rigid wall forces are increased when compared to the previous case.It is increased upto 1588 N.
- They are increased cause the type 11 contact is also defined with the type 7 contact,so they are increased.
3b) Plot of internal energy.
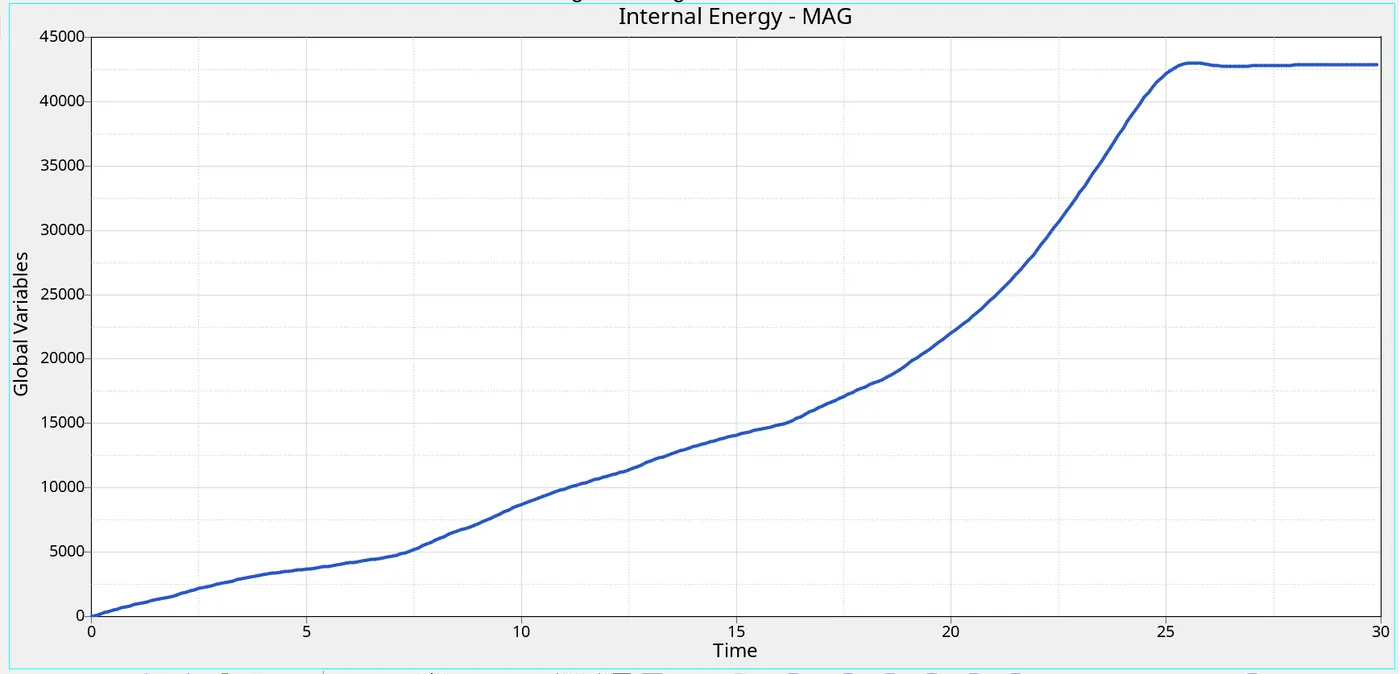
- Max internal energy = 43200 gm (mm /ms²)
- Initially internal energy of the steel tube is zero, because there is no contact between rigidwall and steel tube. after steel tube crush against the rigidwall deformation occurs , then the internal energy of the plate gradually increases,why because the deformation or displacement is happening,when the displacement increases the internal energy increases.
3c) Plot of kinetic energy.
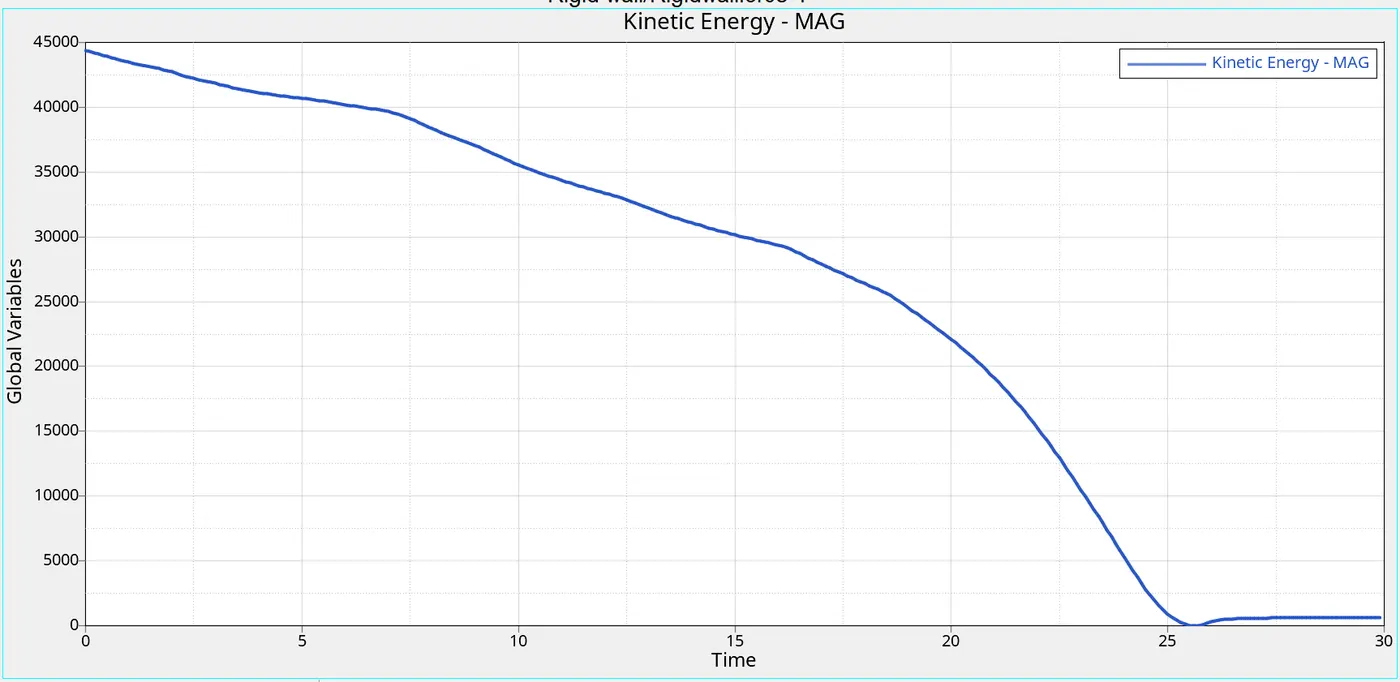
- Max kinetic energy = 44400 gm (mm /ms)²
- Here kinetic energy is increasing in the beginning itself,Why because the initial velocity is given for the component. And it goes on decreasing,cause the deformation is happening to the crash tube,so the kinetic energy is decreasing.
3d) Plot of self contact force.
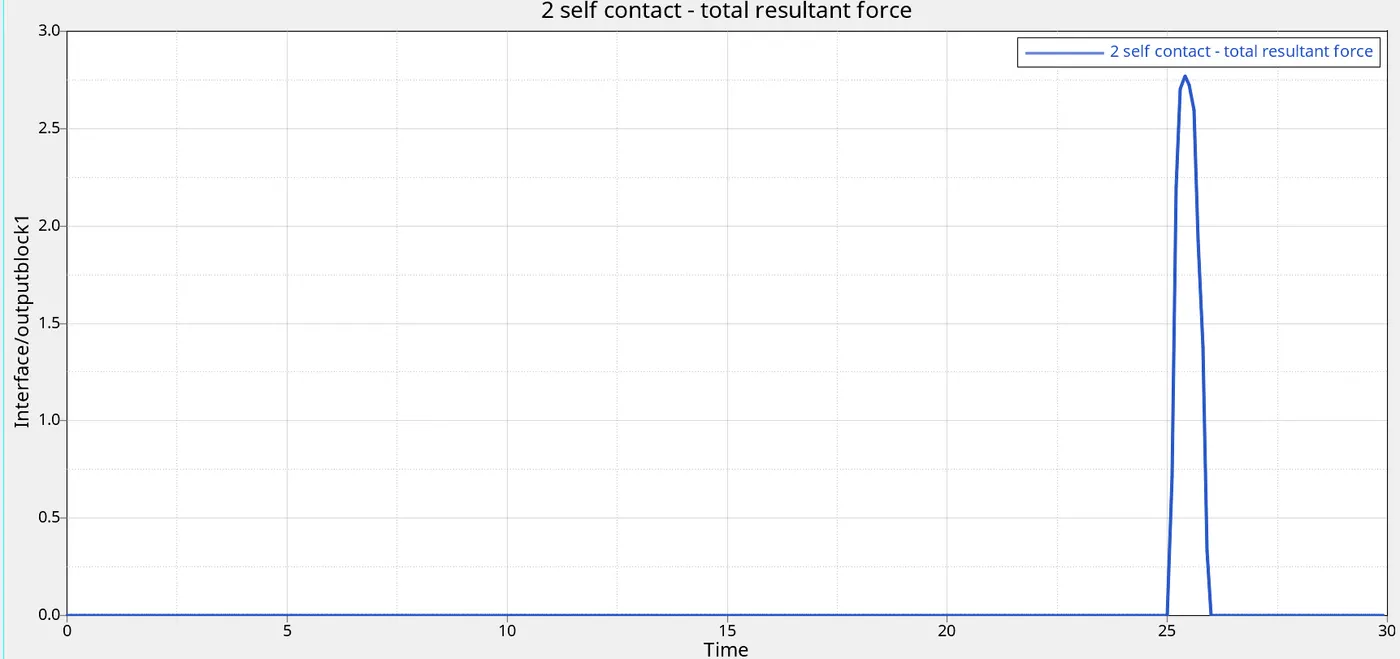
- Max contact resultant force = 2.77 N.
- Here the contact forces starts from origin and suddenly reaches peak,Cause the all the elements come into the contact,In that time the contact forces reaches peak and decreases cause the crash tube will be in rest after collision.
3e) Plot of seam weld total resultant force.
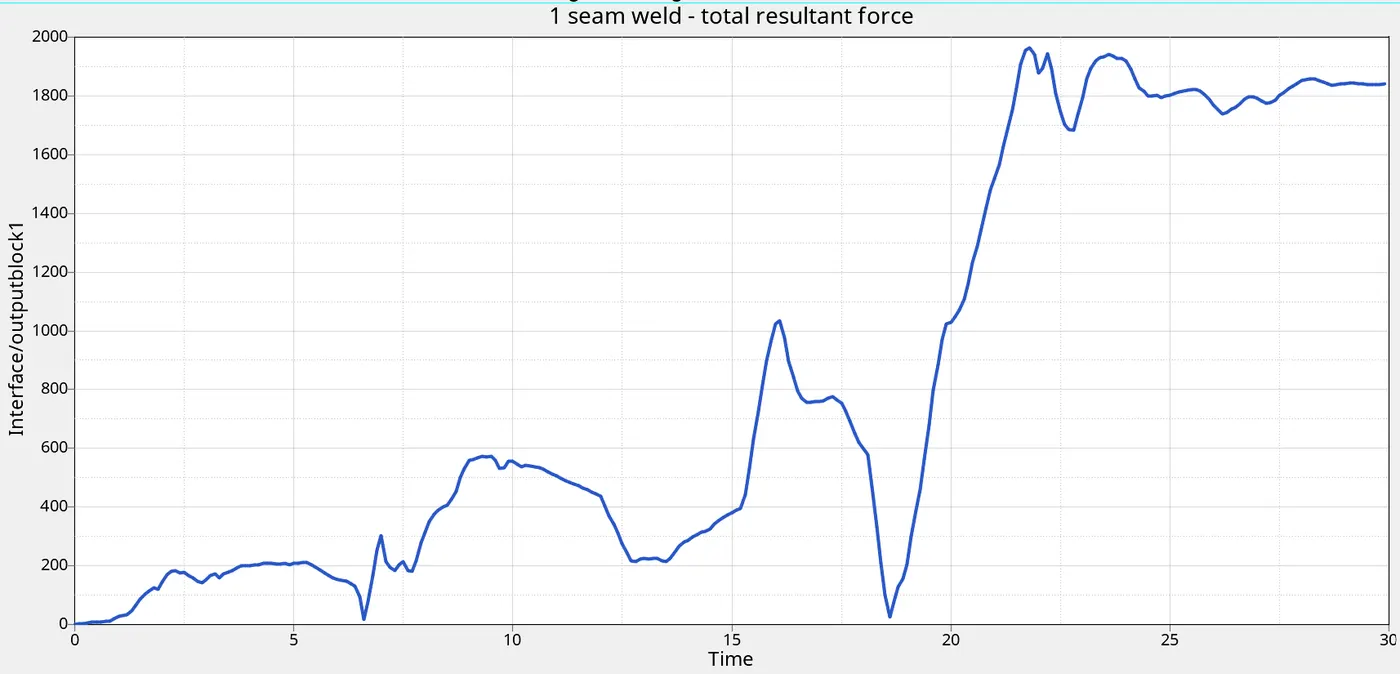
- Minimum seam weld resultant force = 1 N
- Maximum seam weld resultant force = 1964 N
- Initially seam weld force is low as 1N then after crushing starts on the crash tube it gradually increases upto 1964 N act on seam weld and it decreases,cause after collision,the crash tube will be at rest.
3f) Plot of Type 11 total resultant force.
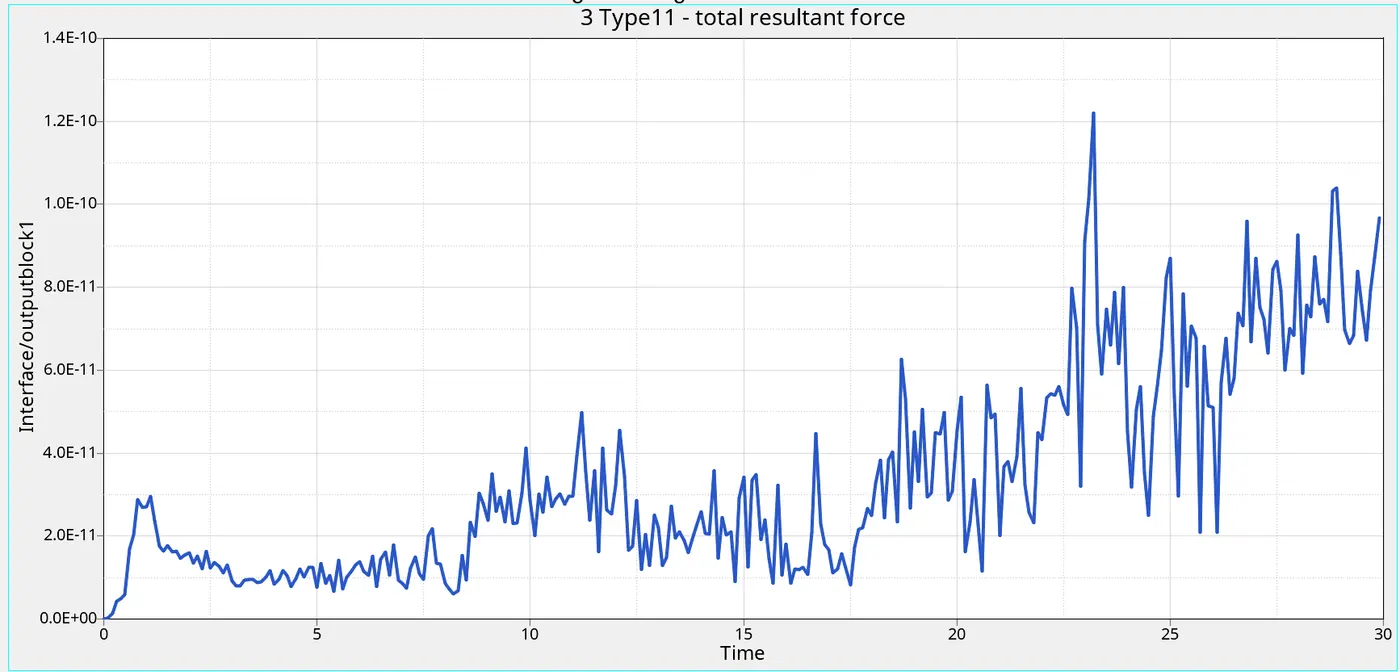
- Here the Type 11 Contact Forces are starting from origin and increasing due to the elements come into the contact and its suddenly reaches at peak due to there will be no edge to edge penetration,all the elements come into the contact,So its suddenly reaches the peak. And its decreasing after the collison,Cause the crash tube will be at rest.
3g) Plot of contact energy.
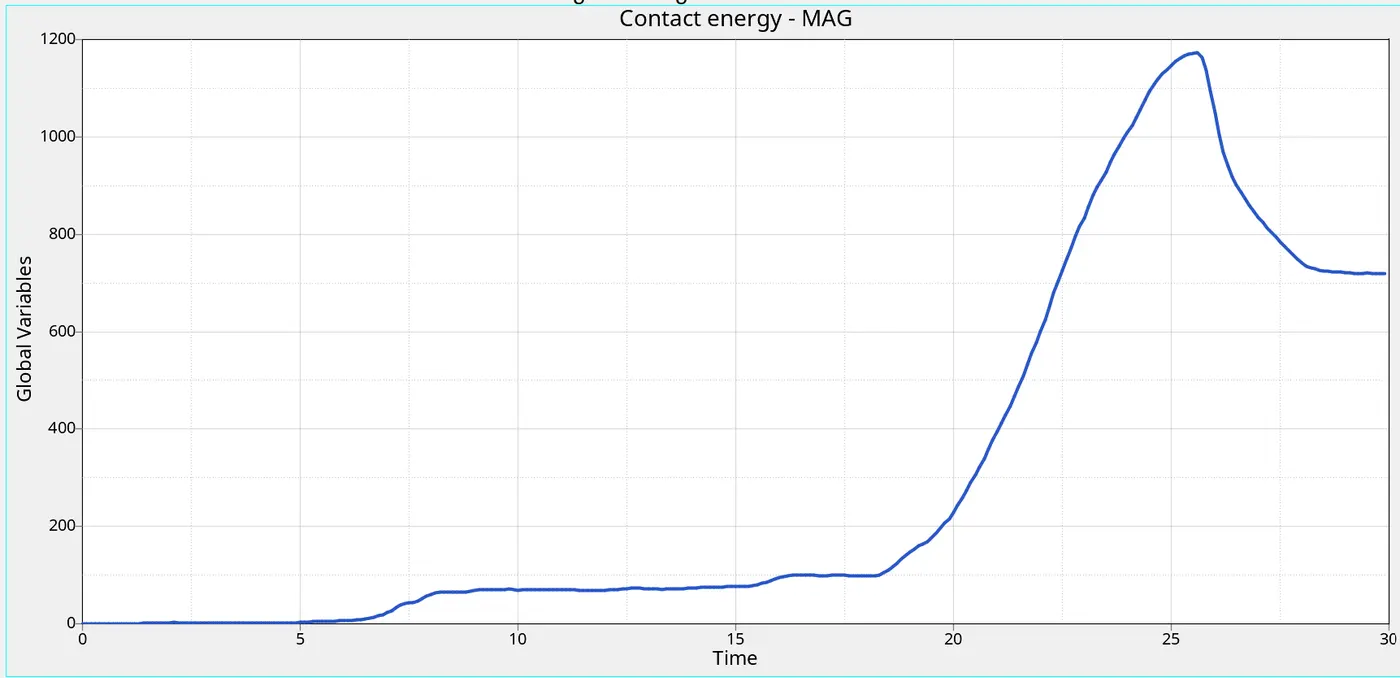
- Max contact energy = 1172
- Here the contact energy starts from origin,Cause the crash tube component is in intial condition. Intially there is no contact between the crash tube component and rigid wall.
- There is also no deformation intially,But when the component goes and hits on the rigid wall,The contact energy starts increasing. When the deformation or displacement happens to the component,the contact energy increases,cause the crash tube comes into the contact to the rigid wall.So the contact energy goes on increasing.And its decreasing after the collison,Cause the crash tube will be at rest.
3h) Plot of hour glass energy
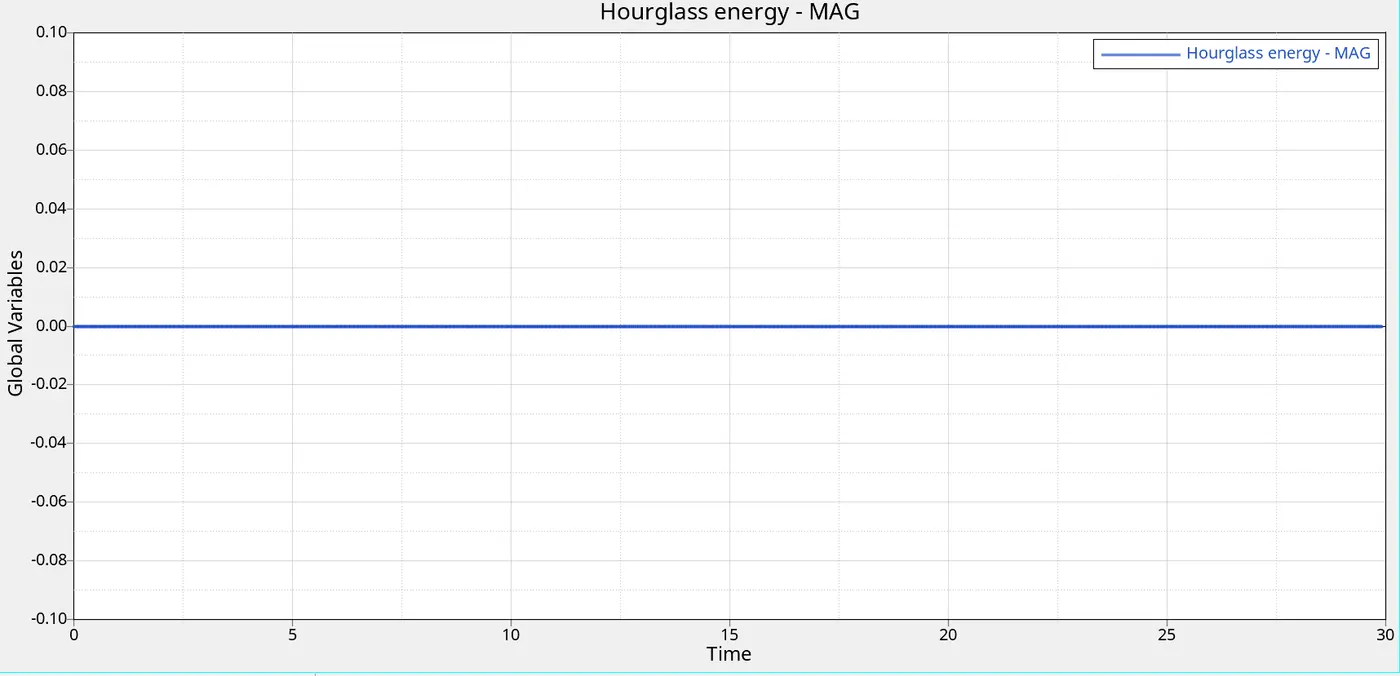
Here the hourglass energy is constant,Because the recommended parameter Ishell=24 has been assigned to the property card,So the hourglass energy is constant.
3i) Plot of total energy
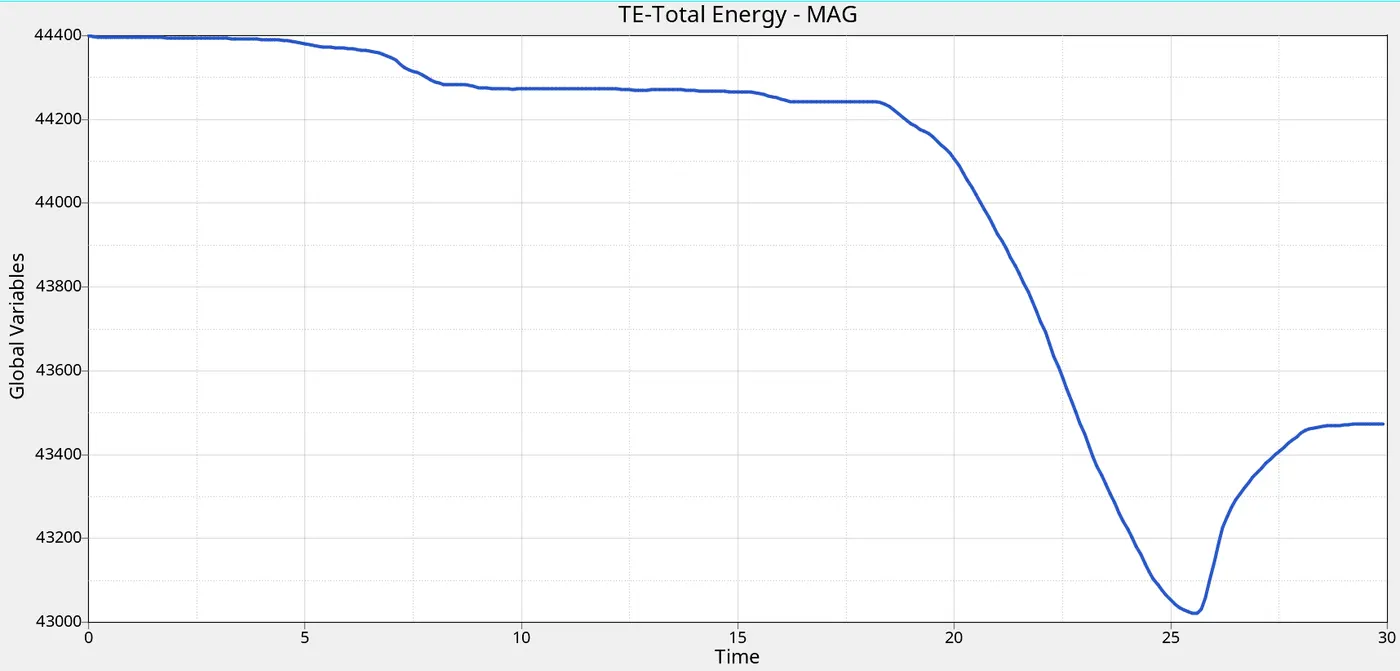
- Max total energy = 44400 gm (mm /ms)²
- Total Energy is sum of Kinetic Energy+Contact Energy+Hourglass Energy + Internal Energy. Here total energy starts from higher value,In starting itself its increasing,Why because the total energy is sum of Kinetic Energy+Contact Energy+Hourglass Energy + Internal Energy.
- All energies are in initial condition except kinetic energy,So kinetic energy is only there Total Energy=Kinetic Energy+0+0+0. Kinetic enrgy is directly proprtional to the total energy. So the total energy is increasing in the beginning. And its slightly decreasing,Due to -3.8% of energy error,the total energy is decreasing.
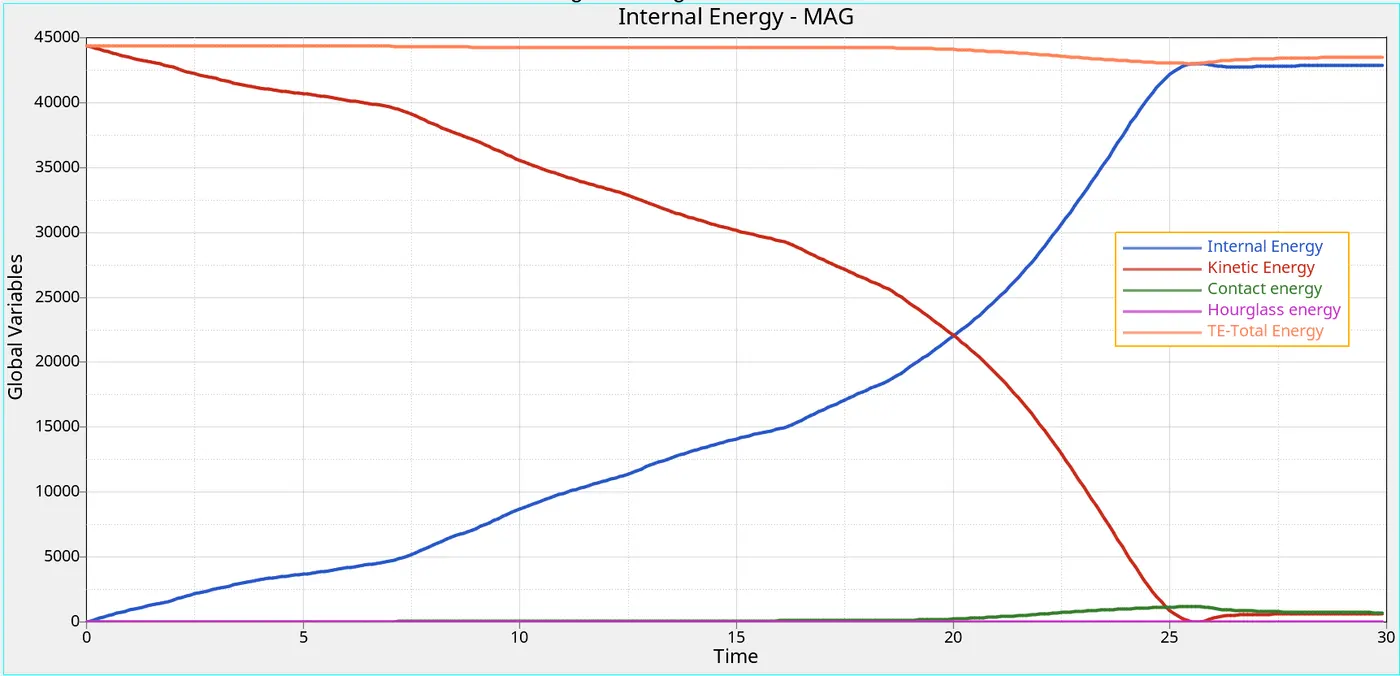
3J) plot of all energies.
CASE 4 : Remove both notches and remove boundary condition on rigid body node then run.
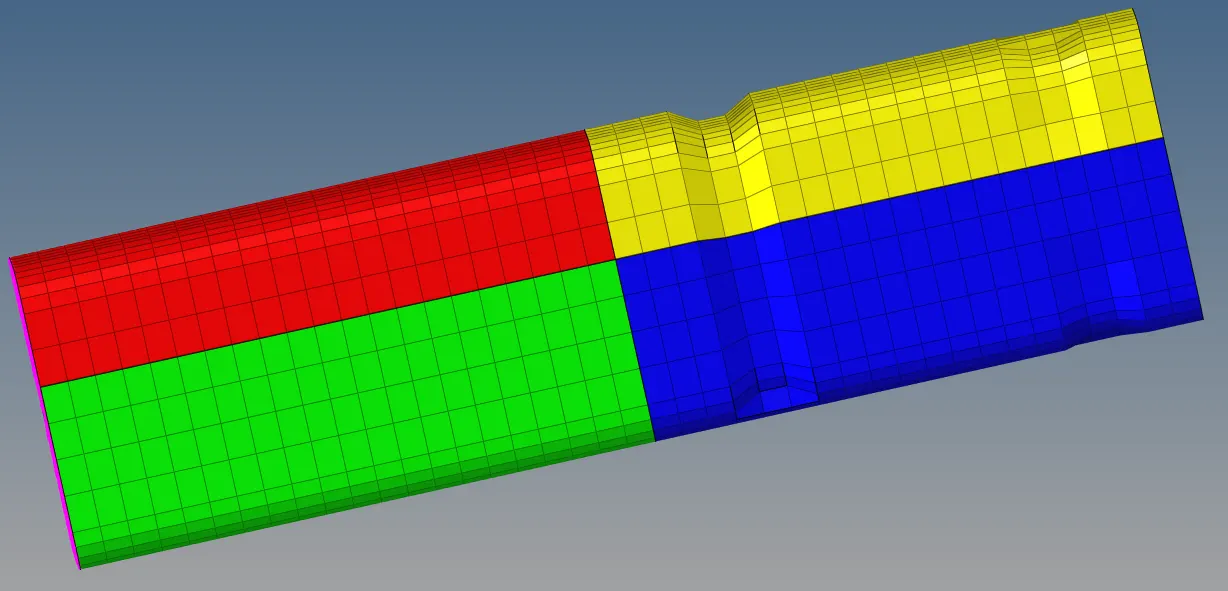
STEP 1 : Remove notches.
- To remove the notches,use align node tool and align them properly to remove the notches.
- To Align,Go to Geometry > Node Edit > Node 1,2,3 > Align Node.
Before notch removal
After notch removal
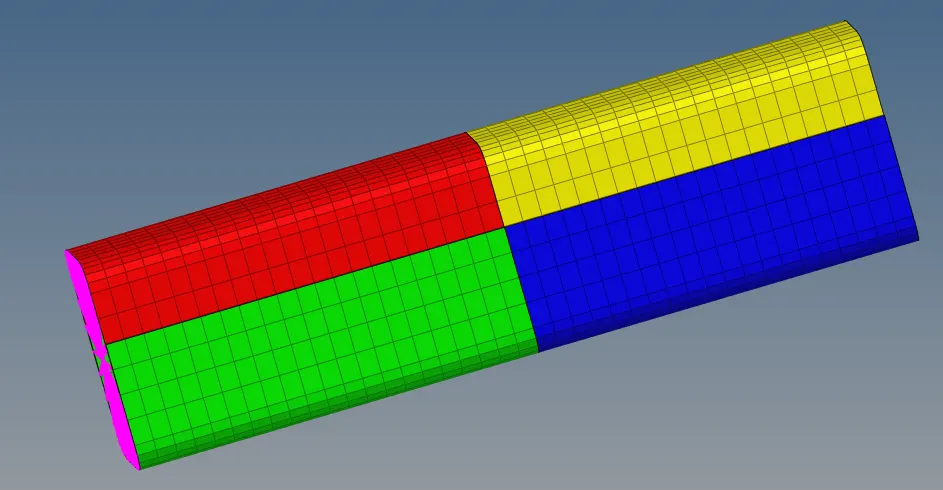
STEP 2 : Remove boundary condition on rigidbody.
- In order to remove boundary conditions by the following follow steps .
- Solver > BCS > body_12456 > right click and delete.
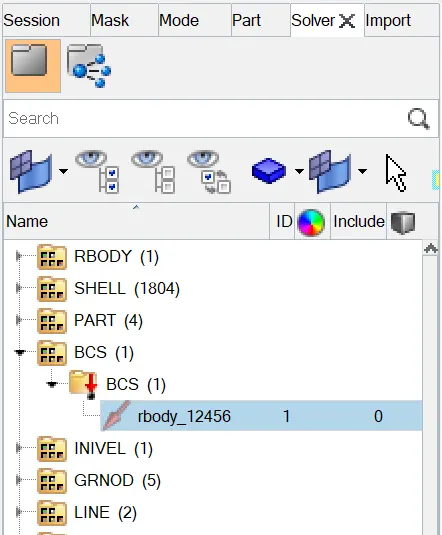
STEP 3 : Repeated the same steps as above case one.( Step 3 to step 6 )
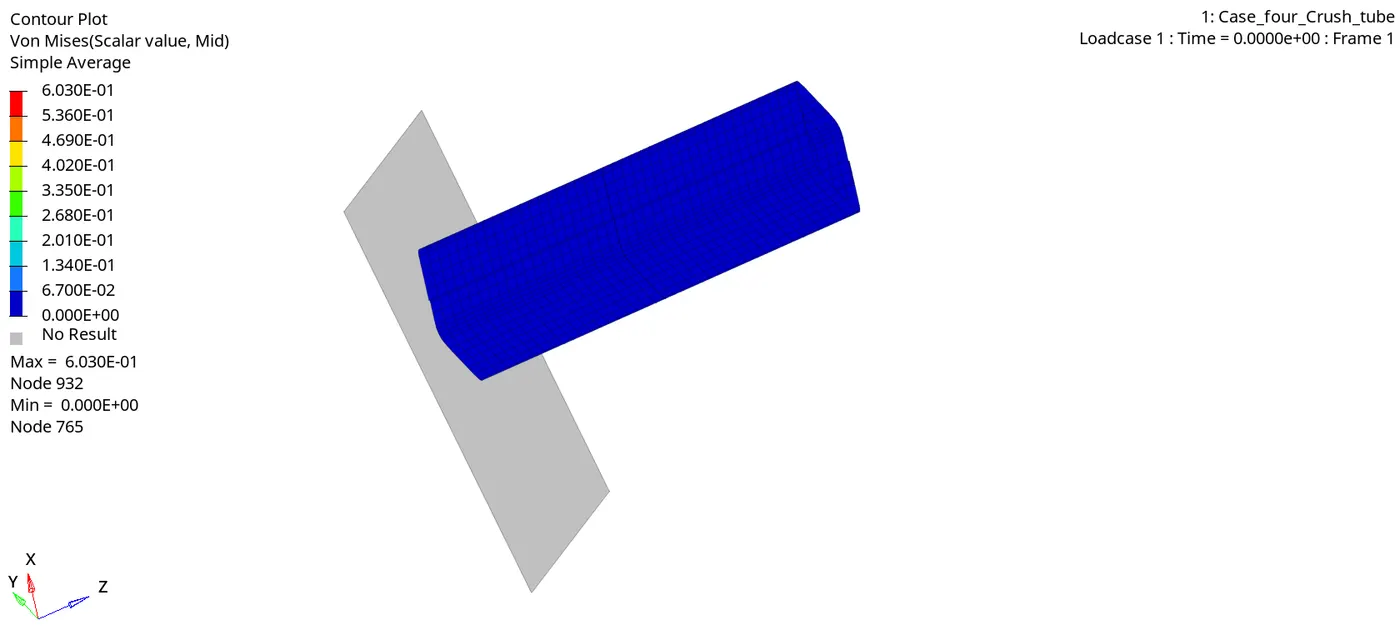
STEP 3 : Post processing
Stress contour :
Max stress developed = 0.603 Mpa.
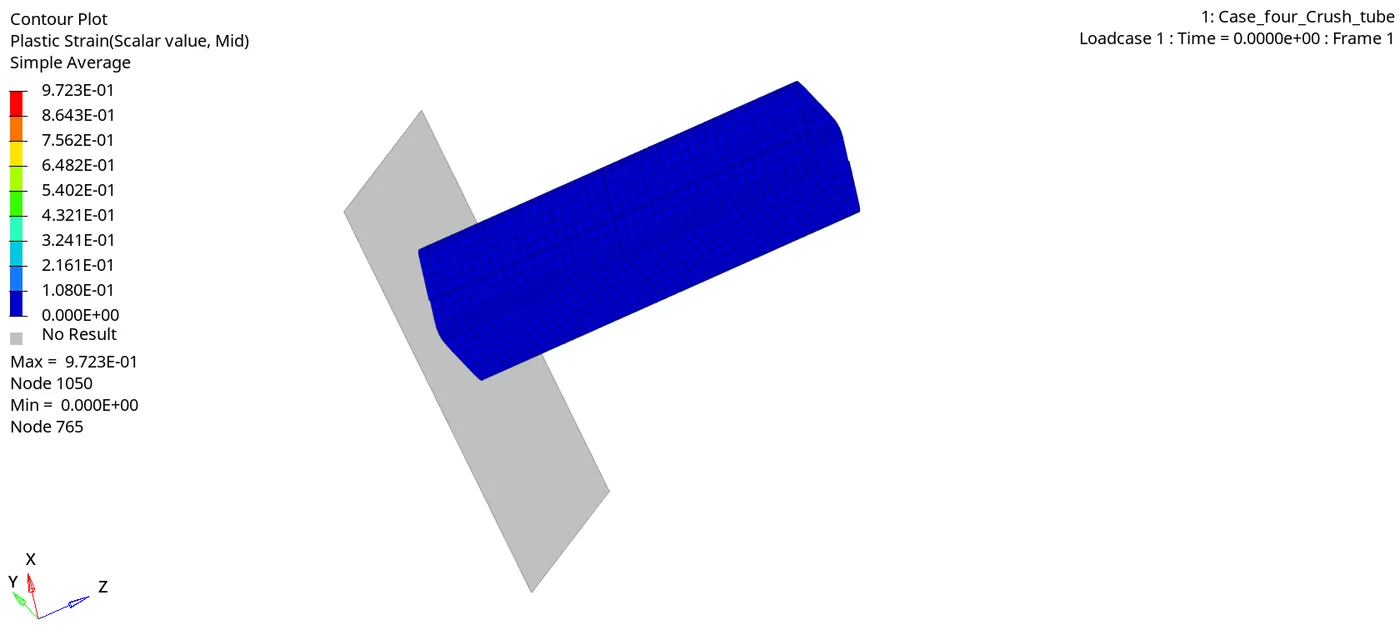
Strain contour:
Max strain developed = 0.972
3a) Plot of the Rigid Wall Forces.
- To plot the graph,go to Hypergraph 2D > Data File > Solver_file_T01 > Apply.
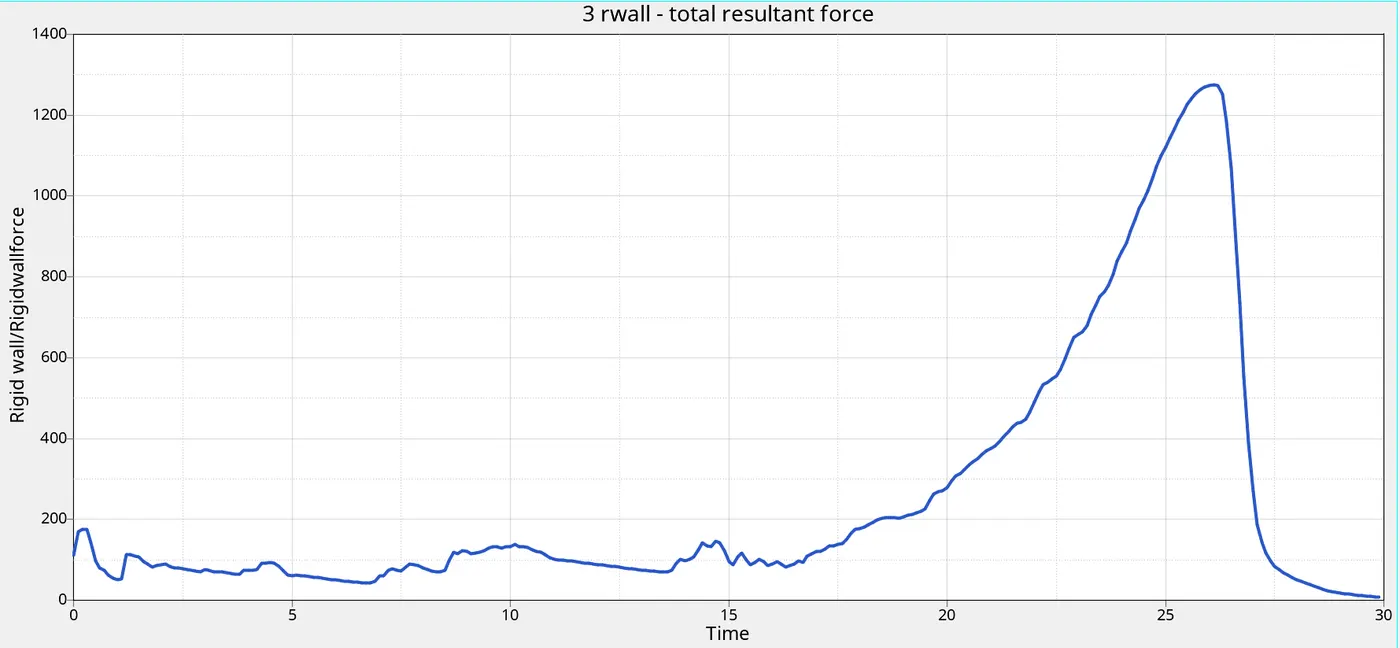
- Rigidwall Max resultant force = 1274 N.
- Here the rigid wall forces is reduced due to the removal of notches.
- The maximum rigid wall forces value obtained in this case is 1213.89.It is low when compared to the previous cases.
3b) Plot of internal energy.
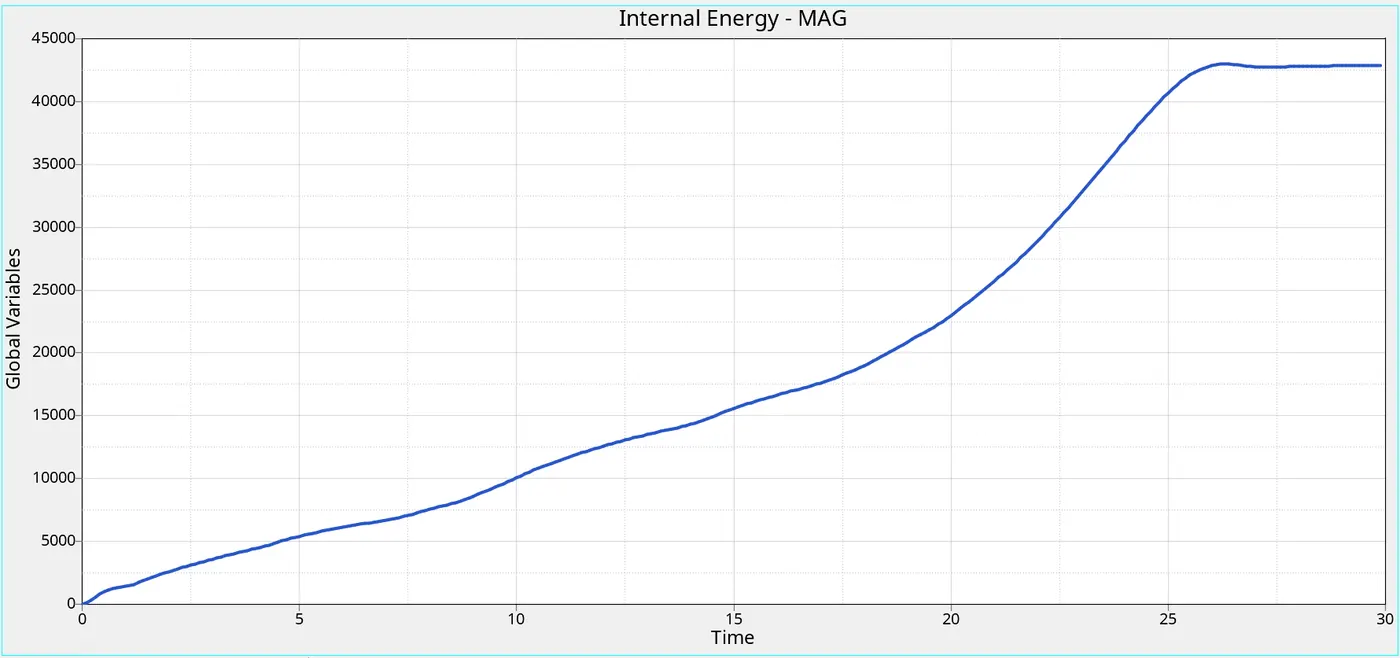
- Max internal energy = 42992 gm (mm /ms²).
- Initially internal energy of the steel tube is zero, because there is no contact between rigidwall and steel tube. after steel tube crush against the rigidwall deformation occurs , then the internal energy of the plate gradually increases,why because the deformation or displacement is happening,when the displacement increases the internal energy increases.
3c) Plot of kinetic energy.
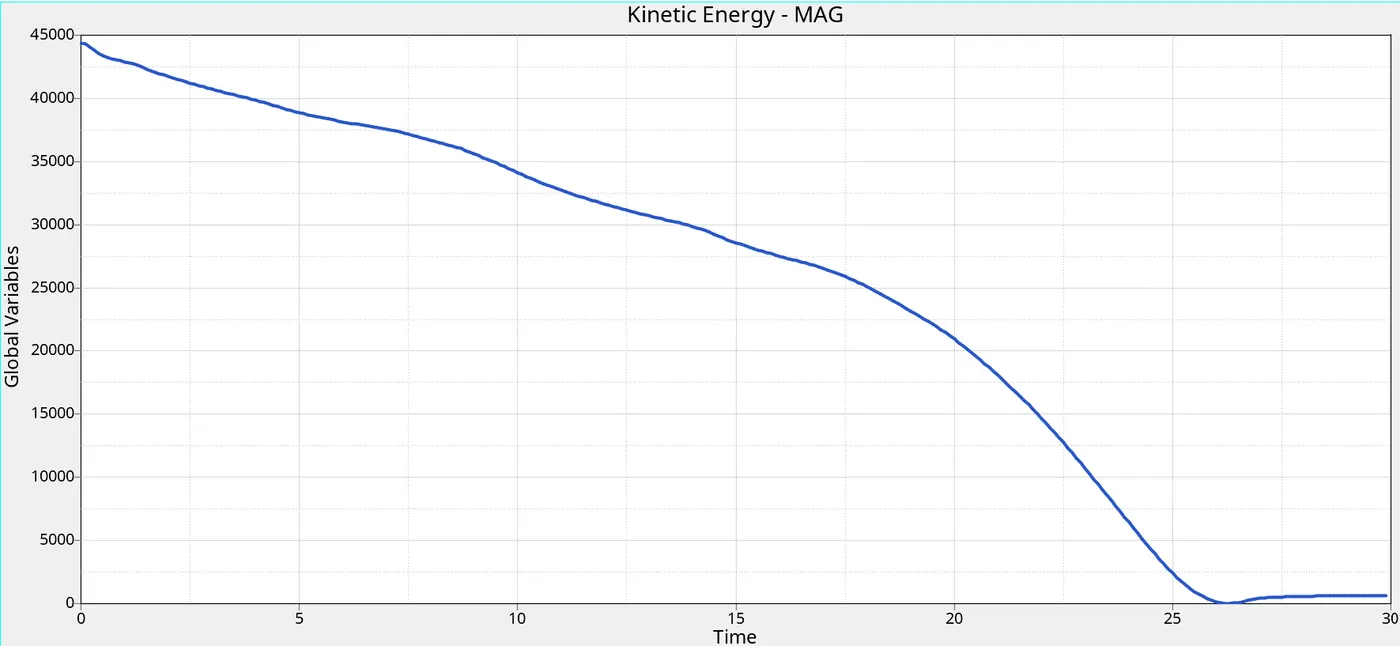
- Max kinetic energy = 44400 gm (mm /ms)²
- Here kinetic energy is increasing in the beginning itself,Why because the initial velocity is given for the component. And it goes on decreasing,cause the deformation is happening to the crash tube,so the kinetic energy is decreasing.
3d) Plot of self contact force.
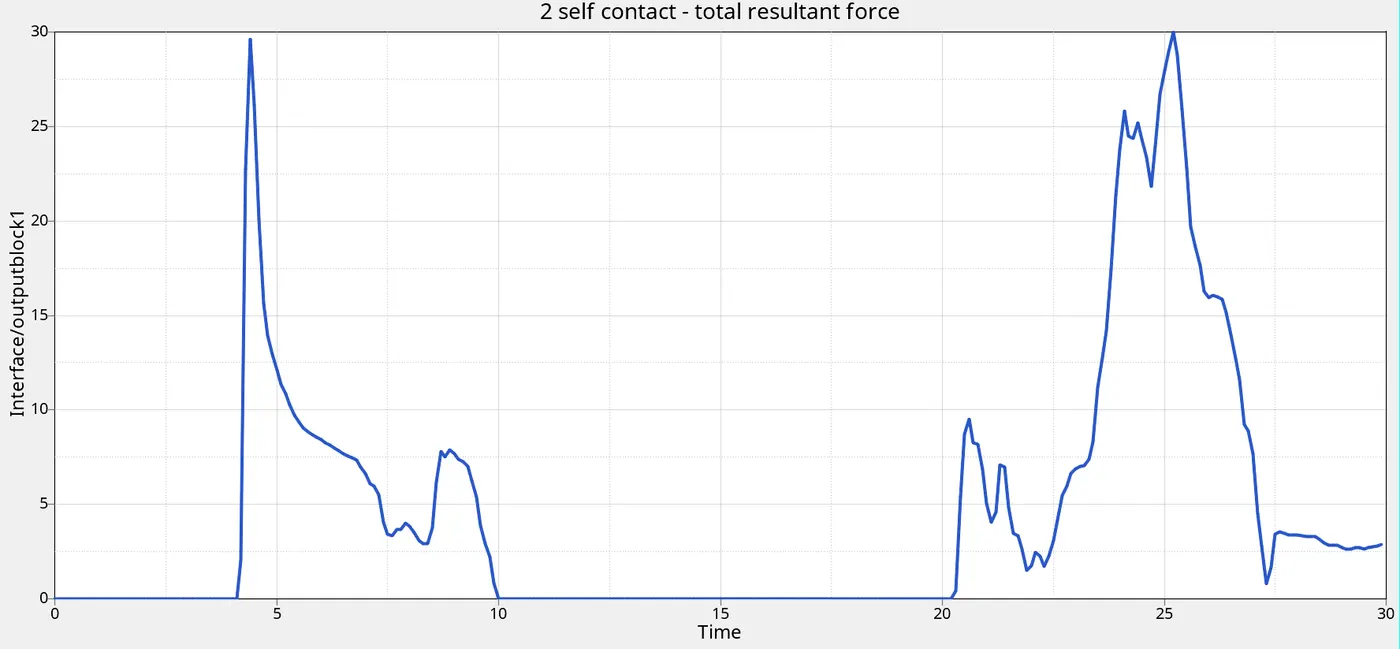
- Max contact resultant force = 30 N.
- The contact forces increases faster due to the removal of notches.
3e) Plot of seamweld force.
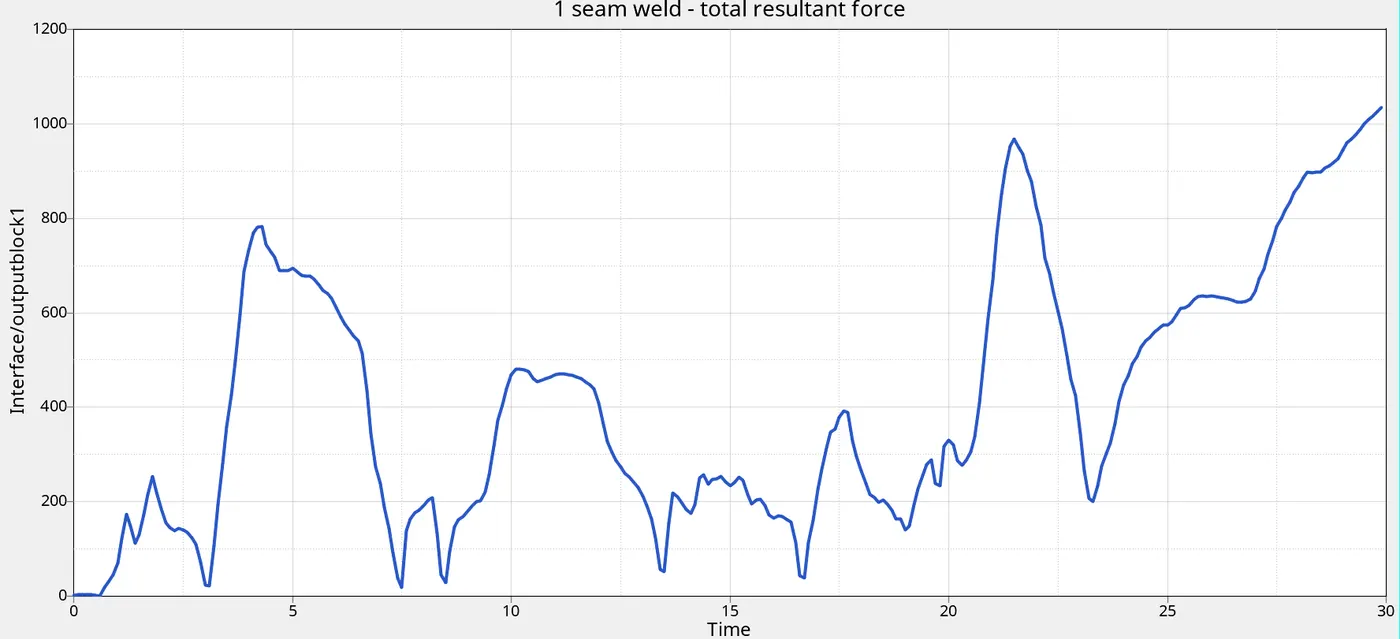
- Maximum seam weld resultant force = 1035 N.
- Initially seam weld force is low as 1N then after crushing starts on the crash tube it gradually increases upto 1035 N act on seam weld and it decreases, cause after collision,the crash tube will at rest.
3f) Plot of Type11 total resultant force.
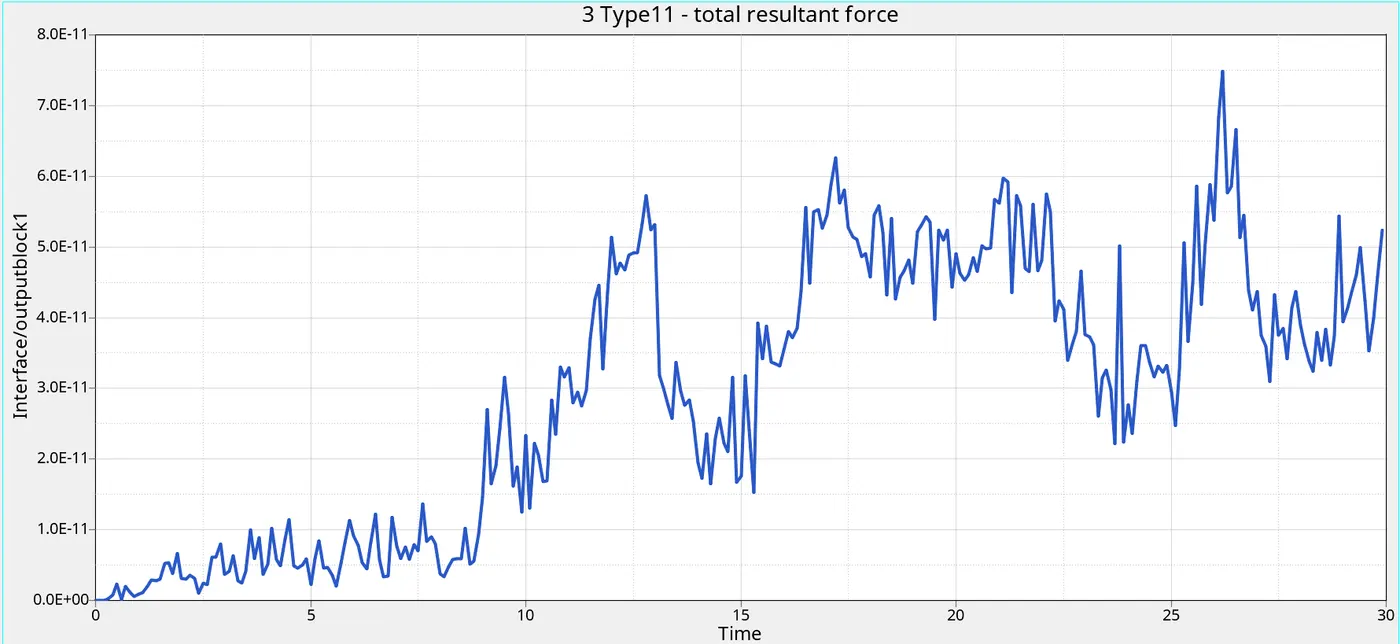
- Here the Type 11 Contact Forces are starting from origin and increasing due to the elements come into the contact and its suddenly reaches at peak due to there will be no edge to edge penetration,all the elements come into the contact,So its suddenly reaches the peak. And its decreasing after the collison,Cause the crash tube will be at rest.
3g) Plot of contact energy.
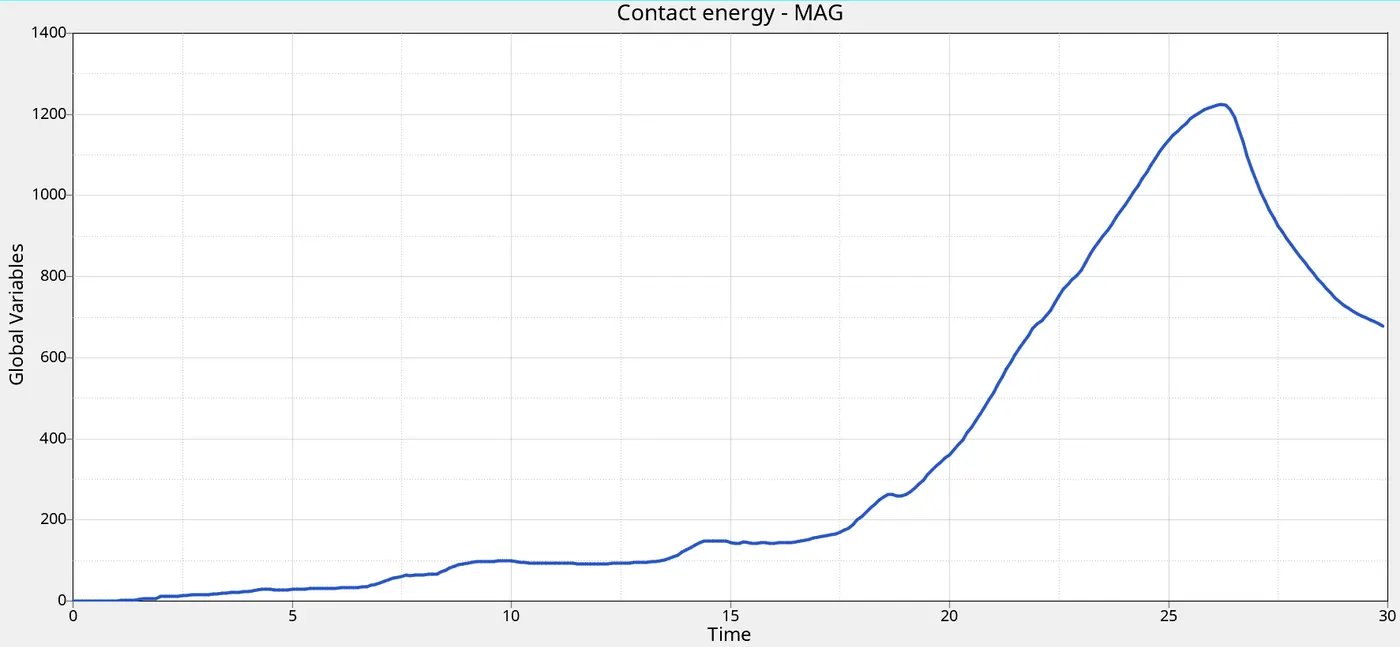
- Max contact energy = 1223
- Here the contact energy starts from origin,Cause the crash tube component is in intial condition. Intially there is no contact between the crash tube component and rigid wall.
- There is also no deformation intially,But when the component goes and hits on the rigid wall,The contact energy starts increasing upto 1223 is high because of removal of notches, when the deformation or displacement happens to the component,the contact energy increases,cause the crash tube comes into the contact to the rigid wall.So the contact energy goes on increasing.And its decreasing after the collison,Cause the crash tube will be at rest.
3h) Plot of total energy.
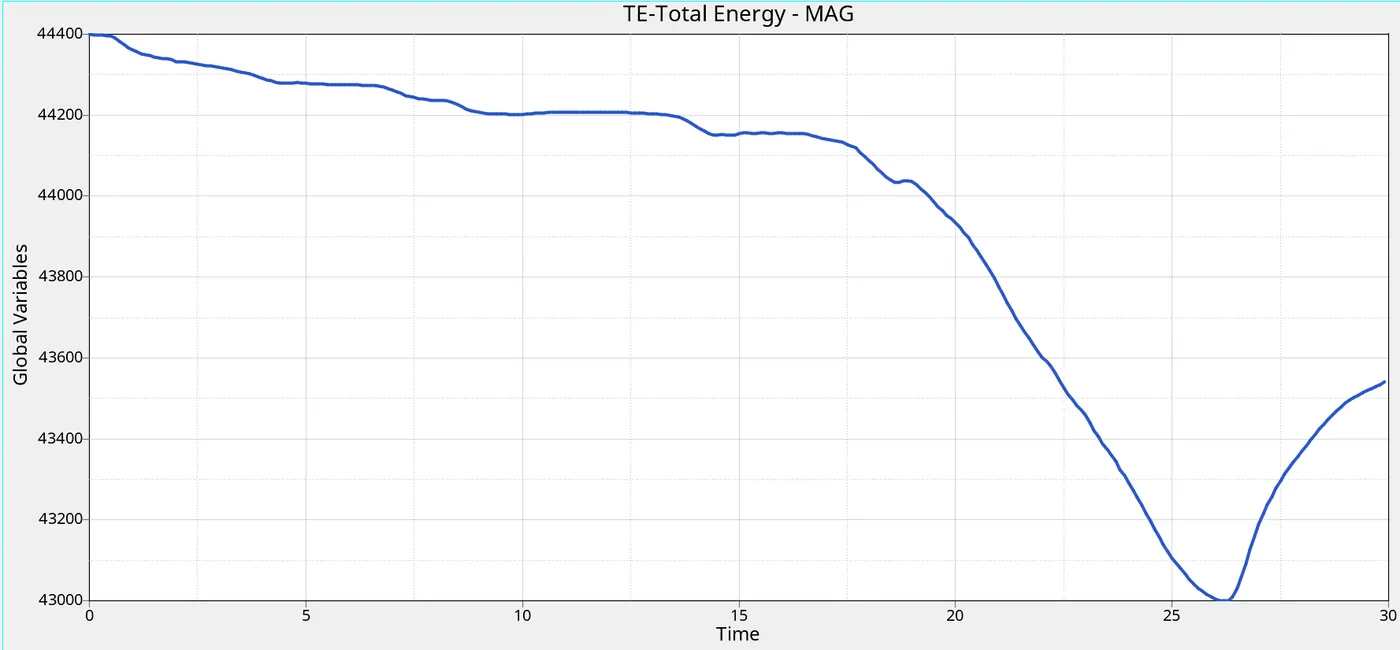
- Max total energy = 44400 gm (mm /ms)².
3I) Plot of all energies.
Case 5 : Create a new notch in the middle ,select the whole section and run.
STEP 1 : Creation of middle notch
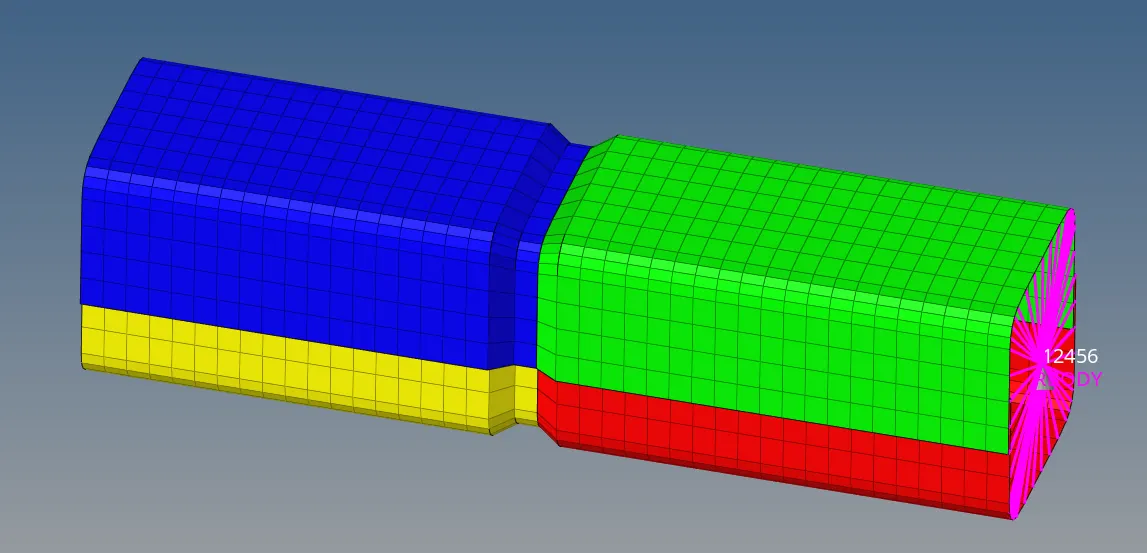
- In this case we have to create new notch at middle and boundary conditions on rigid body node.
- To create a new notch, we have to follow:
- Geom---->node edit---->align node---->select 1ST and 2nd (parallel node) ---->select nodes (which needs to modify)
- Once both notches are created at middle of crush tube, model will look like as shown in picture below.
STEP 2 : Repeated the same steps as above case one.( Step 3 to step 6 )
STEP 3 : Post processing
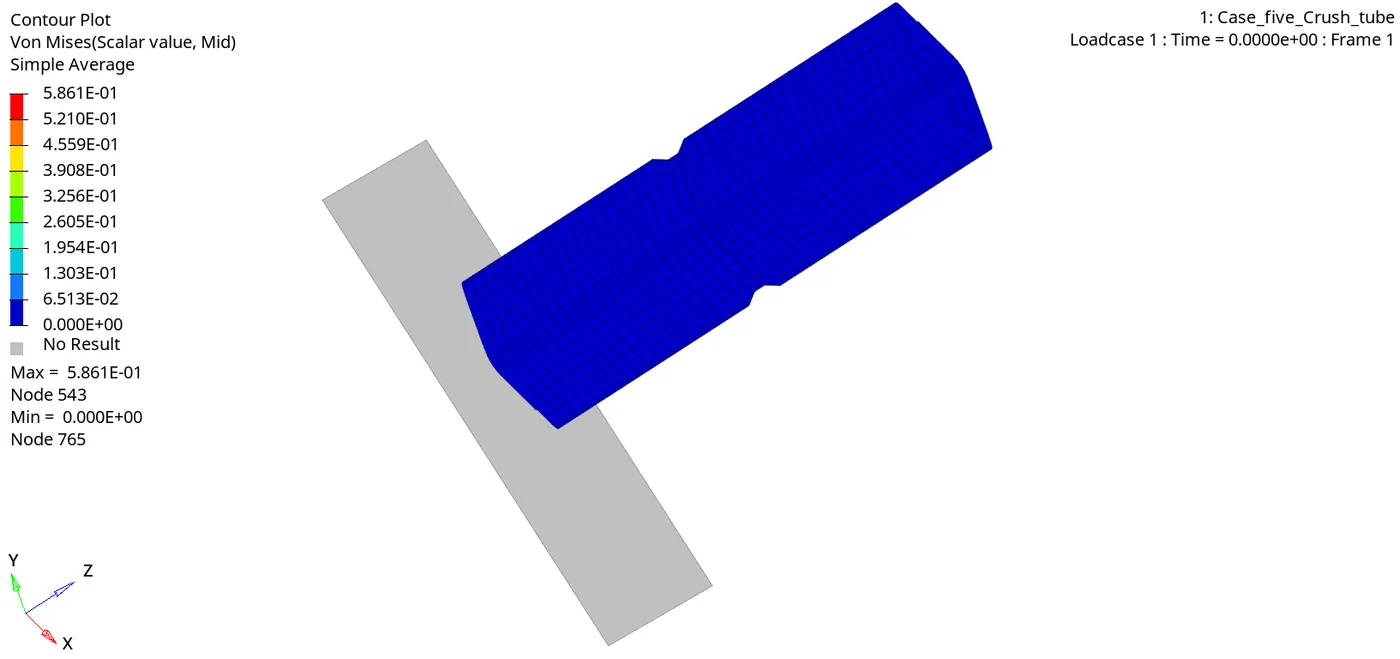
Stress contour :
Max stress developed = 0.586 Mpa.
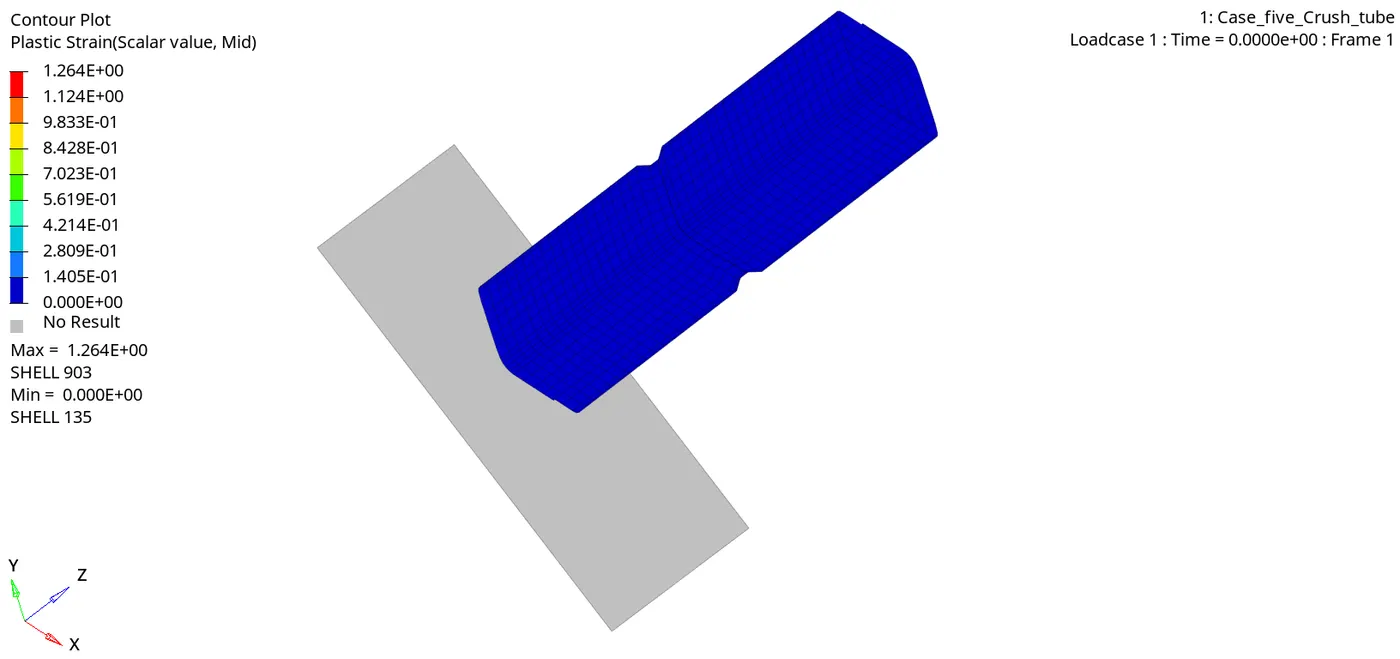
Strain contour:
Max strain developed = 1.26
3a) Plot of the Rigid Wall Forces.
- To plot the graph,go to Hypergraph 2D > Data File > Solver_file_T01 > Apply .
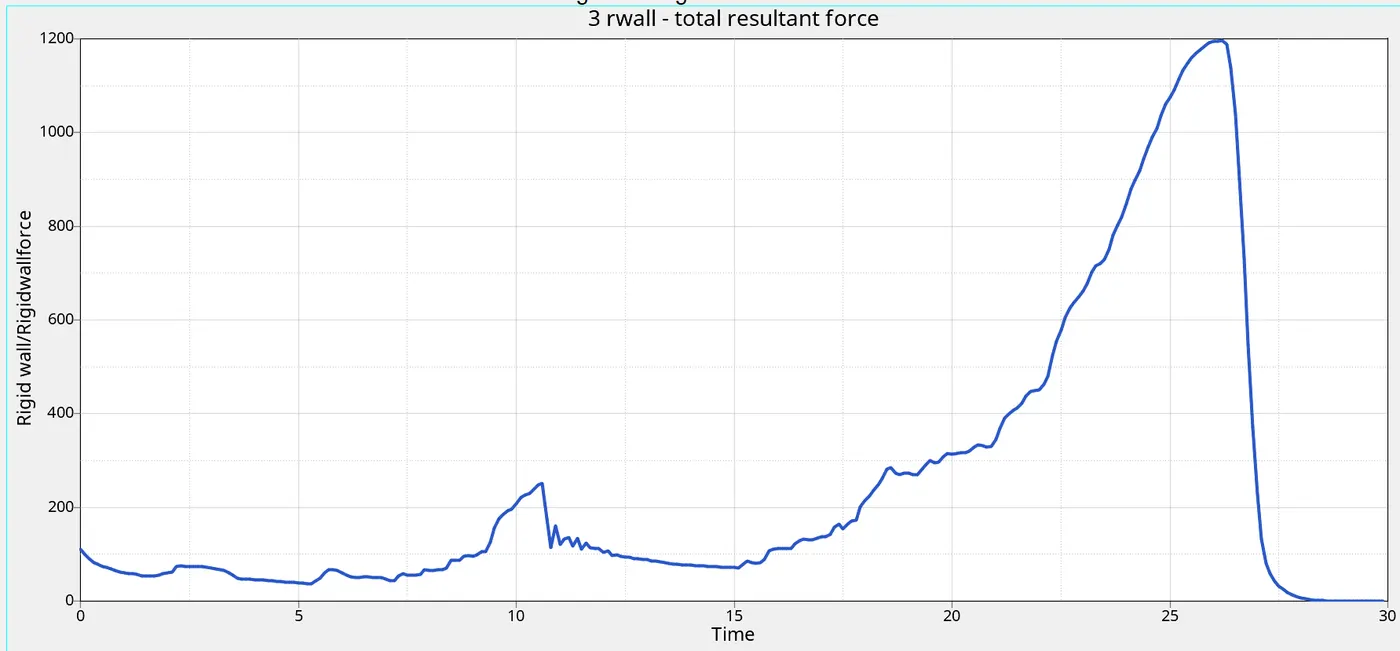
- Rigidwall Max resultant force = 1195 N.
- Here the rigid wall forces is reduced due to the created a new notch in the middle.
- The maximum rigid wall forces value obtained in this case is 1195 N It is low when compared to the previous cases.
3b) Plot of internal energy.
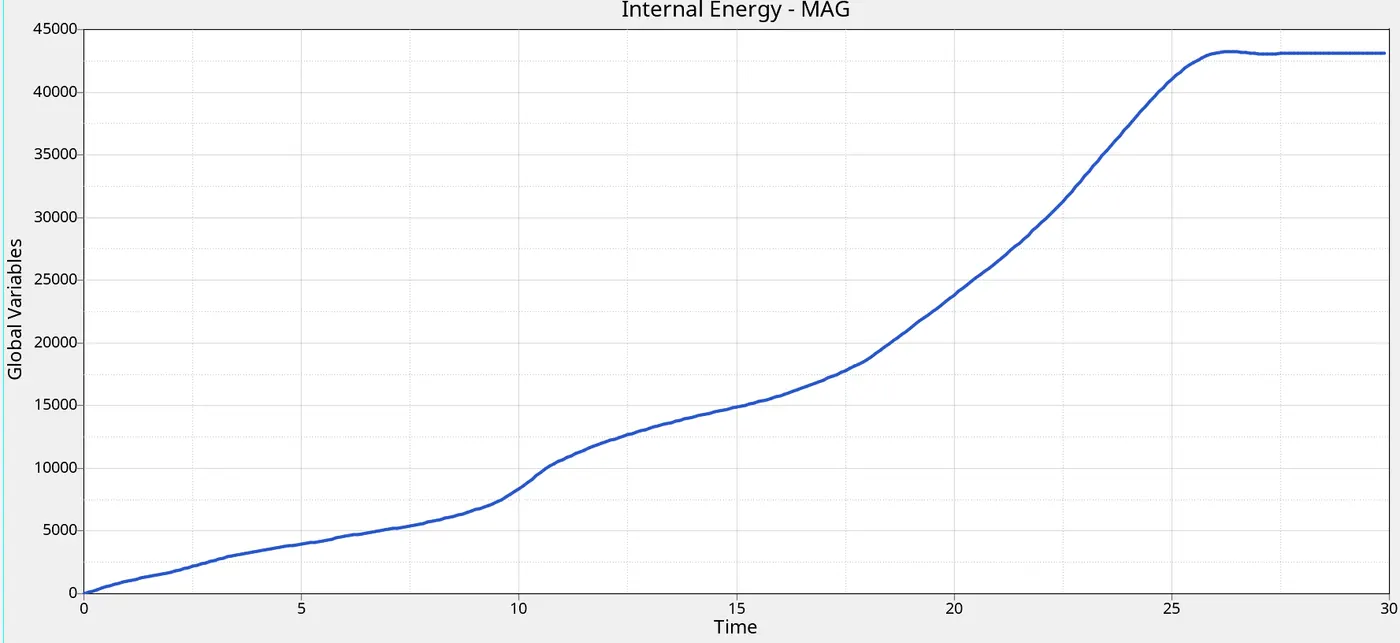
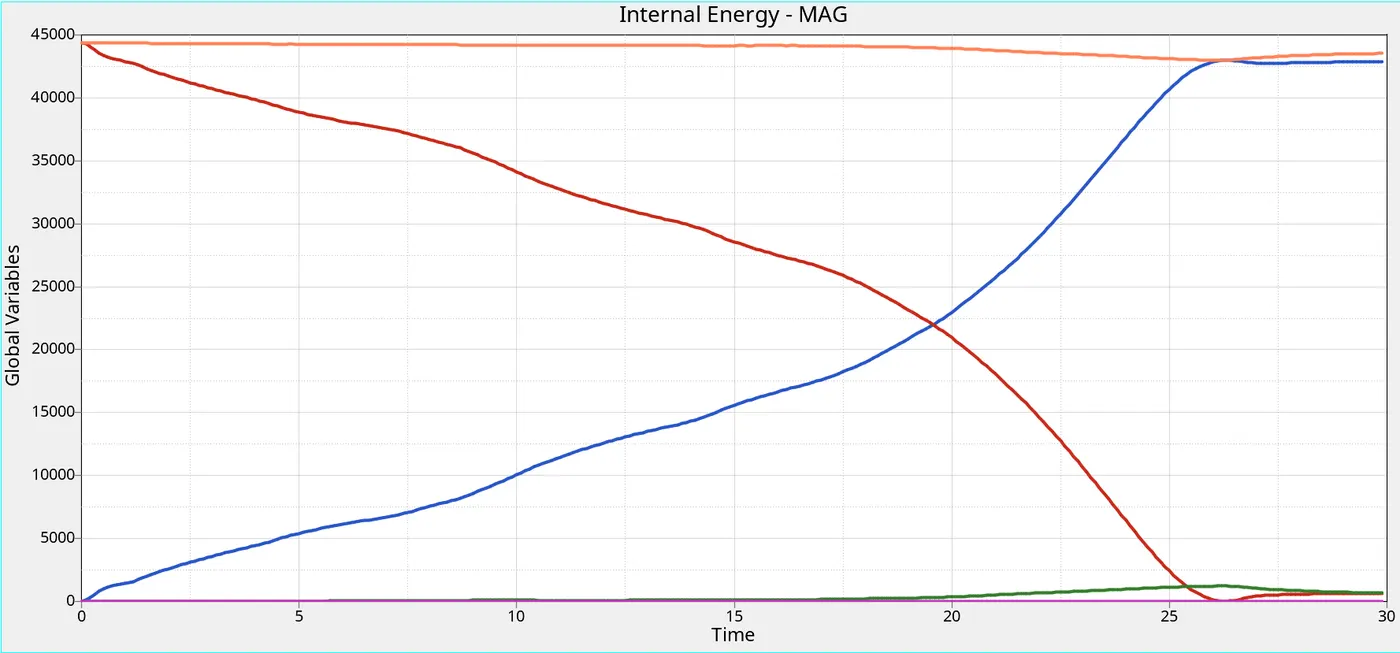
- Max internal energy = 43267 gm (mm /ms²).
- Initially internal energy of the steel tube is zero, because there is no contact between rigidwall and steel tube. after steel tube crush against the rigidwall deformation occurs , then the internal energy of the plate gradually increases,why because the deformation or displacement is happening,when the displacement increases the internal energy increases.
3c) Plot of kinetic energy.
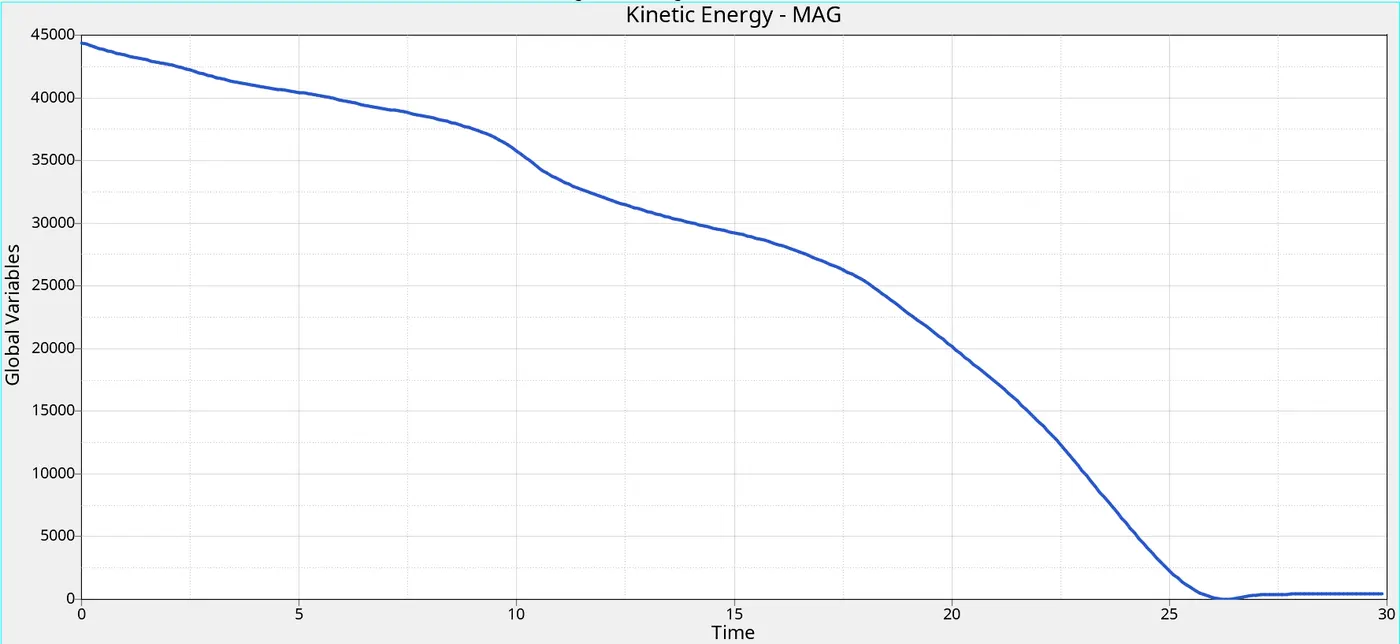
- Max kinetic energy = 44400 gm (mm /ms)²
- Here kinetic energy is increasing in the beginning itself,Why because the initial velocity is given for the component. And it goes on decreasing,cause the deformation is happening to the crash tube, so the kinetic energy is decreasing.
3d ) Plot of seamweld force.
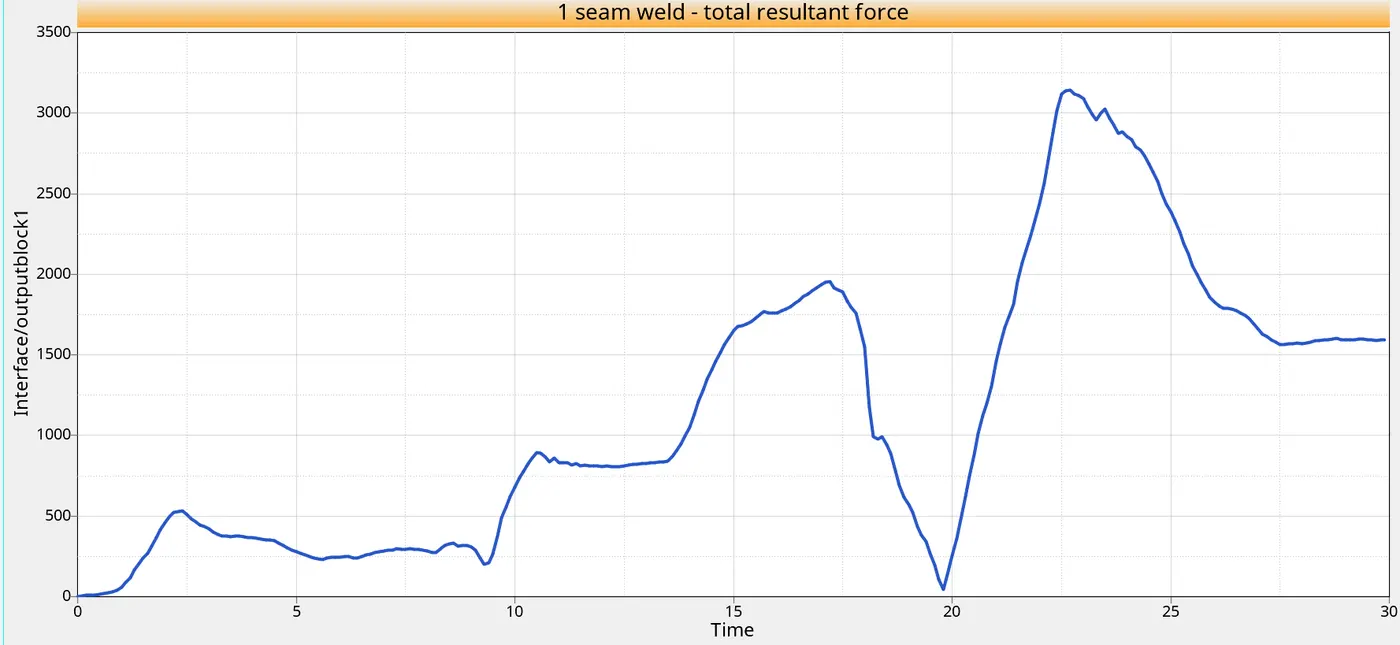
- Maximum seam weld resultant force = 3143 N.
- Initially seam weld force is low as 1N then after crushing starts on the crash tube it gradually increases upto 3143 N act on seam weld and it decreases, cause after collision,the crash tube will at rest.
3e) Plot of self contact force.
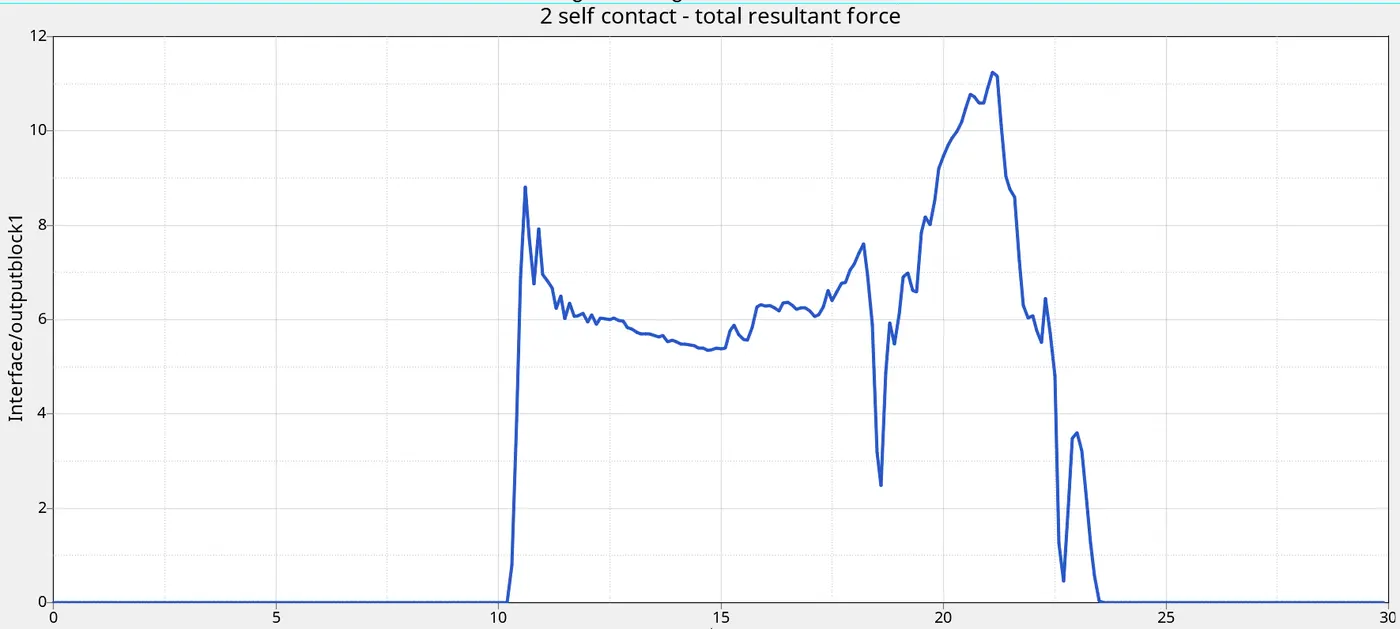
- Max contact resultant force = 11.25 N.
- The contact forces is decreases compared to previous case because of insertion of notches in the middle of the crash tube.
3f) Plot of TYPE11 force.
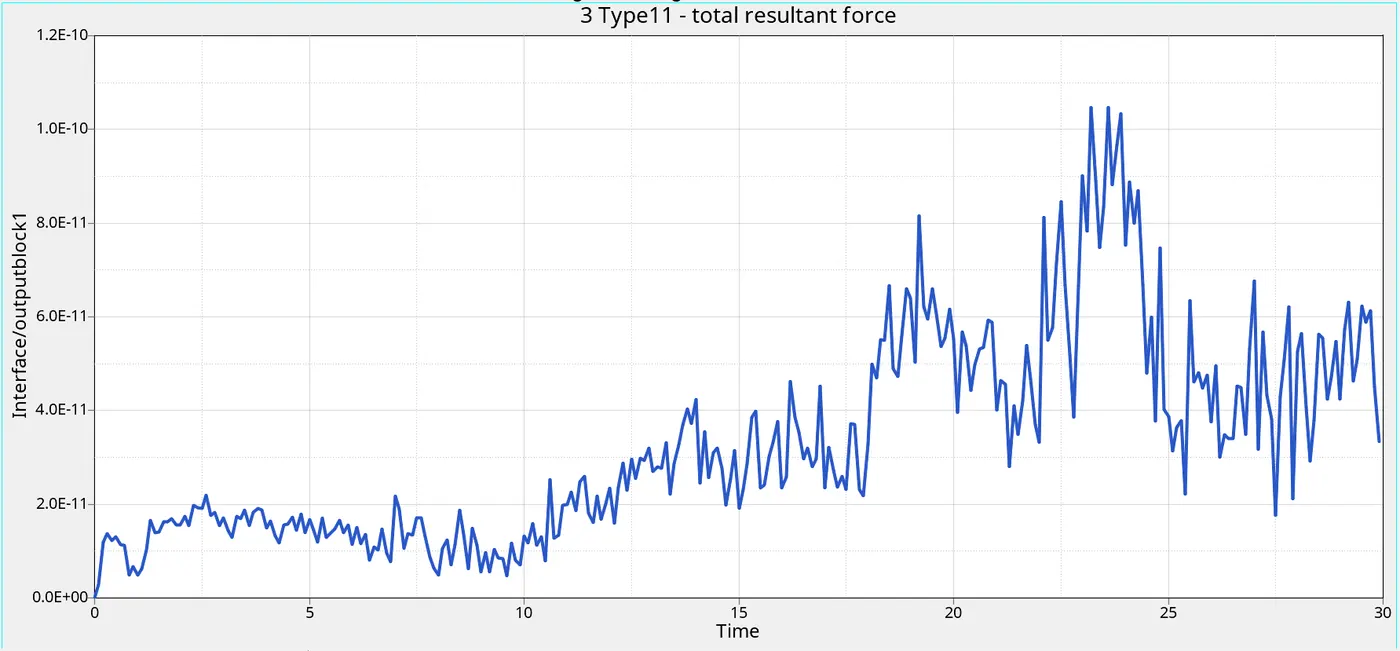
- Here the Type 11 Contact Forces are starting from origin and increasing due to the elements come into the contact and its suddenly reaches at peak due to there will be no edge to edge penetration,all the elements come into the contact,So its suddenly reaches the peak. And its decreasing after the collison,Cause the crash tube will be at rest.
3g) Plot of contact energy
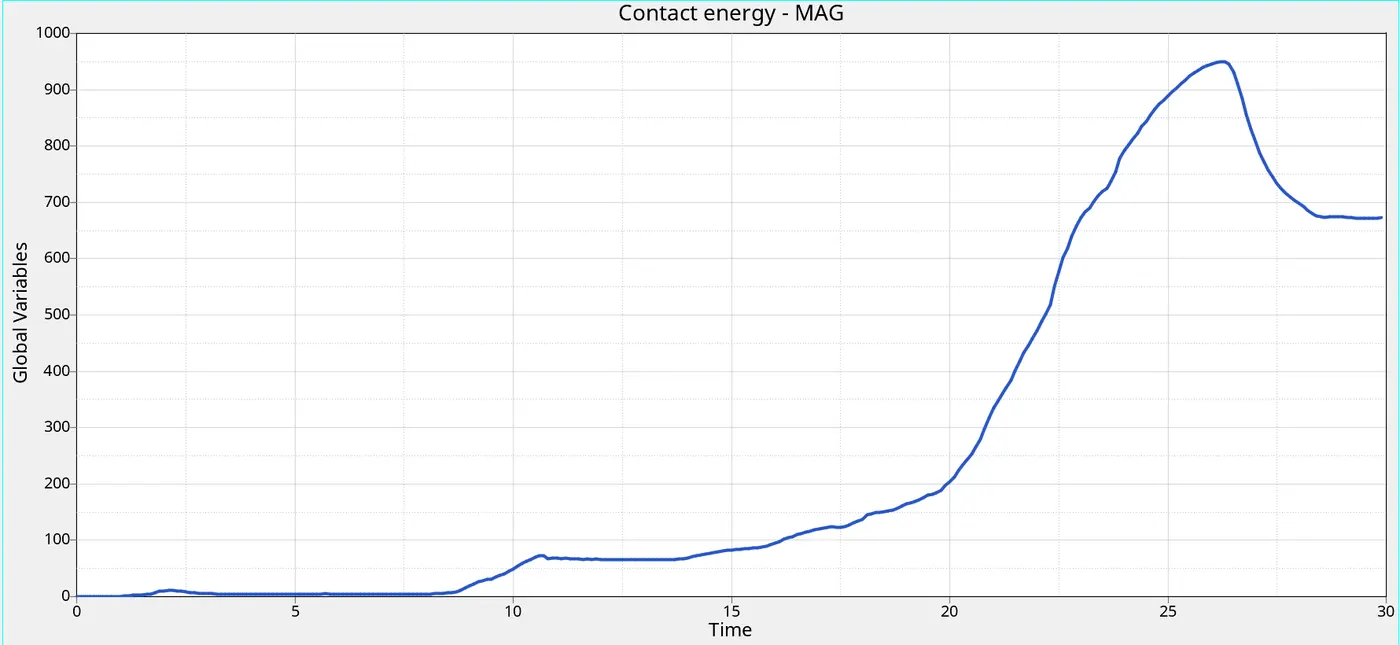
- Max contact energy = 949.31
- Here the contact energy starts from origin,Cause the crash tube component is in intial condition. Intially there is no contact between the crash tube component and rigid wall.
- There is also no deformation intially,But when the component goes and hits on the rigid wall,The contact energy starts increasing upto 949.31 is lesser than the previous case because of insertion of notches in the middle of that section, when the deformation or displacement happens to the component,the contact energy increases,cause the crash tube comes into the contact to the rigid wall.So the contact energy goes on increasing.And its decreasing after the collison,cause the crash tube will be at rest.
3h) Plot of hourglass energy.
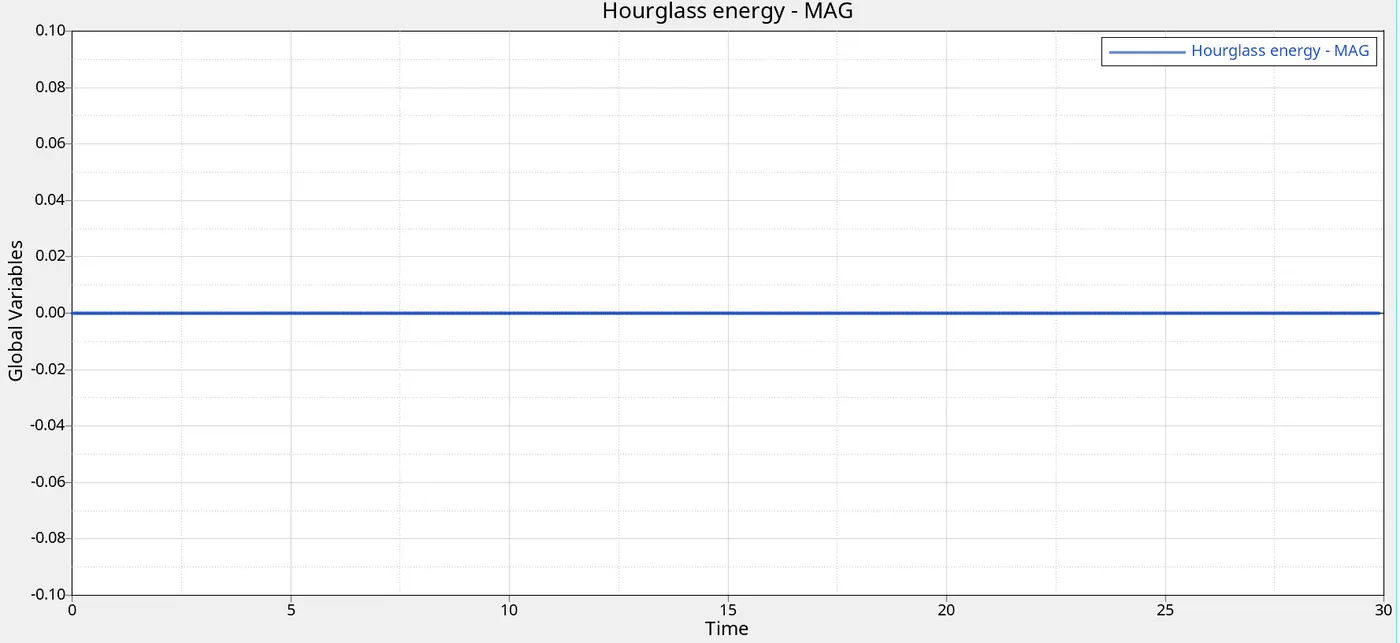
3I) Plot of total energies.
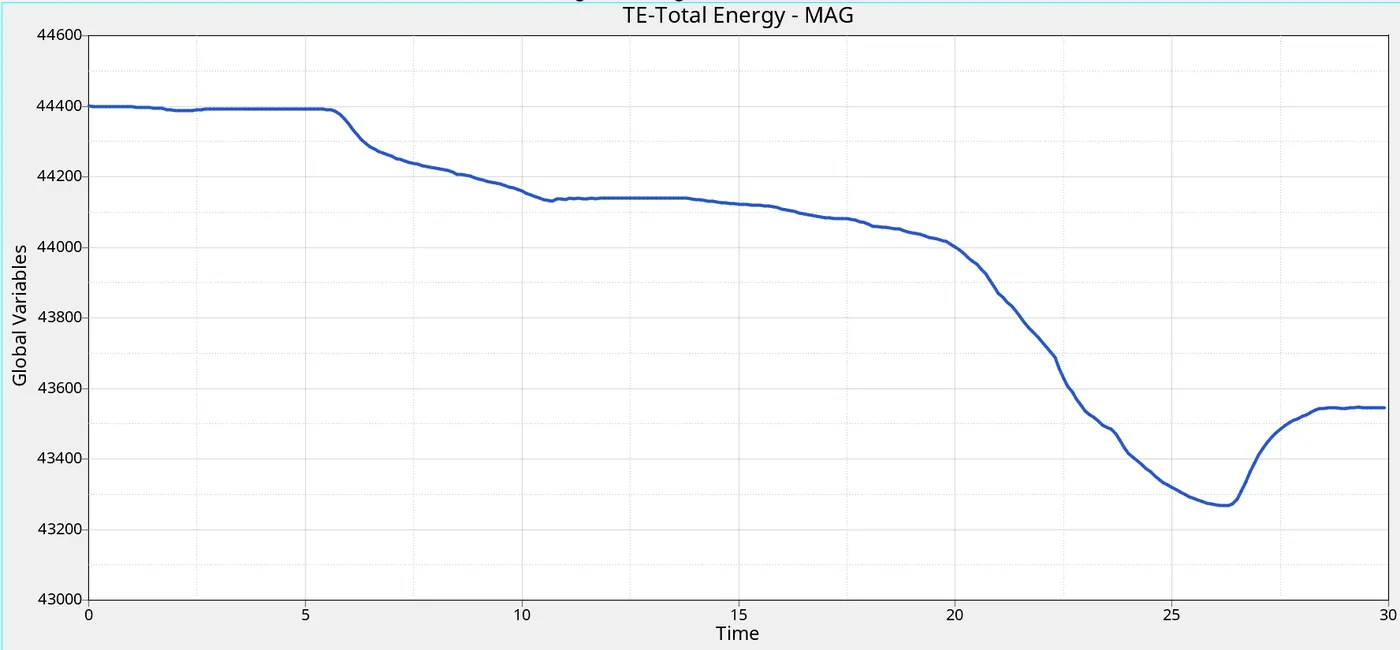
- Max total energy = 44400 gm (mm /ms)².
3J) Plot of all energies.
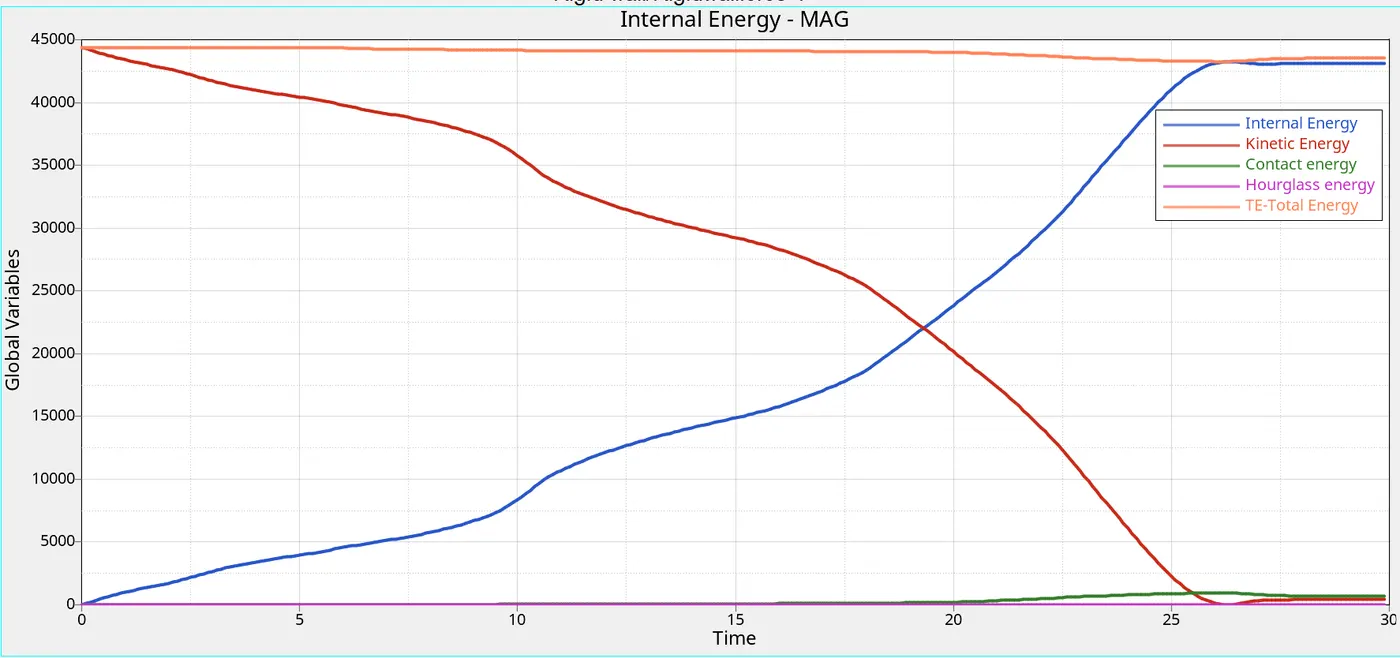
CASE 6 : Create a new notch with nodes only from opposing 2 faces and run.
STEP 1 : Creation of new notch with nodes only from opposing 2 faces.
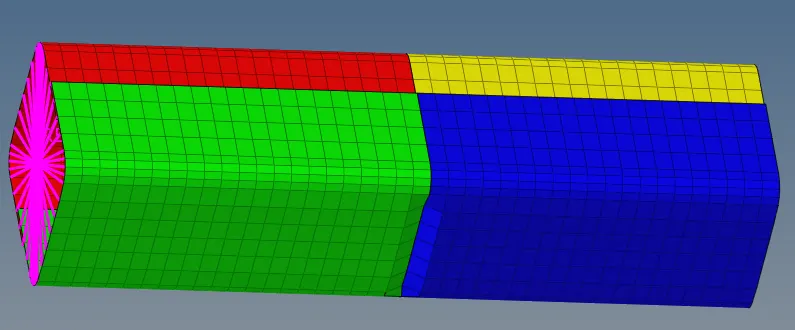
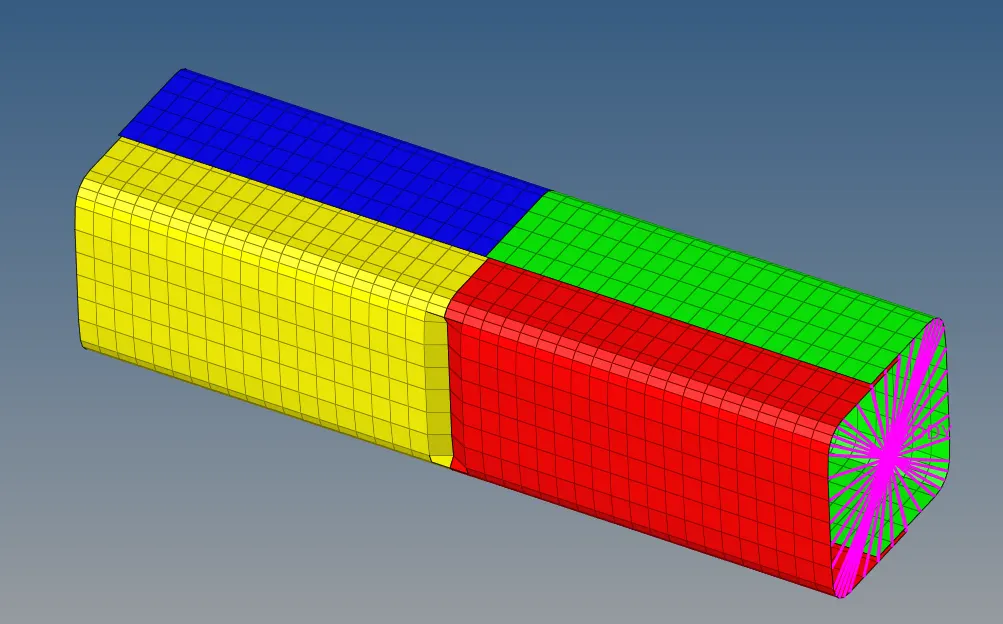
STEP 2 : Repeated the same steps as above case one.( Step 3 to step 6 )
STEP 3 : Post processing
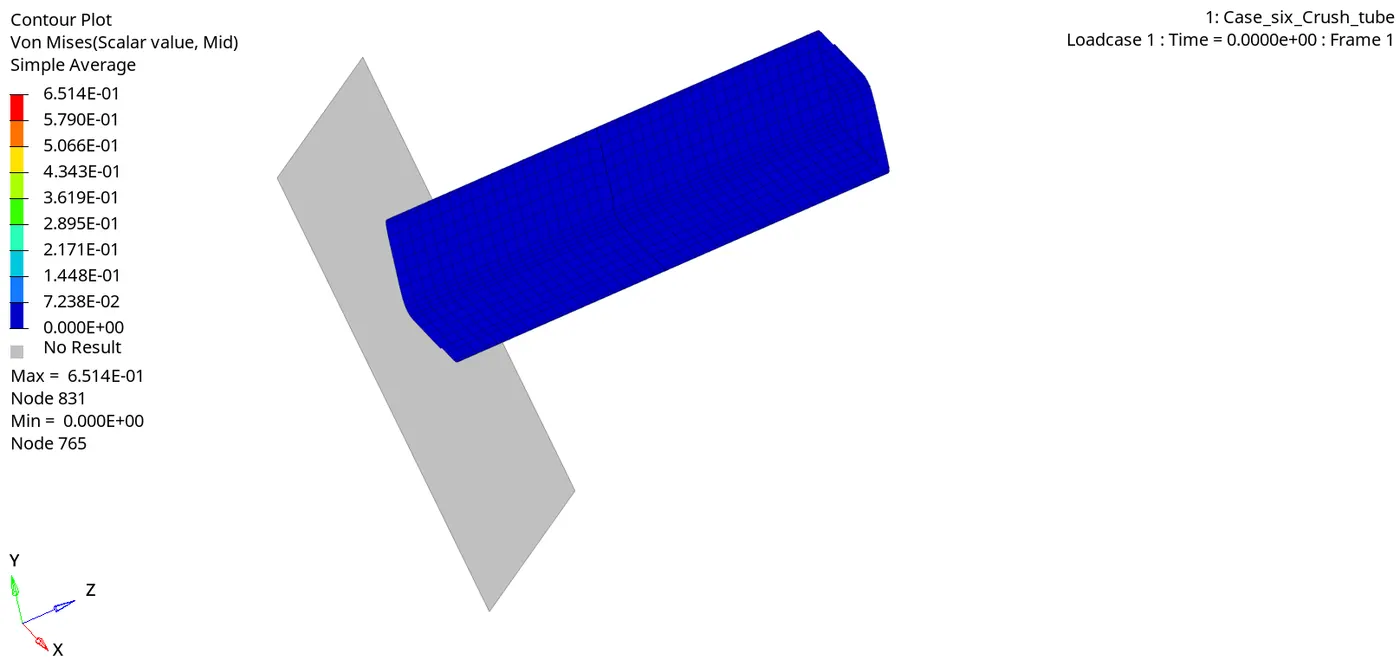
Stress contour :
Max stress developed = 0.651 Mpa.
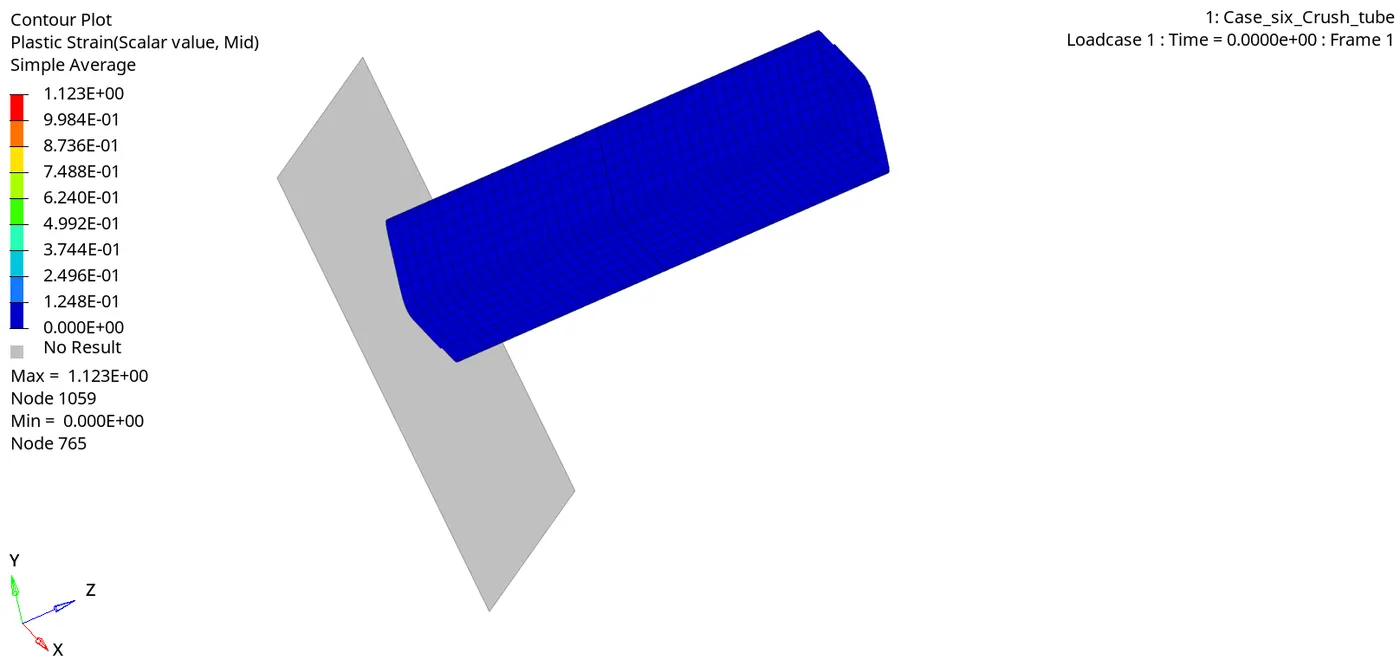
Strain contour:
Max strain developed = 1.12
3a) Plot of the Rigid Wall Forces.
- To plot the graph,go to Hypergraph 2D > Data File > Solver_file_T01 > Apply .
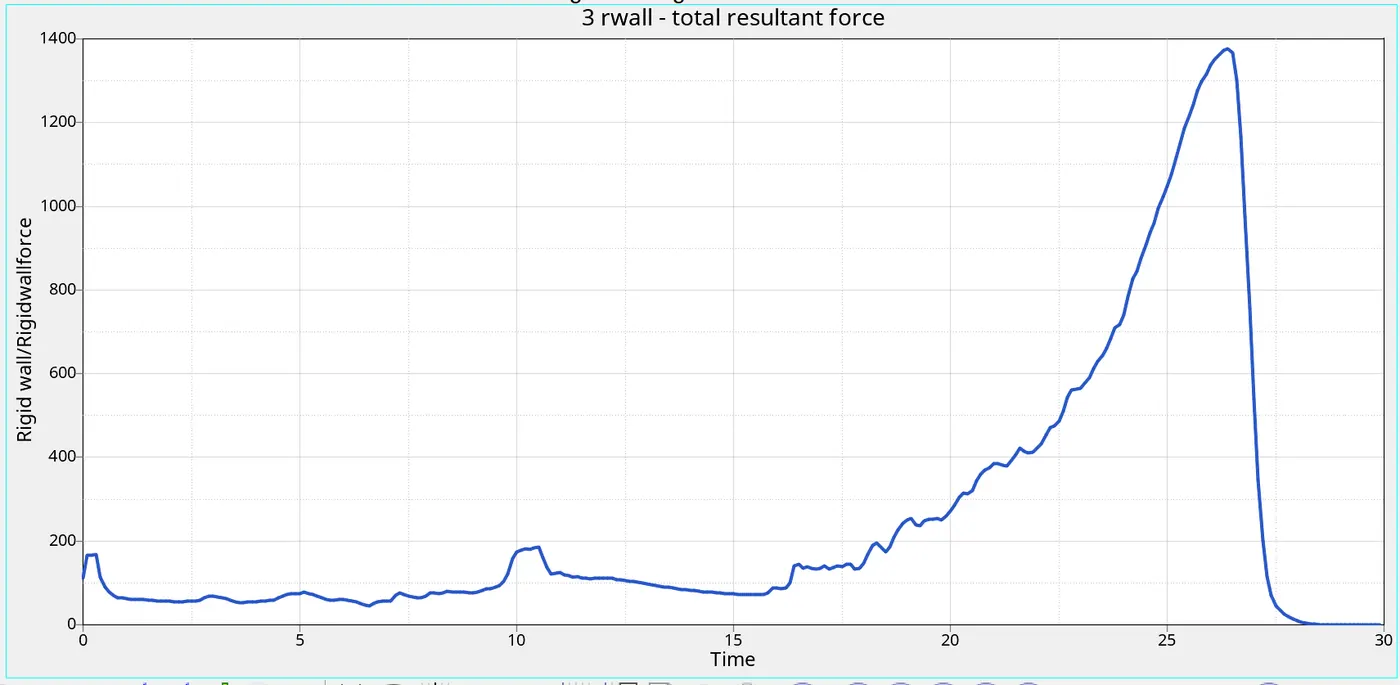
- Rigidwall Max resultant force = 1375 N.
- Here the rigid wall forces is increased due to the created a new notch with single nodes only on opposite faces of the crash tube.
- The maximum rigid wall forces value obtained in this case is 1375 N It is high when compared to the previous cases.
3b) Plot of internal energy.
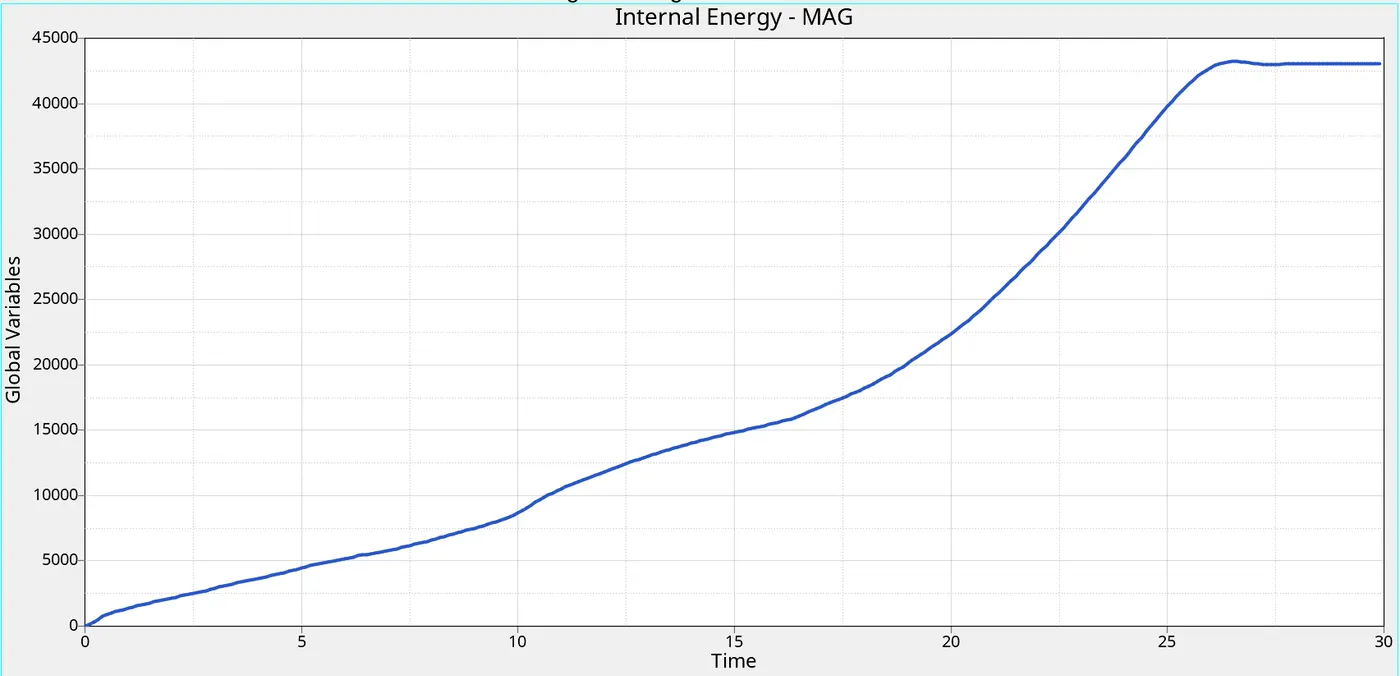
- Max internal energy = 43225 gm (mm /ms²).
- Initially internal energy of the steel tube is zero, because there is no contact between rigidwall and steel tube. after steel tube crush against the rigidwall deformation occurs , then the internal energy of the plate gradually increases,why because the deformation or displacement is happening,when the displacement increases the internal energy increases.
3c) Plot of kinetic energy.
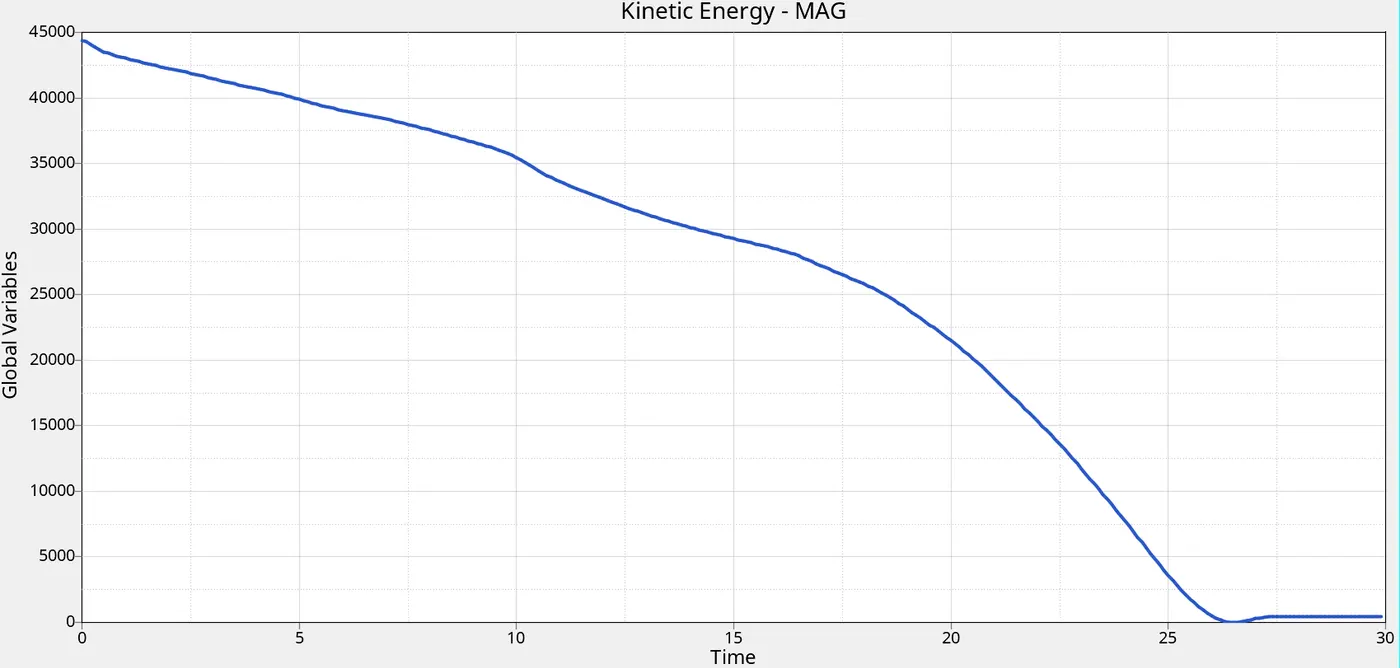
- Max kinetic energy = 44400 gm (mm /ms)²
- Here kinetic energy is increasing in the beginning itself,Why because the initial velocity is given for the component. And it goes on decreasing,cause the deformation is happening to the crash tube, so the kinetic energy is decreasing.
3d ) Plot of seamweld force.
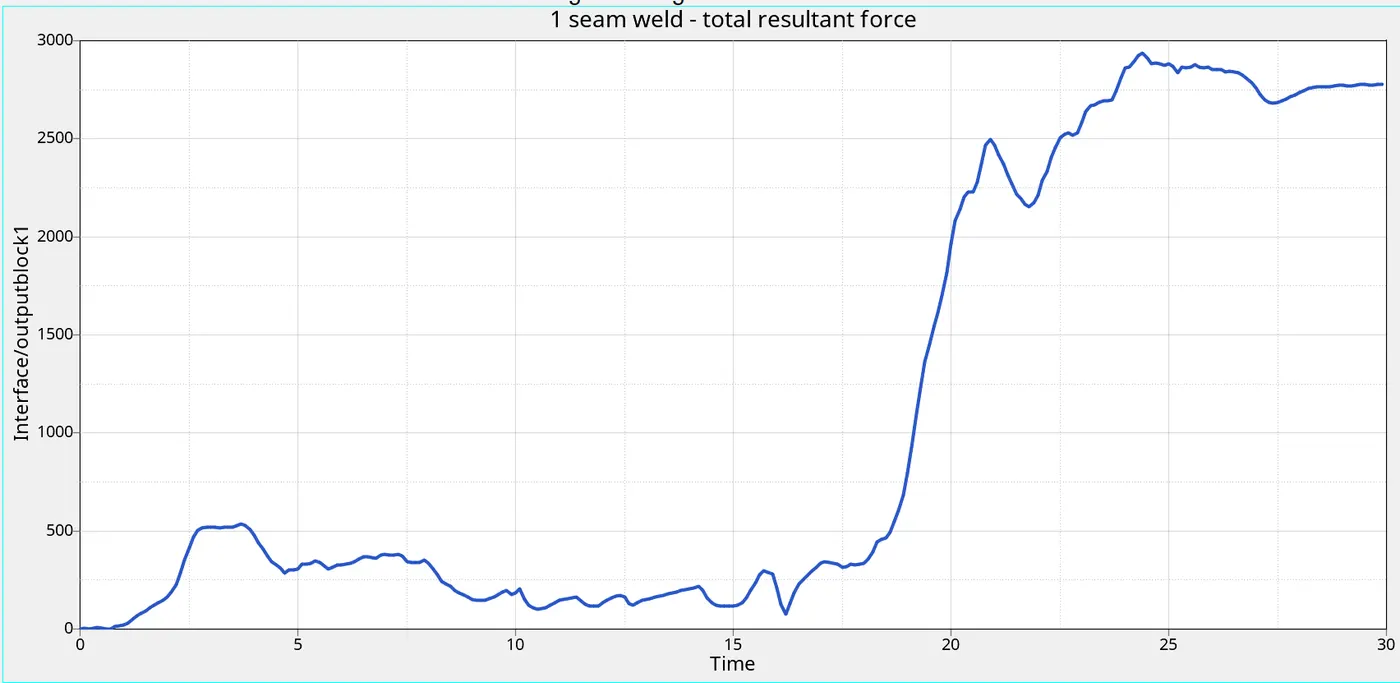
- Maximum seam weld resultant force = 2937 N.
- Initially seam weld force is low as 1N then after crushing starts on the crash tube it gradually increases upto 3143 N act on seam weld and it decreases, cause after collision,the crash tube will at rest.
3e) Plot of self contact force.
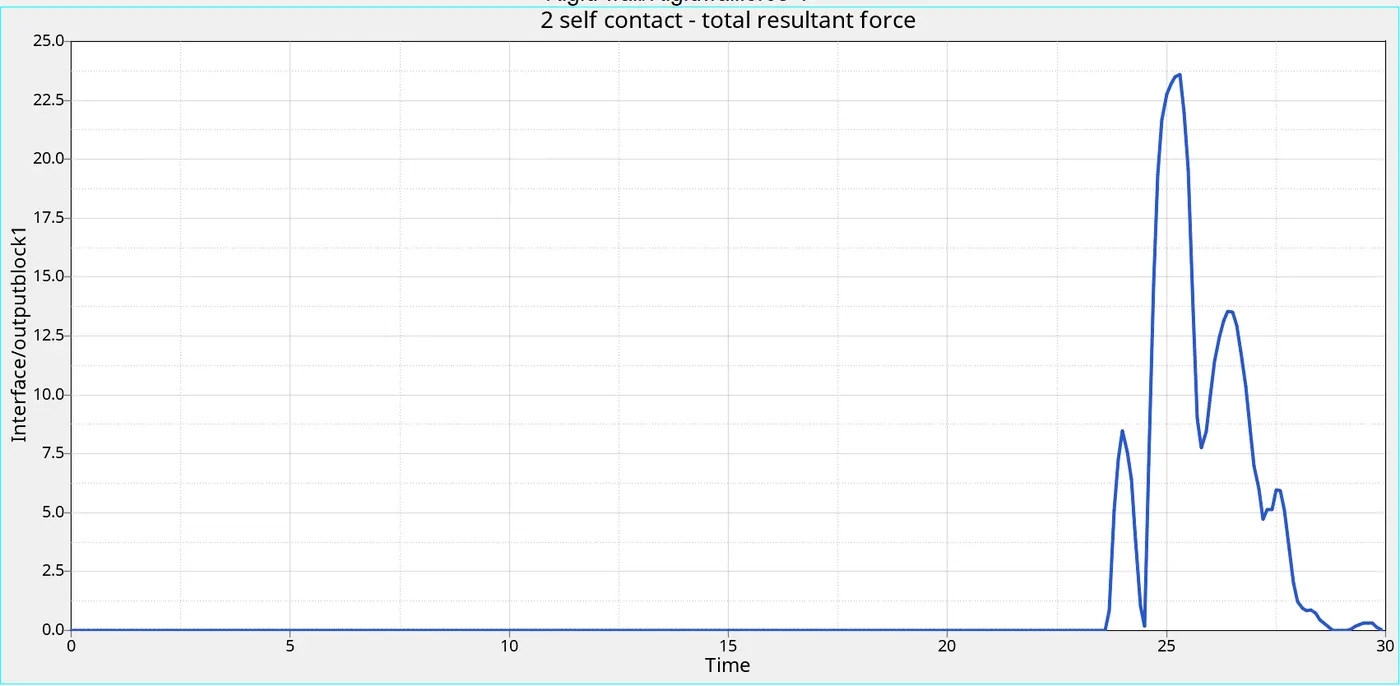
- Max contact resultant force = 23.6 N.
- The contact forces is increases compared to previous case because of insertion of single notches notches in the opposite faces of the crash tube
3f) Plot of TYPE11 force.
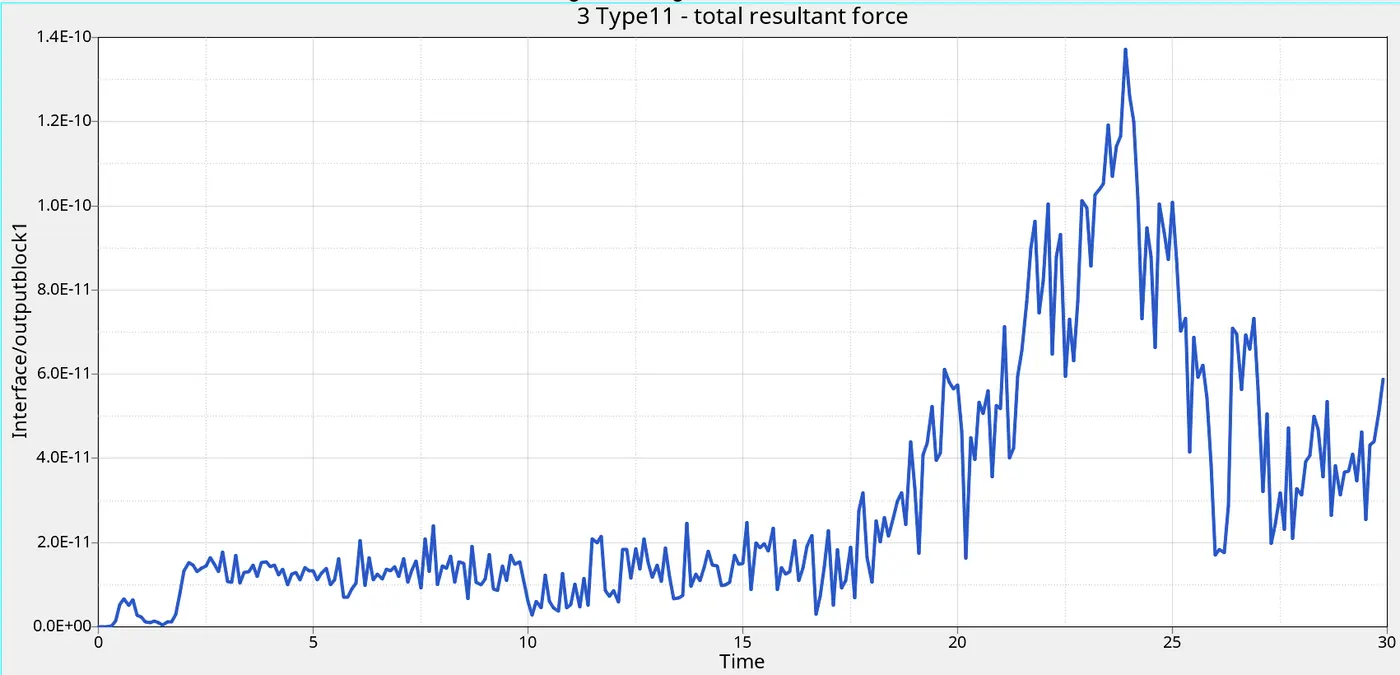
- Here the Type 11 Contact Forces are starting from origin and increasing due to the elements come into the contact and its suddenly reaches at peak due to there will be no edge to edge penetration,all the elements come into the contact,So its suddenly reaches the peak. And its decreasing after the collison,Cause the crash tube will be at rest.
3g) Plot of contact energy.
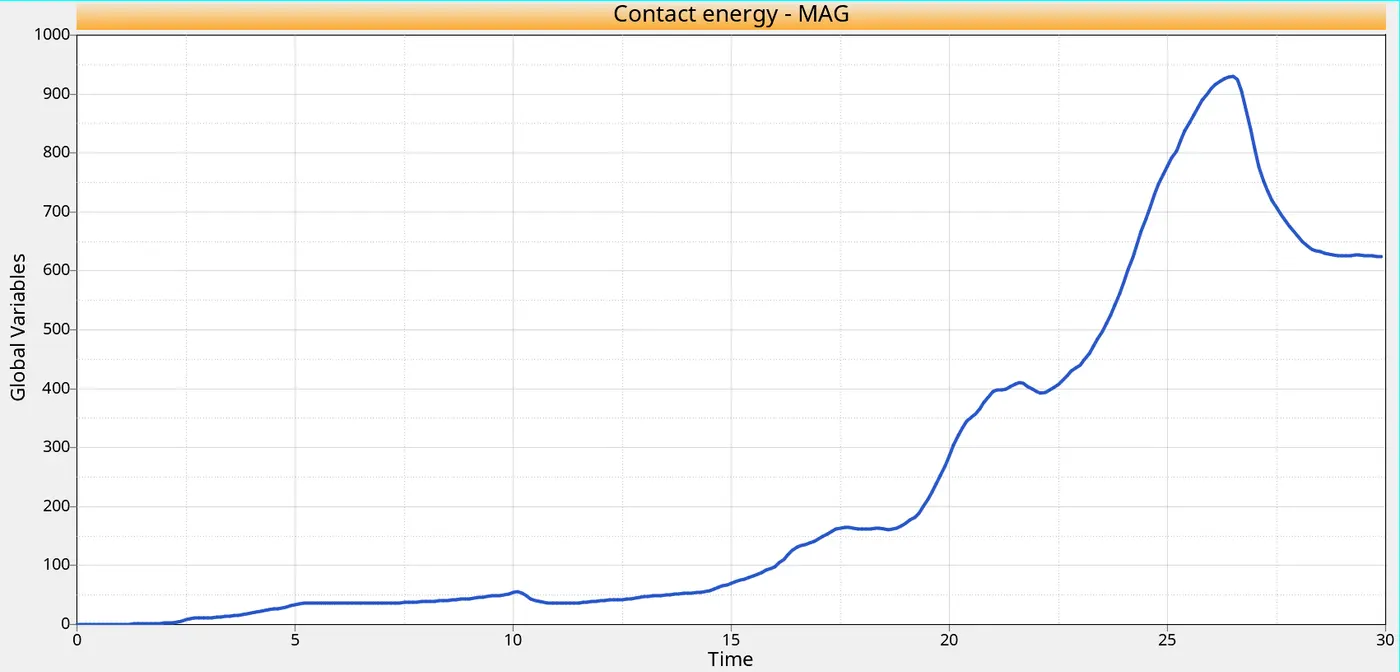
- Max contact energy = 929
- Here the contact energy starts from origin,Cause the crash tube component is in intial condition. Intially there is no contact between the crash tube component and rigid wall.
- There is also no deformation intially,But when the component goes and hits on the rigid wall,The contact energy starts increasing upto 929 is higher than the previous case because of reduce the of notche size with nodes only on opposite faces in tthe crash tube, when the deformation or displacement happens to the component,the contact energy increases,cause the crash tube comes into the contact to the rigid wall.So the contact energy goes on increasing.And its decreasing after the collison,cause the crash tube will be at rest.
3h) Plot of hourglass energy.
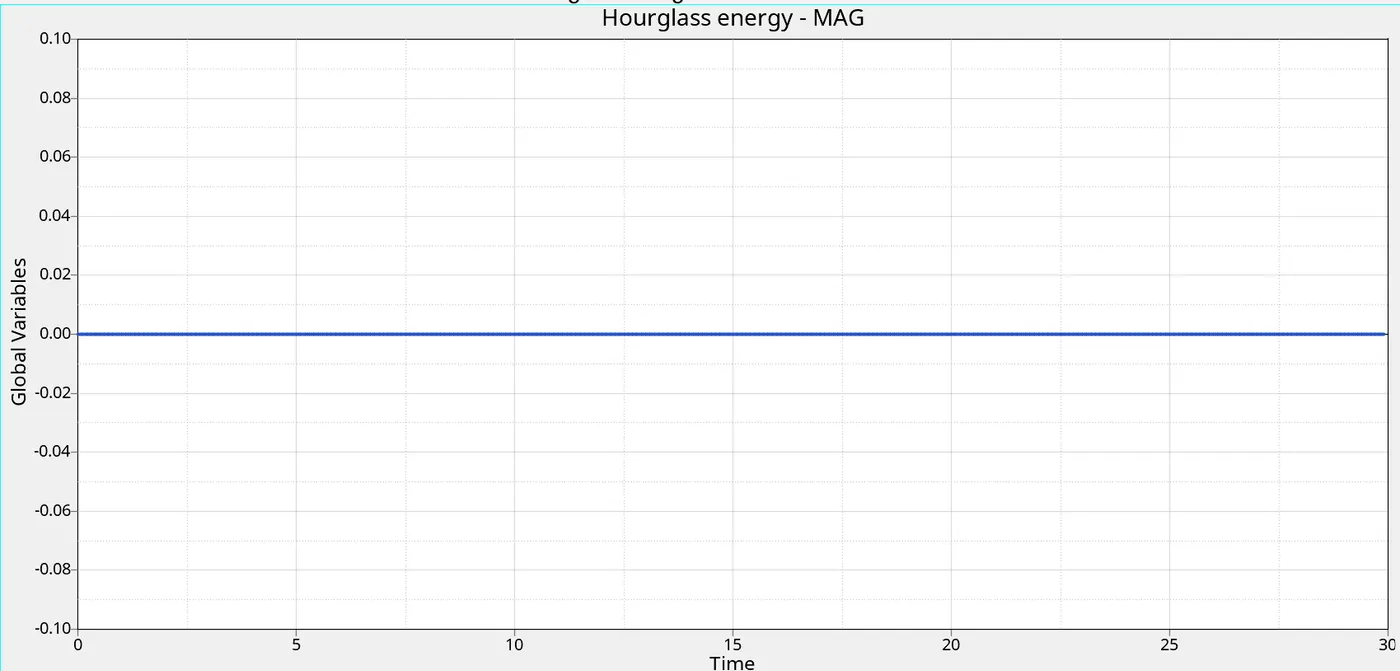
3I) Plot of total energies.
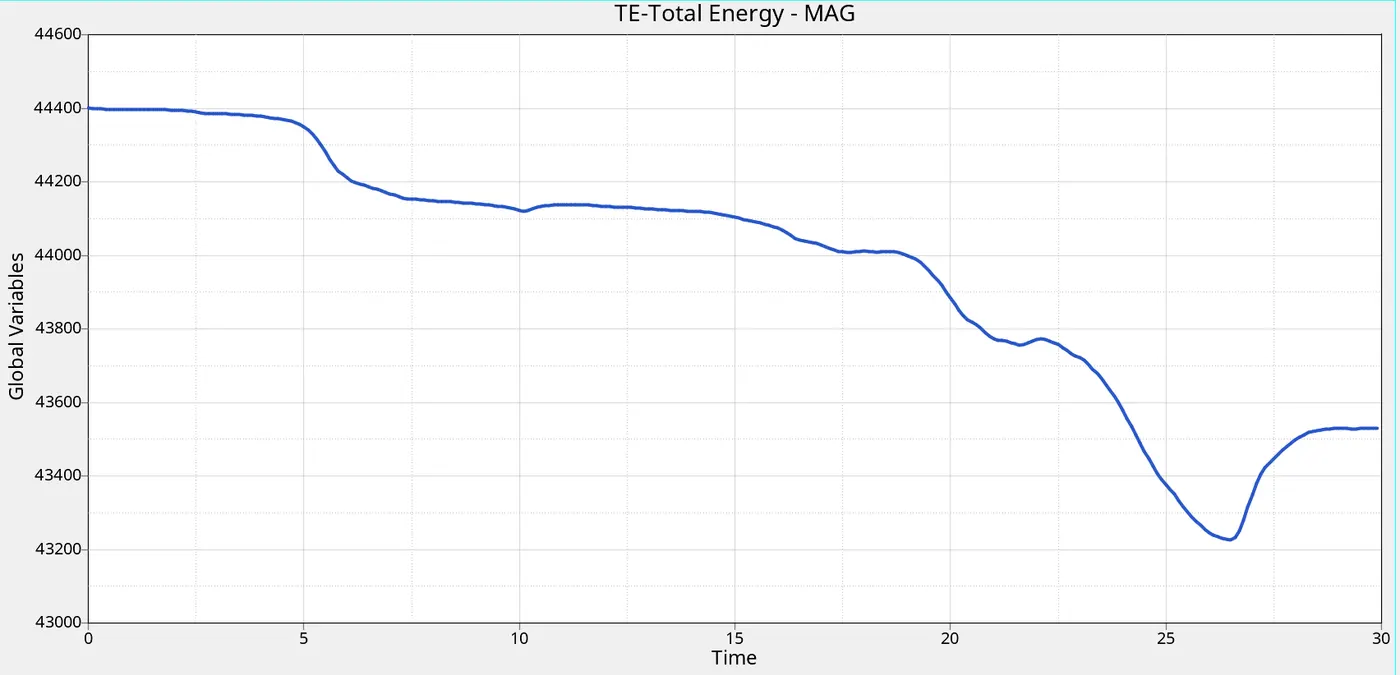
- Max total energy = 44400 gm (mm /ms)².
3J) Plot of all energies.
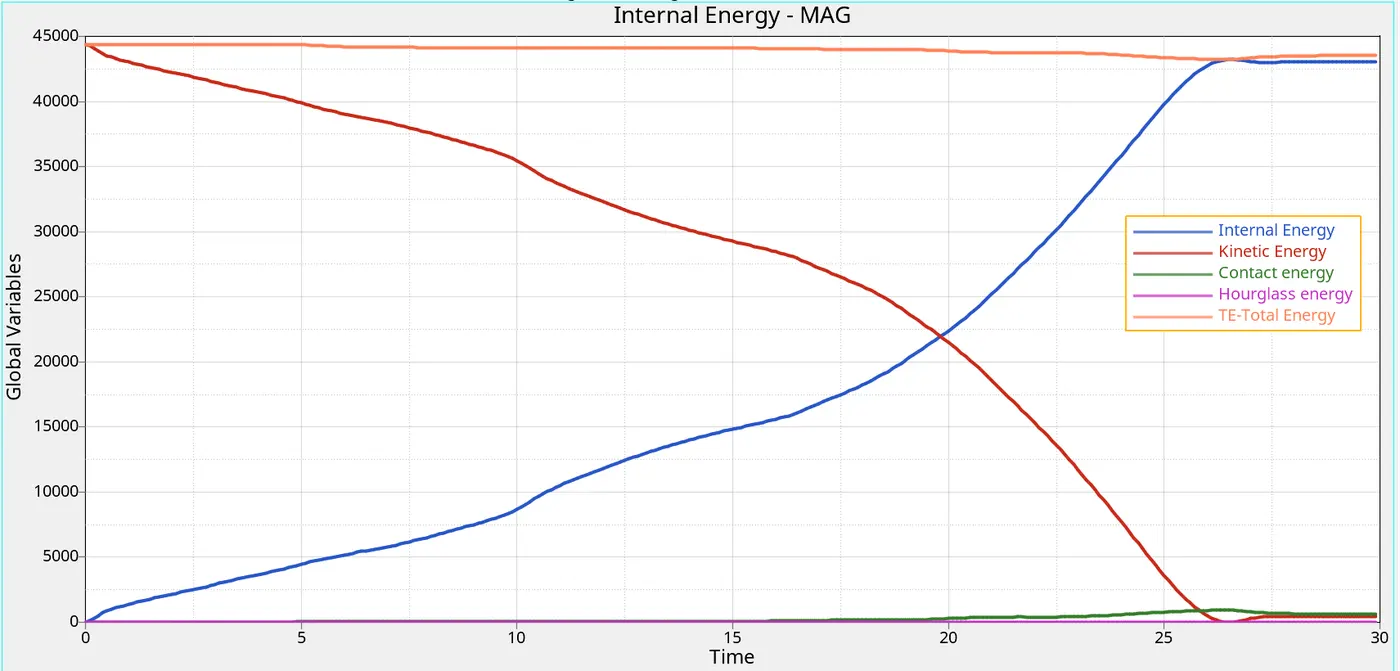
COMPARISON OF RESULTS OF ALL 6 CASES.
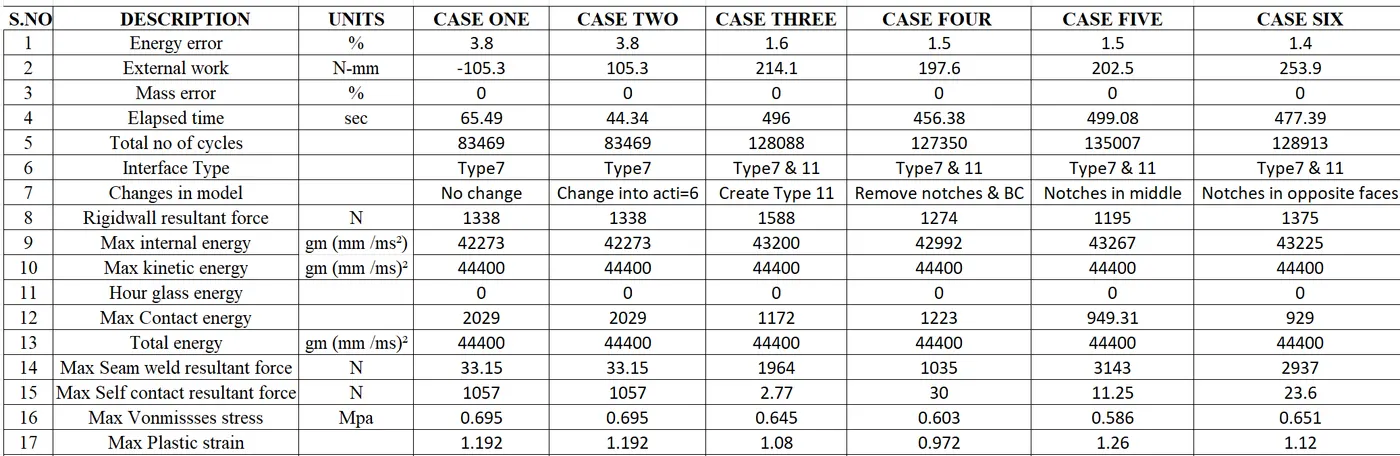
Result :
- Hence the simulation for all the cases were carried out with different parameters.
- Hence the simulation for all the cases were runned successfully.
- Hence the simulation for all the cases were reviewed by hyperview.
- Hence the graphs were plotted for all the cases successfully.
- Hence meshed the bumper component with 6 mm size.
- Atlast,Compared all the results for those cases.
Conclusion and Learning Outcome :
In this challenge5 ,I came to know about
- The effect of notches in the model.
- The penetration causes.
- The diferent parameters for the interfaces.
- The elements deformation during the interface.