Assignment 4-RADIOSS Material Laws Challenge
AIM: To compare results with LAW1, LAW2, LAW27, LAW36 material tabs by comparing the energy results and rigid wall results. For the model, a rupture plate hitting a rigid ball is taken as an example.
OBSERVATION:
CASE1
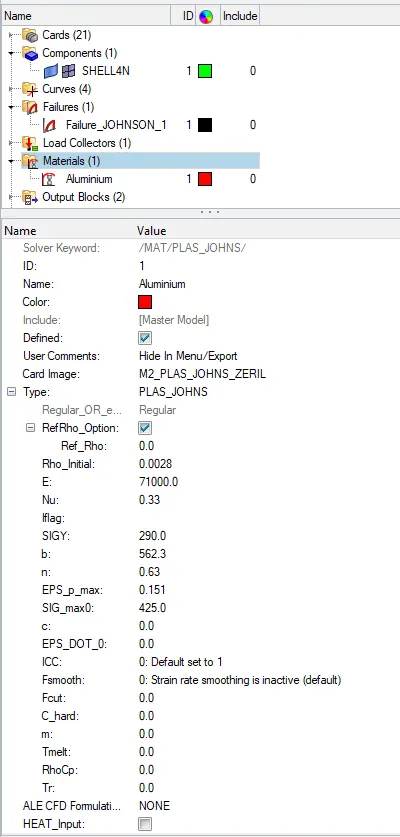
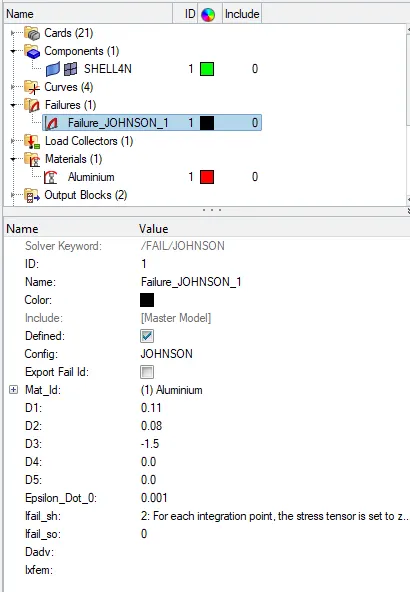
For this case1, the model is run as it is also FAIL/JOHN card is assigned to it.
EPS_p_max assigned for 0.151 that is 15.1%.
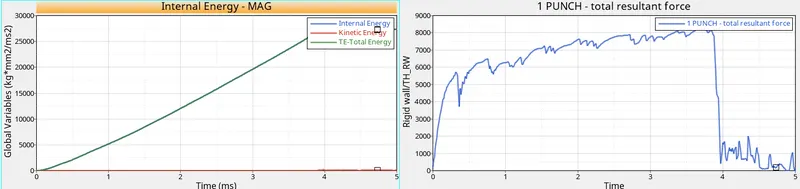
Thus plastic strain at failure is set for 15.1%, thus we can see there is a surge in both energy values as well as rigid wall force at 4ms.
Once the plastic strain reaches 15.1% the elements will get deleted above that.
The energy error is 0.8% which is near to zero and it's acceptable and there is no mass error.
The deflections in the rigid wall till 4ms describe the plate making in contact with the rigid ball so due to heavy vibrations the graph deflects at a specified rate. The sudden decline in the force at 4ms says that the failed elements have been deleted and there is no opposing force for the rigid ball to penetrate.
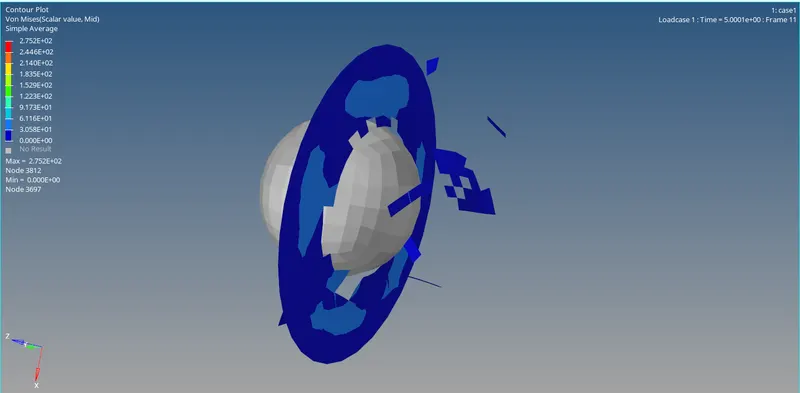
Here based on the animation the failed elements have been deleted from the plate.
The higher stress rate is 275MPa.
The no. of cycles is 49380.
The simulation time taken is 105.64s.
CASE2
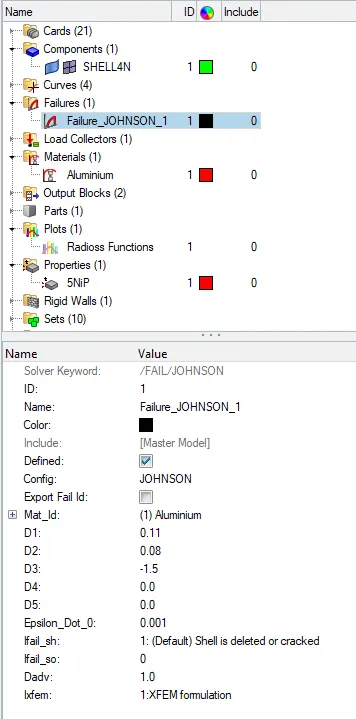
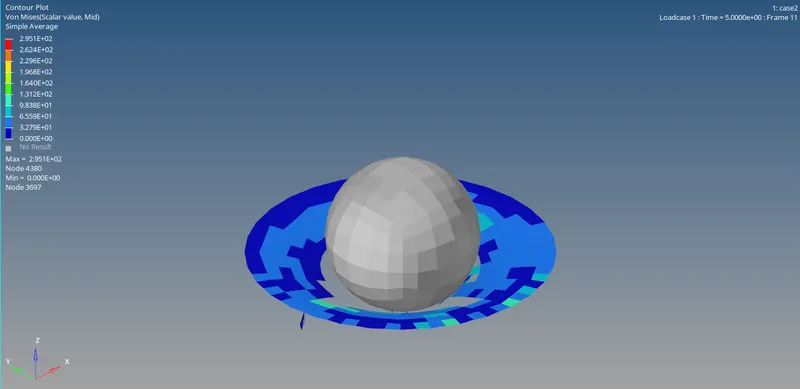
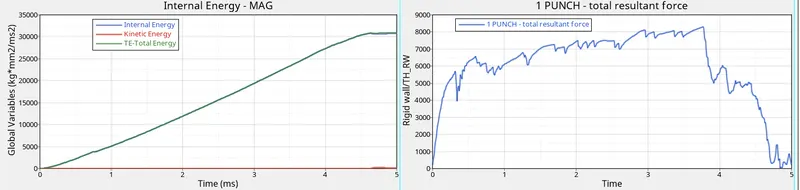
For this case2, the model is run from case1 and the fail/john card is edited for Ifail_sh, Dadv, Ixfem to 1, and to run the model.
EPS_p_max assigned for 0.151 that is 15.1%.
Here the elements get cracked fully and deleted and when the crack reaches the subsequent element boundaries and gets cracked completely the other element fails and it is deleted. This is due to the values assigned for FAIL/JOHN card that is Dadv, Ixfem=1, this deletes an element only when it is cracked completely.
Compared to case1 here the energy is linearly increasing till 4.6ms which is a little greater than case1, this is because of the time taken to perfectly delete an element after complete crack.
The total resultant force has a peak at 3.9ms and rather a sudden decline like in case1, it decreases gradually and ends at 5ms.
The energy error is 4.1% which is acceptable and there is no mass error.
The higher stress rate is 295MPa which is greater when compared to case 1.
The no. of cycles is 49217.
The simulation time taken is 113.77s.
CASE3
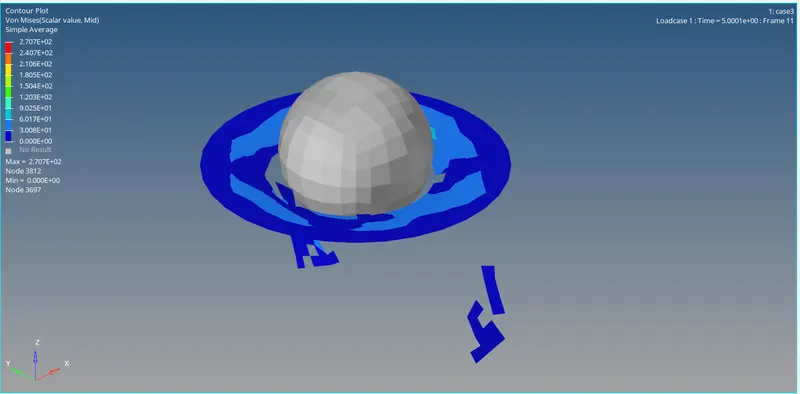
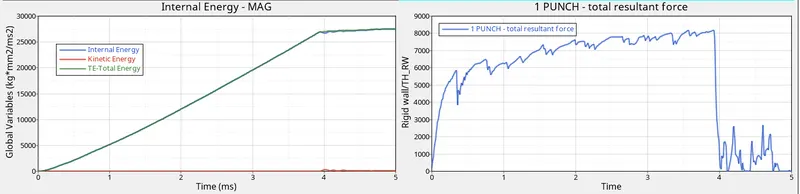
For this case3, the model is run as it is from case2, and FAIL/JOHN card is deleted in this.
EPS_p_max assigned for 0.151 that is 15.1%.
Thus plastic strain at failure is set for 15.1%, thus we can see there is a surge in both energy values as well as rigid wall force at 3.9ms.
Once the plastic strain reaches 15.1% the elements will get deleted above that.
The energy error is 0.8% which is near to zero and it's acceptable and there is no mass error.
Here the energy is increasing linearly till 3.9ms and once elements are deleted and there is no opposing energy and no energy formed further.
The deflections in the rigid wall till 3.9ms describe the plate making in contact with the rigid ball so due to heavy vibrations the graph deflects at a specified rate. The sudden decline in the force at 3.9ms says that the failed elements have been deleted and there is no opposing force for the rigid ball to penetrate.
Here based on the animation the failed elements have been deleted from the plate right after a collision because there is no FAIL/JOHN card assigned for it, so once the plastic strain reached 15.1% the elements fail and it will be deleted.
The higher stress rate is 270MPa.
The no. of cycles is 49408.
The simulation time taken is 104.95s.
CASE4
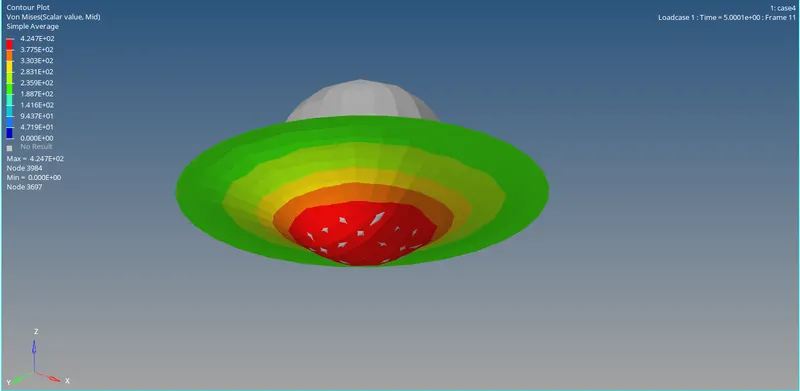
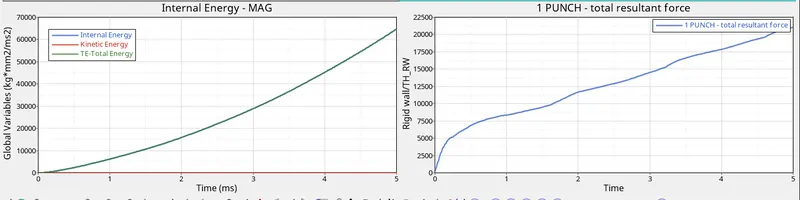
For this case4, the model is run as it is from case3 and here the FAIL/JOHN card is deleted and EPS_p_max value is not assigned, it is set to 0.
Thus there is no EPS_p_max value assigned the radioss automatically sets the default value to 10^30.
The energy error is 3% which is acceptable and there is no mass error.
Due to no FAIL/JOHN card, the elements are not deleted and it withstands till its default strain value. Since the rate is higher we can see the elongation of elements.
Here based on the animation we can see that the elements are not getting deleted due to its default strain at failure value is higher. So, it elongates as much it can.
The stress rate is 424MPa, the highest when compared to the last three cases because the elements are not getting deleted and due to the default strain rate it generates more stress.
Also, we can see the energy is increasing linearly with time due to the continuous penetration of the plate with a rigid ball.
The total resultant force also shows the same result but it is nonlinear because the resultant force increases and decreases slightly with time.
The no. of cycles is 48737.
The simulation time taken is 103.91s.
CASE5
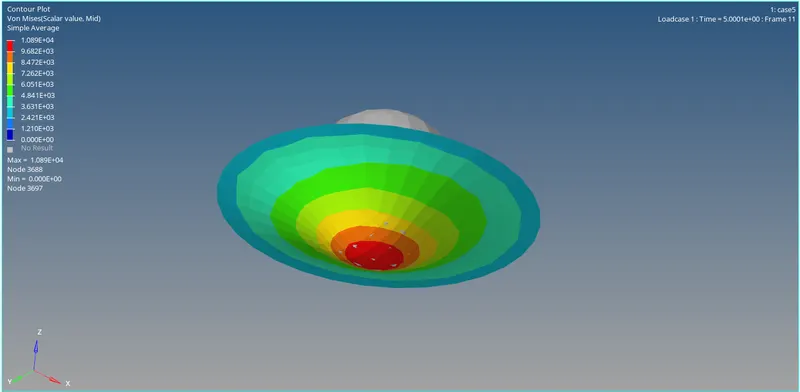
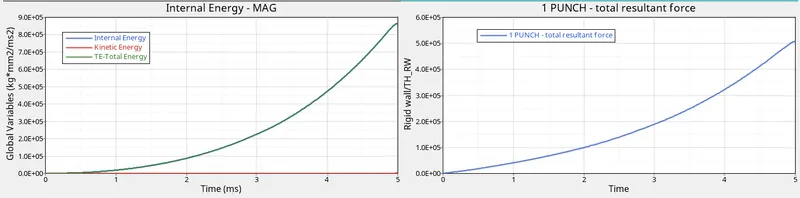
For this case5, the model is run as it is from case 4 and the material card is changed to LAW1 elastic/ MAT1.
This mat card is purely related to the elastic property and not the plastic strain.
Thus there will be no deformation or crack on the rupture plate and the stress is penetrated throughout the plate linearly.
The energy error is 1.3% which is acceptable and there is no mass error.
The energy curves and total resultant force tells that there is no vibration caused due to rupture or crack formation, from the curve we can see that it increases linearly with respect to time, throughout the animation running time.
Here based on the animation due to no element fail or deletion and also crack formation, here the plate withstands the extreme stress, spreading linearly throughpout the plate, thus linear elongation takes place for this elastic material. It ultimately calculates only the elastic stress value.
The stress rate is 1089MPa, which is the highest so far.
The no. of cycles is 47969.
The simulation time taken is 100.85s.
CASE6
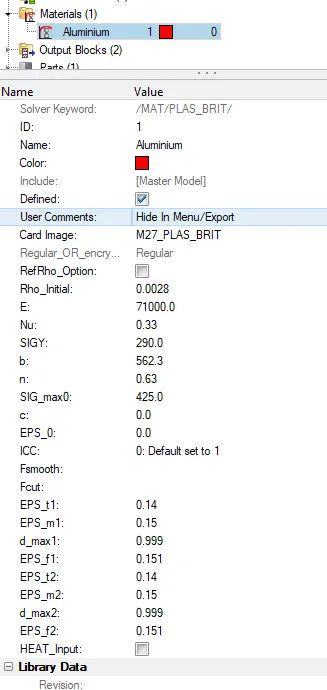
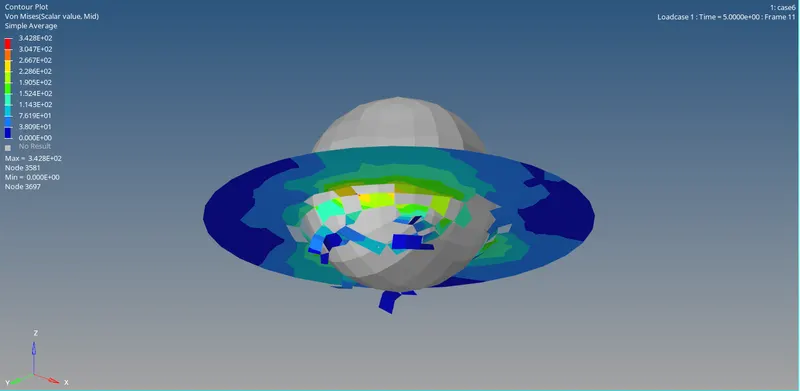
For this case6, the model is run from LAW27_0000.rad. Where M27_PLAS_BRIT material card is assigned, this is the combination of johnson cook with an orthotropic brittle failure model.
Failure and damage occur only for tensile stress only for shells.
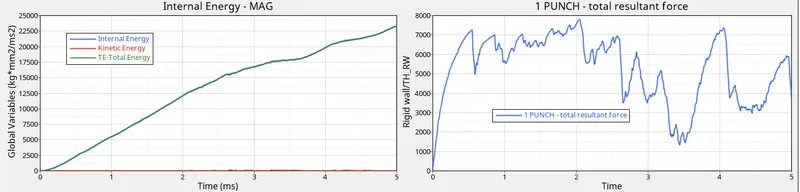
There is a slight linear curve with respect to time we see here due to its penetration and after 4ms the rate of energy is not noticed, thus till that the plate penetrates and there are no opposing elements.
The energy error is -7.1% which is acceptable and there is no mass error.
Also, the total resultant force sets to decrease after penetration till 4ms it sets to fall after that due to no opposing force.
Here based on the animation the elements are getting deleted once it reaches the max strain value. Due to its brittle nature, we can see that the failed elements are getting deleted at a faster time period.
This is useful for modeling the brittle failure of glass.
The stress rate is 342MPa.
The no. of cycles is 41113.
The simulation time taken is 87.52s.
CASE7
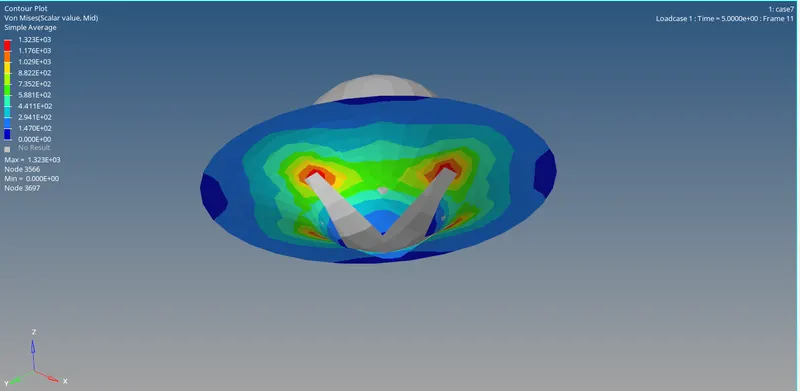
For this case7, the model is run as from case5, and LAW36(PLAS_TAB) material card is assigned and this is most commonly used in industry.
Applicable for brick and shell elements.
The stress-strain curve is defined by youngs modulus(E) and poisons ratio(n).
This method is considered widely because in this the stress and plastic strain values are given by the user and it is simulated and this tells where it is failing. We find it by, the two curves should not intersect with each other, and when the curve intersects it generates failed elements.
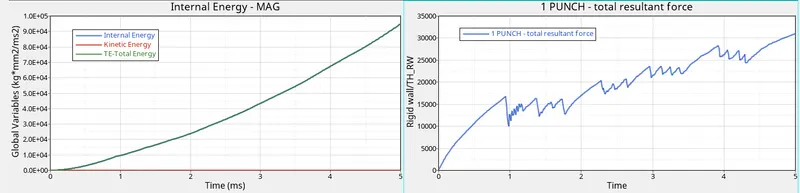
The energy error is 0.5% which is near to zero and it's acceptable and there is no mass error.
From the energy curve, we can tell that it is increasing linearly till it propagates until 5ms, and from there is no energy occurs due to no opposing force.
Also, the total resultant curve tells that it reaches a value of 5ms and decreases due to no opposing force, till the 5ms we can see the graph fluctuates this is due to the deletion of failed elements.
Here based on the animation the failed elements are deleted once it reaches the maximum tensile strain for element deletion. Here we can see that the element once gets failed and cracked it gets deleted.
The higher stress rate is 323MPa.
The no. of cycles is 49019.
The simulation time taken is 104.67s.
CONCLUSION
- Learned about types of material cards.
- about the failure card in hyper mesh.
- about internal energy, kinetic energy, contact energy, hourglass energy, total energy, rigid wall forces.
- about various types of simulations experienced with many new mat cards and parameters.
- Selecting a correct material model plays a very important role in simulation.
- Mass error and energy error also were with limits due to the recommended shell formulations.
- Case 1 and 6 are more realistic on-field scenarios due to failure cards and built-in strain failure rates.
- Case 2 with its crack propagation feature would be useful in observing small crack propagations.
- Case 7 will be really useful for simulating if test data is available for different strain rates, it will help in crash-based analysis giving more realistic results.